Threshold-Based Recovery in Queue Theory: Addressing Server Breakdowns, Catastrophic Events, and Customer Reneging
Savita1,* and Neeraj Kumar2
1Department of Mathematics, Chandigarh University, Mohali, (Punjab), India-140413
2Department of CSE (AI&ML), Raj Kumar Goel Institute of Technology, Ghaziabad (U.P), India
E-mail: savitamathematics@gmail.com; neerajpundir@yahoo.com
*Corresponding Author
Received 11 September 2024; Accepted 10 January 2025
Abstract
In this research article, we present a comprehensive analysis of a repairable queueing system that incorporates a threshold-based recovery policy to address server breakdowns, catastrophic events, and customer behaviors such as reneging and balking. In this model, the server fails only when at least one customer is present, and recovery is initiated once the number of customers in the queue reaches a specified threshold (). We derive closed-form expressions for the system’s steady-state solutions using successive over-relaxation. The study develops critical system characteristics, including the number of customers in the system, the probability of the server being busy, the effective arrival rate, and the expected waiting time. We formulate a cost model to determine the optimal threshold value, system capacity, and service rate that minimize the total cost, which includes repair costs, downtime expenses, and revenue loss. Optimization is performed using Newton-Quasi method. The findings offer valuable insights into queue system design and management, aiding decision-makers in optimizing cost-effectiveness and enhancing overall system performance.
Keywords: Breakdown, reneged customers, balking, catastrophic, queue, threshold-based recovery policy.
1 Introduction
Queue systems are ubiquitous across various sectors, from customer service centers to digital platforms, where smooth operation is essential for organizational success. However, these systems frequently encounter barriers such as server breakdowns, catastrophic events, and customer behavior phenomena like reneged customers and balking. This research initiates an extensive cost analysis of finite capacity queue systems, aiming to investigate the financial implications associated with these challenges and evaluate the efficacy of implementing a threshold-based recovery policy. The significance of this inquiry lies in its potential to provide decision-makers with actionable insights for crafting and managing queue systems effectively. Server breakdowns can lead to service disruptions, resulting in financial setbacks and customer dissatisfaction. The complexity of these challenges is further compounded by the occurrence of catastrophic events. To address these issues, the study integrates a threshold-based recovery policy, seeking to identify strategies that effectively mitigate costs. Reneged customers and balking individuals who leave the queue prematurely and those who choose not to join it introduce a human-centric perspective to the investigation. A comprehensive understanding and resolution of the factors influencing customer behavior are imperative for optimizing the overall performance of the system.
Queueing theory remains a vital tool in optimizing performance metrics in both manufacturing and service systems. Classic models like and continue to be foundational, but recent research has expanded these models to address more complex and realistic scenarios. In the last few years, researchers have focused on integrating artificial intelligence (AI) and machine learning (ML) into queueing models to enhance predictive capabilities and system optimization. Recent studies have deepened the understanding of balking and reneging behaviors in queueing systems. For instance, Li and Zhang [14] examined the impact of dynamic pricing on customer decisions to balk or renege in online service systems. Their findings highlight that adaptive pricing strategies can mitigate customer impatience, thereby improving system performance (c.f. [17, 20, 32, 21, 18, 27, 10, 12, 6]). Their model includes psychological factors, showing how perceived service quality can reduce reneging rates, especially in critical care environments.
The issue of server breakdowns and the corresponding recovery policies has gained renewed attention due to the increasing complexity of modern manufacturing systems. Recent work by Kumar and Singh [7] introduced a model incorporating predictive maintenance strategies using IoT data, which reduces downtime and enhances system reliability. Their approach leverages real-time data analytics to predict and prevent breakdowns before they occur (c.f. [6, 11, 1]). In another study, Lee and Park [13] proposed a hybrid model combining queueing theory with simulation techniques to assess the impact of different recovery policies in a multi-server system. Their results indicate that a proactive recovery policy, informed by real-time monitoring, significantly reduces overall system downtime.
Cost analysis in queueing systems has seen innovations through the integration of AI-driven optimization techniques. For instance, Wang et al. [33] proposed a novel approach combining queueing theory with deep reinforcement learning (DRL) to optimize service rates and minimize total operational costs in complex systems. Their research demonstrates that AI-driven models can outperform traditional optimization methods in dynamic and uncertain environments (c.f. [20, 25, 26, 28, 24, 26, 8, 22]). Additionally, Nguyen et al. [15] examined the cost implications of incorporating renewable energy sources into manufacturing systems. Their model evaluates the trade-offs between energy costs and system performance, offering insights into sustainable manufacturing practices.
Recent advances in queueing models have focused on enhancing their applicability in real-time and dynamic environments. One notable development is the integration of digital twins and cyber-physical systems with queueing models, as explored by Xu and Liu [34]. Their research shows that digital twins, which provide a real-time virtual representation of physical systems, can be used alongside queueing theory to optimize system performance dynamically (c.f. [34, 3, 5, 2, 29, 19, 23, 9]). Furthermore, the use of blockchain technology in queue management has been a topic of interest. Yadav and Sharma [35] introduced a decentralized queue management system using blockchain to ensure transparency and fairness in service prioritization. Their study highlights the potential of blockchain to revolutionize queue management in sectors like finance and healthcare.
The application of queueing theory to IoT and smart manufacturing has been a rapidly growing field. Recent studies have focused on integrating edge computing with queueing models to enhance decision-making at the manufacturing floor level. For example, Chen et al. [3] proposed a queueing model that incorporates edge computing to process data locally, reducing latency and improving real-time responsiveness in smart manufacturing systems (c.f. [30, 16]). Additionally, the use of 5G networks to support IoT-enabled queueing systems has been explored by Zhang and Wu [36]. Their research indicates that 5G’s low latency and high reliability make it an ideal platform for implementing advanced queueing models in Industry 4.0 environments, particularly in high-tech manufacturing sectors like semiconductor production. The analysis considers a spectrum of factors, including repair costs, downtime expenses, and potential revenue loss, providing a holistic view of the financial implications associated with different operational scenarios. By systematically comparing recovery policies based on predetermined thresholds, this study aims to pinpoint the most cost-efficient strategy for minimizing the combined financial impact of server breakdowns, catastrophic events, Reneged Customers, and Balking. The study delves into the dynamics of the queueing system under server breakdowns and explores the implications of catastrophic,reneged customers, and balking. events on system performance. Recently Mouloud Cherfaoui et al. [4] investigates a feedback queueing system with a distinctive multiple vacation policy, balking, server’s states-dependent reneging, and retention of reneged customers. The model features individual timers for customers during vacation and busy periods, with patience times characterized by general probability distribution functions (GV and GB). Som and Seth [31] investigate a single-server finite capacity feedback queuing system featuring buffer modified reverse balking and retention of impatient customers. The paper derives steady-state probabilities, explores performance measures.
The structure of this paper is organized as follows: Sections 2 and 3 provide a comprehensive description of the queueing model, along with the introduction of an equation for calculating time-independent probabilities. Section 4 explores the performance measures for queue models. Sections 5 focus on cost analysis, respectively. Section 6 discusses the Newton-Quasi Method, with numerical results presented in Section 7. Finally, Sections 8 and 9 respectively real life application and summarizes our findings and provides conclusive remarks on the implications and contributions of this research.
2 Basic Assumptions
We investigate the dynamics of a queueing system with server breakdowns and threshold-based recovery, considering the phenomena of reneging, balking, and catastrophic events. The model assumptions are outlined below:
1. Customers arrive at the system following a Poisson process with parameter .
2. Upon arrival, customers join a single waiting line, adhering to the first-come-first-served (FCFS) discipline.
3. During active periods, service times are exponentially distributed with a mean of .
4. The server can handle only one customer at a time, causing incoming customers to wait if the server is occupied.
5. Breakdowns occur only when at least one customer is in the system. Breakdown times are exponentially distributed with a rate of .
6. Following a breakdown, the server remains inactive until the queue reaches a predefined threshold value (where ). Repair times are exponentially distributed with a mean of .
7. Upon completion of repairs, the server resumes operations and serves customers until the system is empty.
8. The system’s capacity is denoted by (where ).
9. Various stochastic processes within the system are assumed to be independent of one another.
This research develops and describes the mathematical representation of the current state of the governing model at any time .
where
Then, the system is a continuous time Markov process with a state space ; , . Furthermore, the steady-state probabilities of the system are defined as follows:
3 Chapman–Kolmogorov Equation
The Chapman-Kolmogorov equation, a cornerstone of stochastic processes, outlines the transition probabilities in Markov processes, providing insights into future states based on present conditions. Equations (1) to (9) presented here delineate the dynamic evolution of state probabilities, which is crucial for understanding the intricate dynamics and dependencies within the system. Mastery of these equations is essential for effectively modeling and analyzing complex systems under uncertainty, with applications spanning various domains, including physics, engineering, and finance. In the steady state, the system reaches equilibrium, meaning no further changes occur over time.
| (1) | |
| (2) | |
| (3) | |
| (4) | |
| (5) | |
| (6) | |
| (7) | |
| (8) | |
| (9) |
Normalization Condition of Probabilities
| (10) |
3.1 Steady-State Equation
The steady-state solution of the queuing system is achieved by expressing the simultaneous linear equations (Equations (1)–(9)) as a matrix equation, denoted as , where represents a square matrix of size comprising the coefficients of state probabilities as its elements. Concurrently, stands for a column vector of unknown state probabilities with dimensions , while signifies a null vector. By applying the normalizing condition outlined in Eq. 11, the equation is transformed into , where is derived from with the last row modified to include ones, and is a column vector with its final element set to 1. This linear system is represented in augmented matrix form as . Subsequently, employing numerical techniques such as Gauss elimination extended (GEE) or the Successive Over-Relaxation (SOR) method, with an over-relaxation parameter typically set to 1.25 in MATLAB (R2019b) software, facilitates the solution of the non-homogeneous system. Upon solving, the stationary probabilities derived from this equation system are used to determine the classification of the queuing system.
4 Performance Characteristics
The system characteristics can be effectively described by evaluating performance measures using steady-state probabilities. These metrics serve as crucial indicators for achieving optimal system performance and are essential for system managers and industrial engineers in enhancing the Grade of Service (GoS). By predicting preventive maintenance requirements and queueing indices, these measures enable proactive management of the relevant queueing system. Noteworthy performance measures include:
1. The expected number of customers in the system:
2. Probability that the server is busy:
3. Probability that the server is broken down:
4. Probability that the server is idle:
5. Probability that the server is blocked:
6. Expected waiting time in the system:
Where is the effective arrival rate given by:
7. Average Balking Rate:
8. Average reneging Rate:
9. Expected number of retained customers in the system after reneging epoch:
10. Throughput of the system:
5 Cost Analysis
Cost analysis is a fundamental issue in queueing theory. We construct an expected cost function per unit time for the finite capacity queuing model, which includes server breakdown, recovery policy, balking, reneging, and retention of reneged customers. In this queueing model, the system capacity , the threshold value , and the server rate are the decision variables. The main aim is to determine the optimal values of . Let us define the cost elements as follows.
The expected cost function is given by
| (11) |
6 Newton-Quasi Method
In our study, we address the complex unimodal nature of the expected total cost, which poses challenges in computing its derivatives. To tackle this, we utilize the Newton-quasi method to globally search for the parameter that minimizes . The problem can be succinctly described as follows:
| (12) |
The Newton-quasi method proceeds as follows:
Step 1: Initialize ,
Step 2: Compute
Step 3: Calculate first derivatives and
Step 4: Determine first trial solution:
Step 5: Update and set
Step 6: Repeat steps 2 to 5 until , where
Step 7: Find the global minimum value
7 Numerical Results
Analyzing the finite capacity system’s performance metrics theoretically is not enough to prove the effectiveness of our model. To ensure its practical utility, we conduct multiple numerical experiments using MATLAB. These experiments allow us to assess how well the proposed finite Markov model, with features such as balking, breakdowns, and a threshold-driven recovery policy, performs in various scenarios, providing valuable insights into its real-world applicability. To achieve this goal, we conduct experiments using the default values for the system parameters.
Table 1 The optimal services rates and expected total cost for different system parameters
| (, , , , ) | Total Iterations | |||
| (8.0,4,1.0,0.3,0.2) | 5.0575 | 390.799 | 8 | 9.05 |
| (9.0,4,1.0,0.3,0.2) | 5.0580 | 390.801 | 8 | 2.41 |
| (10,4,1.0,0.3,0.2) | 5.0581 | 390.801 | 8 | 7.54 |
| (11,4,1.0,0.3,0.2) | 5.0581 | 390.802 | 8 | 2.79 |
| (10,5,1.0,0.3,0.2) | 4.9923 | 391.649 | 8 | 7.64 |
| (10,6,1.0,0.3,0.2) | 4.9312 | 392.335 | 8 | 2.55 |
| (10,7,1.0,0.3,0.2) | 4.8777 | 392.859 | 8 | 2.35 |
| (10,8,1.0,0.3,0.2) | 4.8326 | 393.236 | 7 | 5.53 |
| (10,5,1.1,0.3,0.2) | 5.5843 | 401.448 | 8 | 3.07 |
| (10,5,1.2,0.3,0.2) | 6.1667 | 411.070 | 8 | 5.57 |
| (10,5,1.3,0.3,0.2) | 6.7402 | 420.532 | 8 | 1.92 |
| (10,5,1.4,0.3,0.2) | 7.3056 | 429.851 | 8 | 1.46 |
| (10,5,1.0,0.4,0.2) | 4.7270 | 388.562 | 9 | 8.07 |
| (10,5,1.0,0.5,0.2) | 4.5146 | 386.196 | 9 | 1.61 |
| (10,5,1.0,0.6,0.2) | 4.3344 | 384.282 | 7 | 1.76 |
| (10,5,1.0,0.7,0.2) | 4.1743 | 382.661 | 8 | 4.57 |
| (10,5,1.0,0.3,0.3) | 4.3944 | 383.393 | 8 | 2.17 |
| (10,5,1.0,0.3,0.4) | 3.7368 | 374.141 | 8 | 1.23 |
| (10,5,1.0,0.3,0.5) | 3.0056 | 363.581 | 8 | 1.02 |
| (10,5,1.0,0.3,0.6) | 2.1853 | 351.233 | 6 | 1.75 |
A higher failure rate leads to inefficiency in system behavior, which can be addressed by enhancing the recovery rate.
Table 2 Numerical simulation regarding different system characteristics wrt , ,
| (K, , T) | |||||||||||
| (6, 1, 4) | 0.4887 | 0.2107 | 0.1105 | 0.6788 | 4.941E-4 | 0.9354 | 0.5225 | 0.2566 | 0.0100 | 0.0067 | 2.6685 |
| (8, 1, 4) | 0.4891 | 0.2107 | 0.1105 | 0.6788 | 2.25E-05 | 0.9357 | 0.5227 | 0.2569 | 0.0101 | 0.0067 | 2.6686 |
| (12, 1, 4) | 0.4892 | 0.2107 | 0.1105 | 0.6788 | 3.78E-08 | 0.9358 | 0.5227 | 0.2570 | 0.0101 | 0.0067 | 2.6686 |
| (8, 0.3, 4) | 0.1371 | 0.0698 | 0.0455 | 0.8847 | 7.56E-09 | 0.2931 | 0.4678 | 0.0277 | 0.0013 | 0.0009 | 2.8636 |
| (8, 0.4, 4) | 0.1862 | 0.0914 | 0.0583 | 0.8504 | 5.72E-08 | 0.3880 | 0.4798 | 0.0479 | 0.0022 | 0.0015 | 2.8252 |
| (8, 0.5, 4) | 0.2359 | 0.1123 | 0.0698 | 0.8179 | 2.63E-07 | 0.4818 | 0.4897 | 0.0729 | 0.0032 | 0.0022 | 2.7906 |
| (8, 1, 4) | 0.4891 | 0.2107 | 0.1105 | 0.6788 | 2.25E-05 | 0.9357 | 0.5227 | 0.2569 | 0.0101 | 0.0067 | 2.6686 |
| (8, 1, 5) | 0.5180 | 0.2042 | 0.1201 | 0.6757 | 5.12E-05 | 0.9351 | 0.5539 | 0.2594 | 0.0116 | 0.0077 | 2.6398 |
| (8, 1, 6) | 0.5352 | 0.2004 | 0.1251 | 0.6745 | 1.185E-4 | 0.9348 | 0.5725 | 0.2603 | 0.0126 | 0.0084 | 2.6246 |
Table 3 Numerical simulation regarding different system characteristics wrt , ,
| (3.0, 5.0, 0.6) | 0.4891 | 0.2107 | 0.1105 | 0.6788 | 2.25E-05 | 0.9357 | 0.5227 | 0.2569 | 0.0101 | 0.0067 | 2.6686 |
| (4.0, 5.0, 0.6) | 0.3940 | 0.1756 | 0.0936 | 0.7308 | 8.12E-06 | 0.9461 | 0.4164 | 0.2154 | 0.0075 | 0.0050 | 3.6254 |
| (5.0, 5.0, 0.6) | 0.3291 | 0.1501 | 0.0809 | 0.7690 | 3.81E-06 | 0.9538 | 0.3450 | 0.1848 | 0.0059 | 0.0039 | 4.5954 |
| (3.0, 5.0, 0.6) | 0.4891 | 0.2107 | 0.1105 | 0.6788 | 2.25E-05 | 0.9357 | 0.5227 | 0.2569 | 0.0101 | 0.0067 | 2.6686 |
| (3.0, 6.0, 0.6) | 0.4877 | 0.2111 | 0.1100 | 0.6789 | 1.95E-05 | 0.9358 | 0.5211 | 0.2568 | 0.0100 | 0.0067 | 2.6700 |
| (3.0, 7.0, 0.6) | 0.4866 | 0.2113 | 0.1096 | 0.6791 | 1.75E-05 | 0.9358 | 0.5200 | 0.2567 | 0.0099 | 0.0066 | 2.6711 |
| (3.0, 5.0, 0.7) | 0.4466 | 0.2060 | 0.0972 | 0.6967 | 1.59E-05 | 0.9393 | 0.4755 | 0.2426 | 0.0086 | 0.0057 | 2.7083 |
| (3.0, 5.0, 0.8) | 0.4123 | 0.2017 | 0.0864 | 0.7119 | 1.15E-05 | 0.9424 | 0.4375 | 0.2304 | 0.0075 | 0.0050 | 2.7409 |
| (3.0, 5.0, 0.9) | 0.3840 | 0.1976 | 0.0773 | 0.7251 | 8.43E-06 | 0.9450 | 0.4063 | 0.2199 | 0.0065 | 0.0044 | 2.7680 |
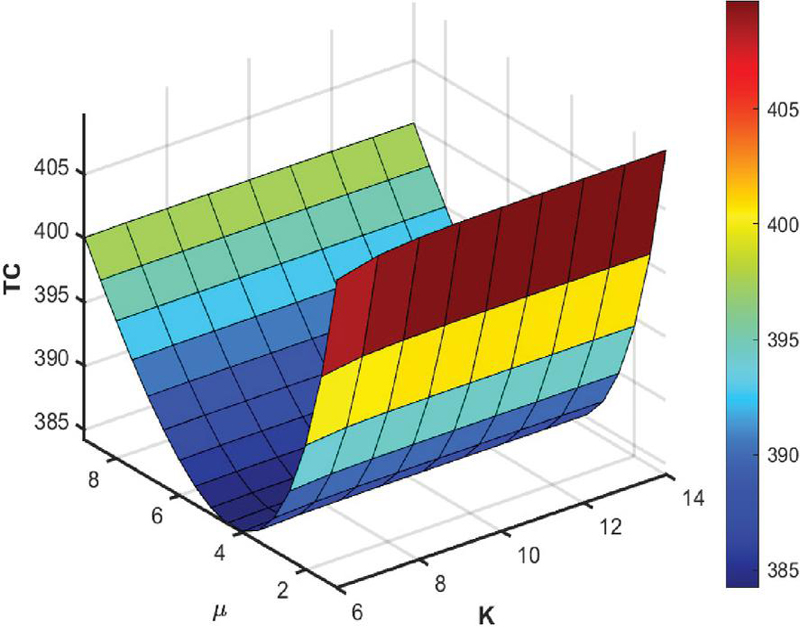
Figure 1 The expected cost function for different values of and .
8 Real-life Application of This Model
In the context of computer science, particularly within data centre management, the described model helps optimise server operations amidst failures and repairs. In a data centre, servers process incoming data requests that arrive following a Poisson process with a rate of requests per hour. Each server handles these requests one at a time, with the time taken to process each request being exponentially distributed, with a mean of hours. Servers can experience failures, but such failures only occur when there is at least one request in the system. The time between failures follows an exponential distribution with a rate of . After a failure, a server cannot resume processing until the number of pending requests reaches a predefined threshold, . Once this threshold is reached, the server undergoes repair, with repair times also following an exponential distribution with a mean of hours. The data centre is constrained by a maximum capacity for pending requests. If the number of pending requests exceeds this capacity, additional requests may be delayed or redirected. All processes, including request arrivals, processing times, server failures, and repair times, are assumed to be independent. This model aids data centre operators in making informed decisions about capacity planning, understanding the impact of server failures on service levels, and effectively managing resources to ensure continuous service availability and compliance with service level agreements (SLAs).
9 Conclusion
In this study, we analyzed the queue model by considering server breakdowns, a threshold-based recovery policy, a catastrophic factor, and customer reneging, using Markov process theory. We derived the steady-state equations and applied a SoR method to obtain the steady-state probability distribution of the number of customers in the system. Several key system characteristics were developed and utilized to construct the expected cost function per unit time. Our approach not only introduced the Newton Quasi-method to determine the optimal service rate (). An application example was provided to demonstrate the practical relevance of these findings. Overall, the results of this study offer valuable insights for decision-makers, helping them better understand the dynamics of server breakdowns and the efficacy of threshold-based recovery policies in managing such queuing systems.
References
[1] Priya Baloda, Amit Kumar, and Vikas Garg. Reliability estimation of parallel systems with diverse failure modes: Semi-markov model approach. Journal of Reliability and Statistical Studies, 17(2):351–366, 2024.
[2] Amina Angelika Bouchentouf, Latifa Medjahri, Mohamed Boualem, and Amit Kumar. Mathematical analysis of a markovian multi-server feedback queue with a variant of multiple vacations, balking and reneging. Discrete and Continuous models and Applied Computational Science, 30(1):21–38, 2022.
[3] H. Chen and L. Wang. Balking and reneging in critical care environments: A comprehensive study. Journal of Healthcare Engineering, 33(5):245–259, 2023.
[4] Mouloud Cherfaoui, Amina Angelika Bouchentouf, and Mohamed Boualem. Modelling and simulation of bernoulli feedback queue with general customers’ impatience under variant vacation policy. International Journal of Operational Research, 46(4):451–480, 2023.
[5] J. Kim and H. Lee. Recent advances in optimization techniques for queueing systems. Applied Mathematics and Computation, 388:125623, 2021.
[6] A. Kumar, M. Baualem, and A. Bouchentouf. Cost optimisation analysis for a markovian feedback queueing system with discouragement, breakdown, and threshold-based recovery policy. Optimization Techniques for Decision-making and Information Security, 3:1–17, 2024.
[7] A. Kumar and N. Singh. Optimizing server recovery policies using iot data. IEEE Transactions on Automation Science and Engineering, 19(1):34–45, 2022.
[8] Amit Kumar. Single server multiple vacation queue with discouragement solve by confluent hypergeometric function. Journal of Ambient Intelligence and Humanized Computing, 14(5):6411–6422, 2023.
[9] Amit Kumar, Mohamed Boualem, Amina Angelika Bouchentouf, and Savita. Optimal analysis of machine interference problem with standby, random switching failure, vacation interruption and synchronized reneging. In Applications of advanced optimization techniques in industrial engineering, pages 155–168. CRC Press, 2022.
[10] Amit Kumar, Suman Kaswan, Mahendra Devanda, and Chandra Shekhar. Transient analysis of queueing-based congestion with differentiated vacations and customer’s impatience attributes. Arabian Journal for Science and Engineering, 48(11):15655–15665, 2023.
[11] Amit Kumar, Ankit Kumar, and Chandra Shekhar. Transformation-based stationary analysis of single server feedback fluid queue: An enhanced approach. In 2023 3rd International Conference on Advancement in Electronics & Communication Engineering (AECE), pages 580–583. IEEE, 2023.
[12] Amit Kumar, Savita, and Chandra Shekhar. Optimizing resource allocation in M/M/1/N queues with feedback, discouraged arrivals, and reneging for enhanced service delivery. Journal of Reliability and Statistical Studies, 17(1):1–16, 2024.
[13] J. Lee and H. Park. Impact of recovery policies on multi-server systems: A simulation study. Simulation Modelling Practice and Theory, 105:105012, 2023.
[14] H. Li and Y. Zhang. Impact of dynamic pricing on balking and reneging in online systems. Operations Research Letters, 49(3):345–353, 2021.
[15] T. Nguyen and R. Wang. Cost implications of renewable energy in manufacturing systems. Renewable Energy, 198:542–558, 2023.
[16] S. Patel and R. Kumar. Iot and queueing theory: Enhancing smart manufacturing performance. Journal of Manufacturing Science and Engineering, 145(3):091013, 2023.
[17] A. Rao and V. Singh. Customer balking and reneging in healthcare systems: A new model. Health Care Management Science, 25(2):135–150, 2022.
[18] C Shekhar, A Gupta, N Kumar, A Kumar, and S Varshney. Transient solution of multiple vacation queue with discouragement and feedback. Scientia Iranica, 29(5):2567–2577, 2022.
[19] Chandra Shekhar, Amit Kumar, and Shreekant Varshney. Modified bessel series solution of the single server queueing model with feedback. International Journal of Computing Science and Mathematics, 10(3):313–326, 2019.
[20] Chandra Shekhar, Amit Kumar, and Shreekant Varshney. Load sharing redundant repairable systems with switching and reboot delay. Reliability Engineering & System Safety, 193:106656, 2020.
[21] Chandra Shekhar, Amit Kumar, and Shreekant Varshney. Parametric nonlinear programming for fuzzified queuing systems with catastrophe. International Journal of Process Management and Benchmarking, 10(1):69–98, 2020.
[22] Chandra Shekhar, Amit Kumar, Shreekant Varshney, and Sherif I Ammar. Fault-tolerant redundant repairable system with different failures and delays. Engineering Computations, 37(3):1043–1071, 2019.
[23] Chandra Shekhar, Amit Kumar, Shreekant Varshney, and Sherif Ibrahim Ammar. fault-tolerant machining system with imperfection. Journal of Industrial and Management Optimization, 17(1):1–28, 2020.
[24] Chandra Shekhar, Neeraj Kumar, Amit Gupta, Amit Kumar, and Shreekant Varshney. Warm-spare provisioning computing network with switching failure, common cause failure, vacation interruption, and synchronized reneging. Reliability Engineering & System Safety, 199:106910, 2020.
[25] Chandra Shekhar, AA Raina, A Kumar, and J Iqbal. A survey on queues in machining system: progress from 2010 to 2017. Yugoslav Journal of Operations Research, 27(4):391–413, 2017.
[26] Chandra Shekhar, Shreekant Varshney, and Amit Kumar. Optimal control of a service system with emergency vacation using bat algorithm. Journal of computational and applied mathematics, 364:112332, 2020.
[27] Chandra Shekhar, Shreekant Varshney, and Amit Kumar. Reliability and vacation: The critical issue. Advances in Reliability Analysis and its Applications, pages 251–292, 2020.
[28] Chandra Shekhar, Shreekant Varshney, and Amit Kumar. Matrix-geometric solution of multi-server queueing systems with bernoulli scheduled modified vacation and retention of reneged customers: A meta-heuristic approach. Quality Technology & Quantitative Management, 18(1):39–66, 2021.
[29] Chandra Shekhar, Shreekant Varshney, and Amit Kumar. Standbys provisioning in machine repair problem with unreliable service and vacation interruption. In The Handbook of Reliability, Maintenance, and System Safety through Mathematical Modeling, pages 101–133. Elsevier, 2021.
[30] V. Singh and A. Patel. Queueing theory applications in iot-enabled systems. IEEE Transactions on Industrial Informatics, 17(8):1345–1356, 2021.
[31] Bhupender Kumar Som and Sunny Seth. A finite buffer reverse balking feedback markovian queuing system with reneging and retention of impatient customers. Pakistan Journal of Statistics, 39(1), 2023.
[32] J. Wang and S. Liu. Predictive maintenance in manufacturing systems: A queueing theory approach. Journal of Manufacturing Processes, 55:95–112, 2024.
[33] L. Wang and H. Li. Ai-driven optimization techniques for cost minimization in queueing systems. Journal of Artificial Intelligence Research, 74:95–112, 2022.
[34] J. Xu and Y. Zhang. Digital twins and queueing theory: Enhancing real-time system optimization. Journal of Cyber-Physical Systems, 15(2):78–91, 2024.
[35] P. Yadav and S. Sharma. Blockchain for decentralized queue management systems. Journal of Blockchain Research, 12(3):189–204, 2022.
[36] Y. Zhang, X. Li, and Z. Chen. Enhancing queueing systems with ai: A review of machine learning applications. Journal of Industrial Engineering, 45(3):789–812, 2022.
Biographies
Savita is a research scholar in the Department of Mathematics at Chandigarh University. She earned her M.Sc. degree from GJU Hisar in 2006. Her primary research interests lie in the field of queueing theory and stochastic processes. She has actively participated in several national and international conferences.
Neeraj Kumar, Assistant professor. Department (CSE-AIML), he has 18 years of Experience in Academics and in Administration. He published more than 25 research papers in journals and conferences and having 2 patents. His field of interest is Computer Networks, Artificial Intelligence and Machine Learning.
Journal of Reliability and Statistical Studies, Vol. 17, Issue 2 (2024), 435–452.
doi: 10.13052/jrss0974-8024.1729
© 2025 River Publishers