A Markov-based Optimal Maintenance Policy for Production Process
Mohammad Hossein Kargar Shouroki and Mohammad Saber Fallahnezhad*
Department of Industrial Engineering, Yazd University, Yazd, Iran
E-mail: kargar.mohammad@stu.yazd.ac.ir; fallahnezhad@yazd.ac.ir
*Corresponding Author
Received 15 September 2024; Accepted 15 April 2025
Abstract
This article considers a machine maintenance problem. When the machine fails after a stochastic period, reducing its capacity to a proportion of the nominal level. In this degraded capacity state, three maintenance and repair policy include, continue at 50% capacity, imperfect maintenance and increase the capacity of the machine to 80% or perfect replacement and increase the capacity of the machine to the initial stateare available for evaluation. By modeling the system as a discrete-time Markov chain and analyzing the probability transition matrix between the system states, the costs associated in each state can be evaluated. The objective function representing the average cost per unit time of production is calculated to determine the optimal maintenance policy.
Keywords: Discrete-time Markov chain, perfect replacement, optimum policy, maintenance.
1 Introduction
One of the fundamental problems in manufacturing industries is the sudden failure of machinery during production, which disrupts the production system and increases the costs imposed on the system, such as production line downtime costs, machinery repair or replacement costs, product delivery delay costs to customers, and even lost sales costs [1]. In this regard, one of the most practical methods used in most advanced industrialized countries is planning a set of systematic instructions, methods, and processes to prevent premature and sudden failure of machinery and improve the lifespan of equipment [2]. In today’s industries, given the automation of equipment, to ensure the reliability of equipment and reduce downtime costs, the implementation of an optimal maintenance and repair policy is essential, so that inadequate and incorrect maintenance and repair will be very costly, not only because of failure to meet equipment repair needs, but also because of missed opportunities [3]. Given the significant impact of random factors, such as sudden machinery failure, determining optimal maintenance and repair policies is very important [4]. One solution method for determining the optimal maintenance and repair policy is to use a discrete-time Markov chain. In this method, the system transitions from one state to another, and these transitions depend only on the current state of the system, not on its past history. To use the Markov chain in prediction, first, a set of possible states that the system can be in is defined, and using the transition probability matrix between states, the probability of machine failure at any time is calculated, and using it, the optimal maintenance and repair policy of the machine is determined, which is described in Section 5.
2 Literature Review
Many studies have been conducted to optimize maintenance and repair systems. By reviewing articles published in recent years, it can be concluded that various solution methods have been used to solve optimization problems.
Elhuseyni et al. [5] proposed a model that uses mixed-integer programming to minimize the total time delay of performing PM and CM activities and determine the optimal time for maintaining and repairing public transport vehicles. Fecarotti et al. [6] proposed a model to determine the optimal maintenance and repair strategy for a rail network that considers new constraints such as the available budget, rail availability, criteria related to network topology, and service frequency. Qiu et al. [7] proposed a model for determining optimal maintenance and repair policies for shipbuilding systems. Using mathematical modeling, this model considers potential orders, production fluctuations, and interdependencies between machinery, which directly affect failure and, consequently, maintenance and repair costs. Zhang et al. [8] proposed a mixed-integer linear programming model to optimize the maintenance and repair planning of industrial generators used in hydroelectric power plants. Li et al. [9] proposed a model for optimizing the maintenance and repair of natural gas transmission pipelines by considering external corrosion factors. In the proposed model, external corrosion factors are first analyzed using the fault tree model, and then Bayesian networks are constructed based on this model. Fallahnezhad et al. [10] presented a statistical reliability model-based preventive maintenance method using Bayesian inference. In this study, the goal of Bayesian inference is to obtain the inspection point. Allal et al. [11] presented a simulation optimization approach for optimizing wind turbine maintenance and repair planning to minimize costs and maximize equipment availability. Zhong et al. [12] proposed a fuzzy nonlinear multi-objective model for optimizing preventive maintenance and repair scheduling of wind turbines. Gan et al. [13] proposed a model for optimizing a paper production system consisting of 2 serial machines. Considering the intermediate warehouse and spare parts inventory, which affect system costs, the authors determined the optimal maintenance and repair policy using a genetic algorithm to minimize total system costs [13]. Diallo et al. [14] proposed a model for determining the optimal maintenance and repair policies for multicomponent systems. A mathematical model with two objective functions was developed to optimize the tradeoff between the total maintenance cost and the system reliability based on the decision-makers’ preferences [14]. Martinod et al. [15] proposed a stochastic optimization model to reduce the total long-term maintenance cost of complex systems. The proposed model is based on optimizing a cost model for complex multicomponent systems consisting of preventive and corrective maintenance using reliability analysis and a clustering method for maintenance actions to decrease the total maintenance cost of the complex system [15]. Ghorbani et al. [16] proposed a model to determine the optimal maintenance and repair program for an operating multicomponent system with scheduled downtime and rest periods. The objectives of the proposed model are to minimize totalcost and maximize equipment reliability using a stochastic programming approach. Kuo et al. [17] applied a Markov process of partial observation. They presented a dynamic programming model for the combined problem of machine maintenance and repair and product quality control over a finite horizon. These authors designed a system to implement the joint principles of machine maintenance and repair and product quality control to minimize the expected costs of the system. Fallahnezhad et al. [18] presented a Markov model for a single two-state machine replacement problem, aiming to determine a threshold for optimal decision-making based on whether to replace the machine, repair the machine, or continue production. Andersen et al. [19] presented an integrated model for the time- and condition-based maintenance of a multicomponent system to optimize the part replacement time. All system components exhibit aging and deterioration properties and follow a multivariate gamma distribution. In this study, the CBM and TBM models are described as Markov decision processes, and dynamic programing is used to solve the final model and determine the optimal policy. Jin et al. [20] proposed a model for determining the optimal preventive maintenance period for a multistate deteriorating machine. Because the transition rate between machine states is unknown, reversible linear integral equations are used to calculate the transition matrix of the states. Finally, using the semi-Markov decision model and proposed algorithm, the optimal preventive maintenance period can be obtained. Pricopie et al. [21] determined the optimal preventive maintenance time of an actuator, which is one of the main parts of industrial valves, to maximize the profit using a continuous Markov model. The equipment considered in this study has deteriorating properties and is in three states: fully operational, semi-operational, and failed. The transition between states occurs at certain rates. Using a continuous Markov model, Tomasevicz et al. [22] determined the optimal preventive maintenance time for equipment with deteriorating properties, namely, three operational states, two failure states, and three maintenance states, to maximize machine availability. After entering one of the three operational states, the equipment can transition to one of the three maintenance states or the next operational state at a certain rate. The considered failure states include fatigue and sudden failure. After entering these states, corrective actions return the machine to its initial state. Amari et al. [23] considered equipment with deteriorating properties in six states. Unlike the study by Tomasevicz et al. [22], where two actions are possible in each state, in this study, there is the possibility of 3 actions in each state at certain rates: performing PM, performing CM, or continuing operation. Finally, using the continuous Markov process, the optimal action in each state is determined so that equipment reliability is maximized. Corman et al. [24] developed a data-driven model with a sequential optimization framework to find the optimal PM schedule for a light rail braking system by analytically determining the relationship between reliability, availability, and maintenance cost; they modeled the failure function using the Weibull distribution and concluded that extending the maintenance intervals needs to be performed with caution because maintenance costs are discontinuous and exhibit sudden fluctuations. Kamel et al. [25] optimized the PM frequency for multiple machines using a genetic algorithm to represent the repair, replacement, and inspection decision variables to determine reliability, availability, and maintenance cost. The proposed algorithm enhances an existing maintenance plan for a Practical application by reducing the total maintenance cost. Lin et al. [26] constructed a cost function using the estimated failure time distribution. They took the minimum long-term expected cost rate as the optimization objective to calculate the preventive maintenance period. Shi et al. [27] developed an optimal maintenance strategy for complex periodic inspection systems by using an imperfect maintenance model and taking the lowest cost of inspection and maintenance as the optimization objective. Sarkar et al. [28] developed a maintenance cost model for offshore wind turbine components following a multilevel opportunistic PM strategy that considered preventive replacement and maintenance. Tajiani et al. [29] developed an optimal maintenance policy simulation method for a single-component system by considering two types of failure: failure due to equipment wear and random events such as weather conditions and overload. Li et al. [30] presented an optimization model for scheduled and condition-based maintenance and repairs to minimize costs, and they designed an optimization algorithm based on Monte Carlo simulations to solve the model. Finally, an opportunistic maintenance strategy for CNC gear-grinding machines was developed. Ziolkowski et al. [31] proposed a mathematical model for operating aviation fuel-supplying vehicles before flight. The phase space of the process was mapped by a 7-state directed graph of the operation process, and Markov chains and processes were used to calculate the technical readiness index. Oszczypala et al. [32] applied a stochastic method to various technical objects. The 3-state semi-Markov model was implemented for reliability analyses, and The Laplace transform was used to determine the reliability function, the failure probability density function, the failure intensity, and the expected time to failure. KnopiK et al. [33] developed the semi-Markov model for age-replacements of technical objects. The model considered in this paper includes two types of repairs: perfect and minimal repairs. The asymptotic availability coefficient and profit per time unit are considered criteria for the quality of system operation. Kumar et al. [34] developed a quantitative mathematical model to assess the performance of a smart trash bin. This model takes into account six hardware components of the trash bin, including Arduino Uno, Ultrasonic sensor, servo motor, switch, battery, jumper wires utilizing Markov modelling and reliability-based approach. The objective of this model is to facilitate timely planning of repair and maintenance activities, ensuring prolonged availability of the smart trash bin after identifying the weakest component/components ofthe system. Kumar et al. [35] developed a model to analyze the performance of a Garbage data collecting sensor network system through mathematical modelling and a reliability approach. Markov modelling has been used to model the system. Based on the mathematical model, a state transition diagram and a set of Kolmogorov time-dependent differential equations have been obtained. The various state probabilities related to the performance of the system, namely, Reliability, Mean time to failure, have been obtained to understand the different maintenance policies that can be used. Kumar et al. [36] developed a mathematical model based on different hardware and software failures/repairs of automatic ticket vending machine has been to analyze its performance.
A summary of studies in optimizing maintenance decision is denoted in Table 1.
Table 1 Summary of literature review on optimizing maintenance policies
| Solution Technique | Objective Function | Decision Variable | |||||||||||||||||||
| Reference | Operation Research | Stochastic Models | Markov Models (Continuous System States) | Markov Models (Discrete System States) | Analytical Models | Simulation Models | Bayesian Networks | Fuzzy Models | Multiple-objective | Minimizing the Delay in Performing Maintenance | Minimizing Maintenance Cost | Minimize Total Cost and Maximize Availability | Minimize Total Cost and Maximize Reliability | Maximize Profit | Maximize Availability | Maximize Reliability | Optimal Maintenance Time | Optimal Maintenance Strategy | Optimal PM and Repair Strategy | Optimal Part Replacement Time | Optimal PM Period |
| Elhuseyni et al. (2021) | |||||||||||||||||||||
| Fecarotti et al. (2021) | |||||||||||||||||||||
| Qiu et al. (2021) | |||||||||||||||||||||
| Zhang et al. (2023) | |||||||||||||||||||||
| Li et al. (2022) | |||||||||||||||||||||
| Fallahnezhad et al. (2014) | |||||||||||||||||||||
| Allal et al. (2021) | |||||||||||||||||||||
| Zhong et al. (2019) | |||||||||||||||||||||
| Gan et al. (2015) | |||||||||||||||||||||
| Diallo et al. (2019) | |||||||||||||||||||||
| Martinod et al. (2018) | |||||||||||||||||||||
| Ghorbani et al. (2022) | |||||||||||||||||||||
| Kuo et al. (2006) | |||||||||||||||||||||
| Fallahnezhad et al. (2011) | |||||||||||||||||||||
| Andersen et al. (2022) | |||||||||||||||||||||
| Jin et al. (2020) | |||||||||||||||||||||
| Pricopie et al. (2020) | |||||||||||||||||||||
| Tomasevicz et al. (2009) | |||||||||||||||||||||
| Amari et al. (2006) | |||||||||||||||||||||
| Croman et al. (2017) | |||||||||||||||||||||
| Kamal et al. (2020) | |||||||||||||||||||||
| Lin et al. (2001) | |||||||||||||||||||||
| Shi et al. (2019) | |||||||||||||||||||||
| Sarkar et al. (2016) | |||||||||||||||||||||
| Tajiani et al. (2024) | |||||||||||||||||||||
| Li et al. (2023) |
By reviewing articles that utilized Markov chain models for optimization, it was observed that in most models, the system states were assumed to be continuous, and continuous Markov process equations were employed for problem-solving and optimization. Furthermore, none of the presented models accounted for absorbing states within a discrete Markov chain. In contrast, in real-world scenarios, system states are discrete, and there exists an absorbing state. Thus, in this study, a machine with five states was considered, two of which are absorbing states. Using discrete Markov chain relationships, the optimal maintenance policy was determined to minimize the objective function, which is the average cost of the production process. Moreover, various maintenance policies were modeled using an absorbing Markov chain, and the average cost of each policy was calculated to compare the performance of different policies. In other words, by utilizing absorbing Markov chain equations and the transition probability matrix, the parameters of the objective function such as the expected number of times in pre-absorbing states and the transition probabilities between transient states were predicted. The transition probability matrix for transient states, system lifetime, transient probabilities, and failure times were determined. Subsequently, the objective function of the problem, aimed at minimizing the average cost of the production process, was calculated, and the optimal policy was selected. It should be noted that three contributions were made to develop the model. First, the machine’s performance process was modeled as an absorbing Markov chain, which had not been previously addressed in this modeling framework. The second contribution involved converting the absorbing Markov chain into a unified Markov chain by assuming the removal of absorbing states to determine the limiting probabilities of each transient state. The third contribution was the development of a cost objective function, which consists of two parts. The first part calculates the machine failure cost per unit time by dividing it by the downtime obtained from Markov chain absorption equations. The second part calculates the machine operation cost by multiplying the limiting probability of each state by the cost of that state.
When there are no absorbing states, transitions between all states are possible with specific probabilities. Absorbing states should be considered in Markov chain models for maintenance problems, as they represent failure states where the machine’s lifetime ends. The proposed method is based on absorbing Markov chain equations and accounts for failure states in the system when the machine enters one of these states.
3 Problem Statement
The primary objective of this article is to optimize and determine the best maintenance policy for industrial equipment. Some critical equipment in the industry are prone to wear and tear. When certain minor components fail, only the performance and capacity of the equipment are reduced. With this reduced capacity, the equipment can continue to operate. In this study, Markov chain models were used to establish optimal maintenance policies for equipment. To make the model more realistic, absorbing states were added. The problem considered in this study involves a working machine with deteriorating properties that can experience two types of failures: wear-related failure and sudden failure.
Sudden failure is related to conditions such as sudden changes in power frequency, sudden changes in machine settings, human error and etc.
The machine is in a good state with 100% capacity; it deteriorates over time and enters a medium state with 80% capacity, or the operating capacity of the machine can be reduced to 50% of the nominal capacity, which is called a bad state. In this case, it is possible to increase the capacity of the machine to 80% (medium state) by imperfect maintenance or to increase the capacity of the machine to the initial state (100% capacity that is called good state) by perfect replacement.
At any time, by inspecting and observing the machine’s performance, the machine is one of the five states in Table 2.
Table 2 States that considers for the machine
| State Type | Description |
| State1 | Operating at 100% capacity (Good state) |
| State2 | Operating at 80% capacity (Medium state) |
| State3 | Operating at 50% capacity (Bad state) |
| State4 | Sudden failure |
| State5 | Erosive failure and machine stoppage |
The machine state is obtained by inspection at the end of each stage.
The machine starts operating in State 1. If the machine enters State 3, the following three policies are possible:
Policy 1: The machine is continuedat 50% capacity.
Policy 2: Apply imperfect replacementandthe machine enters State 2.
Policy 3: Apply perfect replacement andthe machine enters State 1.
The main objective of this study is to determine the optimal policy when the machine enters State 3.
If Policy 1 is selected, the machine continues to operate until one of two failures (sudden or erosive), is occurs.
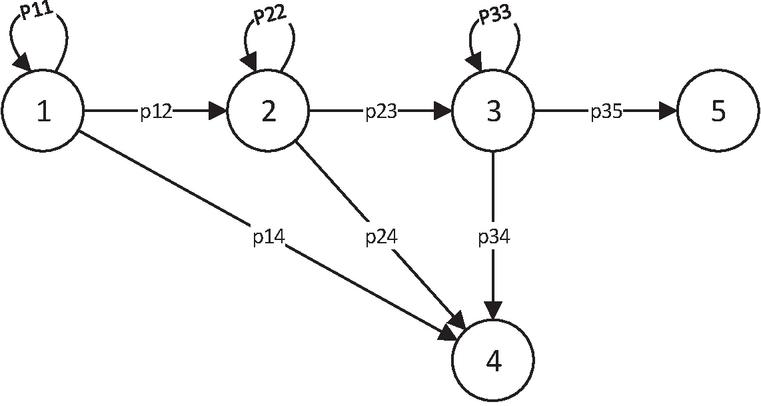
Figure 1 State diagram of policy 1.
When the machine enters State 4 or State 5, there is no possibility of returning to other states. These are the absorbing states of the system in which the current machine is replaced with a new one.
If Policy 2 is selected, the machine enters State 2 and starts operating at 80% capacity.
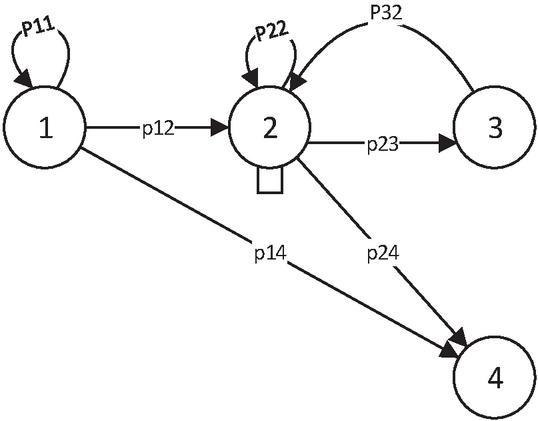
Figure 2 State diagram of policy 2.
If Policy 3 is selected, the machine enters State 1 and starts operating at 100% capacity.
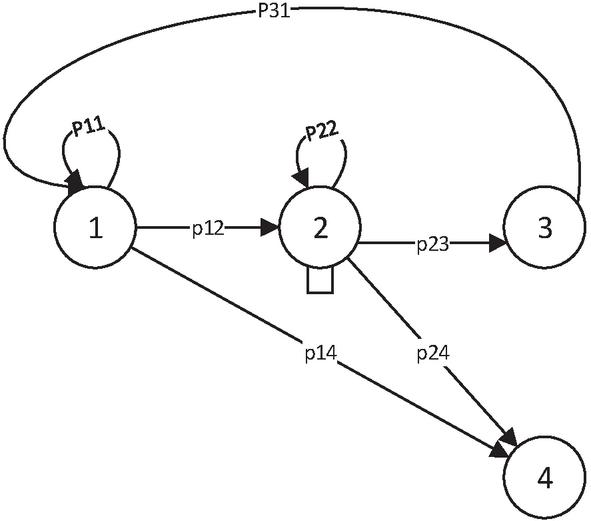
Figure 3 State diagram of policy 3.
The machine considered in this problem, consisting of several interconnected components, is designed so that the failure of one or more parts does not lead to a complete shutdown. In many cases, the machine’s performance can be fully restored to its original state simply by replacing the defective components. This approach ensures precise identification and repair or replacement of the faulty part, enabling the entire system to regain its full operational functionality. By doing so, the machine resumes working at its original efficiency, comparable to a brand-new system, without the need for a complete overhaul or replacement of all its equipment. Such a maintenance strategy not only significantly reduces operational costs but also minimizes environmental impact by avoiding unnecessary waste of resources and reducing industrial waste generation. Furthermore, this method allows industries to drastically reduce production downtime. Instead of waiting for extensive overhauls or resorting to full equipment replacement, the defective part is quickly replaced. This ensures minimal disruption to industrial processes, thereby directly enhancing the overall productivity of the system. In addition, optimal maintenance and management extend the lifespan of the equipment and ensure consistent performance throughout its operational lifecycle. From an economic perspective, this approach is highly cost-effective, reducing unnecessary expenditures over time while contributing to increased profitability and operational efficiency.
The average production and maintenance costs of each policy are determined, and the policy with the minimum average cost is selected.
4 Problem Parameters
The notations used in this paper are as follows:
F(C) the objective function.
T Time to failure.
C operating cost in state i.
P Transition probability of the system from state i to state j.
Limiting probability of state i.
F Probability of absorption from transient state i to absorbing state j.
C cost of imperfect replacement.
h Downtime due to imperfect replacement.
C cost of perfect replacement.
h Downtime due to perfect replacement.
C the cost per hour of lost production.
Q Probability of transitions between transient states of the system.
R Elements related to the rows of transient states and columns of absorbing states.
S Probability of transition between the transient states of the system if the absorbing states are removed.
N the fundamental matrix for P, which denotes the expected number of states before absorption.
5 Problem Formulation
If Policy 1 is selected, matrix P and Q are as follows:
| (1) | ||
| (2) |
Matrix N, T, R, F, S and are as follows [37]:
| (3) | ||
| (4) | ||
| (5) | ||
| (6) | ||
| (7) |
Limiting Probability of each state are obtained using equilibrium equations as follows,
| (8) | |
| (9) |
The objective function of the problem isas follows:
| (10) |
If Policy 2 is selected, matrix P, Q, N, T, R, F, S and are as follows:
| (11) | ||
| (12) | ||
| (13) | ||
| (14) | ||
| (15) | ||
| (16) | ||
| (17) | ||
| (18) | ||
| (19) |
The objective function of the problem isas follows:
| (20) |
If Policy 3 is selected, matrix P, Q, N, T, R, F, S and are as follows:
| (21) | ||
| (22) | ||
| (23) | ||
| (24) | ||
| (25) | ||
| (26) | ||
| (27) | ||
| (28) | ||
| (29) |
The objective function of the problem is as follows:
| (30) |
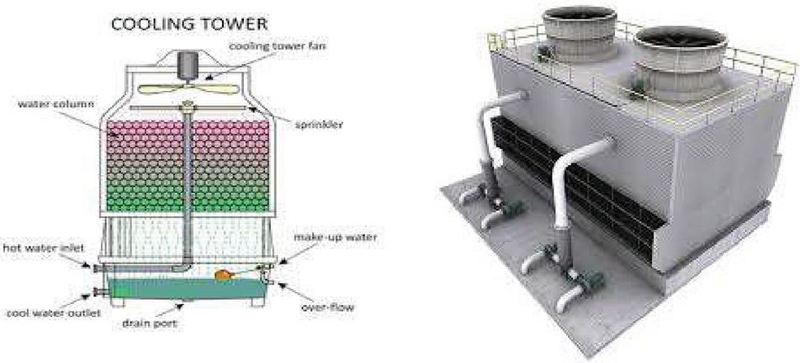
Figure 4 Cooling tower components.
6 Case Study
In industries, there are certain types of equipment that, when some of their minor components fail, experience a reduction in performance and capacity. However, such failures do not result in the complete shutdown of the equipment, allowing it to continue operating at reduced capacity. For example, a cooling tower, a critical component in the steel industry contains two fans, as illustrated in Figure 4. If one fan fails, the equipment’s capacity and performance decrease to 50% of its nominal level. In this scenario, imperfect replacement can restore the equipment’s performance to 80% of its nominal capacity, while perfect replacement the equipment restores it to 100%. The goal of this study is to minimize the average production costs by evaluating a range of maintenance policies and determining the optimal policy based on the lowest cost.
The parameters of this machine are expressed as follows:
By applying an imperfect maintenance action with the cost of and considering hours of production stoppage, the performance of the machine improves, and the machine enters the medium state; thus, the P is as follows:
By applying a perfect replacement with the cost of and considering hours of production stoppage, P the performance of the machine improves, and the machine enters the good state, thus, the P is as follows:
Table 3 Values of the objective functions for different policies
| PolicyParameters | Q | N | T | F | S | F(C) | |||
| 1 | |||||||||
| 2 | 0.47 | 0.47 | 0.06 | 2161.1 | |||||
| 3 | 0.64 | 0.32 | 0.06 | 2325.4 |
Table 4 Values of the objective functions for different policies
| PolicyParameters | Q | N | T | F | S | F(C) | |||
| 1 | |||||||||
| 2 | 0.47 | 0.47 | 0.06 | 2449.1 | |||||
| 3 | 0.64 | 0.32 | 0.06 | 2613.4 |
According to the results, it is clear that by selecting Policy 1, the average production process cost is equal to 1621.7, which is less than that of the other two policies; thus, the optimal maintenance and repair policy is to continue the machine’s operation at a bad state.
If the expected operating cost in state 3 increases to 7000, the cost functions are calculated as follows:
According to the results, it is clear that by selecting Policy 2, the average production process cost is 2449.1, which is less than that of the other two policies; thus, the optimal maintenance and repair policy is imperfect maintenance.
7 Result Discussion
By using the results obtained from this paper and analyzing the expected costs in each state, the objective function in each state is calculated and the optimal maintenance and repair policy can be selected. In this section, the results obtained from the case study are discussed and a sensitivity analysis and determination of the optimal policy based on different values of cost parameter c3 is carried out. The average cost plot for different policies is denoted in Figure 5. In this figure, the blue line represents the average cost of continuing the production process, orange represents the average cost of applying an imperfect maintenance policy, and gray represents the average cost of applying a perfect replacement policy. According to the figure, when C is less than 6053, it is better to continue the production process. When C3 is more than 6053, it is better to apply an imperfect maintenance action on the production process and for all values of C, the third policy is not optimal.
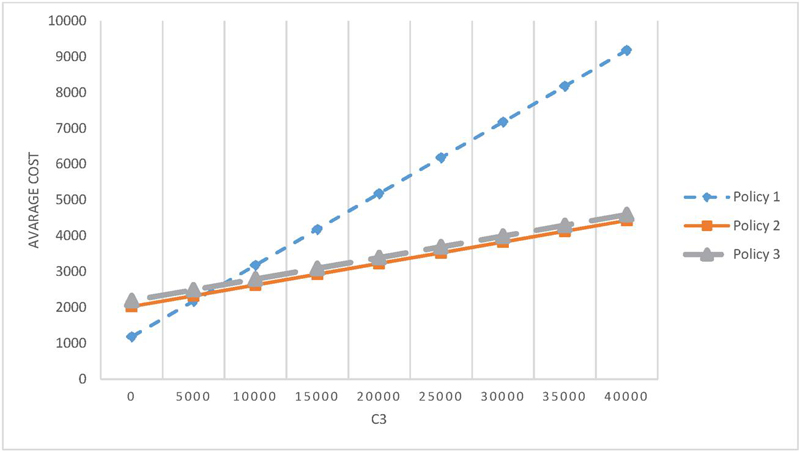
Figure 5 Average cost of policies with different values of cost parameter .
According to the numerical analysis, it is concluded that every maintenance and repair policy can be modeled using an absorbing Markov chain. The transition probabilities can be calculated using expert opinions or past information. Using the calculated probabilities, the cost of each policy can be determined to select the optimal decision.
8 Conclusion
Since the maintenance and repair costs account for a significant portion of production costs, implementing an optimal maintenance and repair policy is essential for ensuring equipment reliability and reducing downtime costs. None of the previous researches in the field of maintenance optimization have used discrete absorbing Markov chain, while in this study aimed to use discrete Markov chain relationships, a system-state transition probability matrix, and all system costs to calculate the objective function, which minimizes the cost of average production processes and accordingly determines the optimal maintenance and repair policy. With different values of , the objective function of the problem was determined and the optimal maintenance and repair policy was determined, when C is less than 6053, it is better to continue the production process. When C3 is more than 6053, it is better to apply an imperfect maintenance action on the production processand for all values of C, the third policy is not optimal. In future research, assumptions such as considering several machines instead of a single machine and the effect of failure of a single machine on the performance of other machines can be added to the problem. In addition to cost minimization, machine reliability maximization can be considered in the problem. The optimal maintenance and repair policy can then be determined for the multi-objective optimization problem.
Funding Declaration
There was no Funding for this research.
References
[1] Azadeh A, Sheikhalishahi M, Khalili M, Firouzi M. An integrated fuzzy simulation fuzzy data envelopment analysis approach for optimum Maintenance planning. International Journal of Computer Integrated Manufacturing 2013; 27(2): 181–199, https://doi.org/10.1080/0951192X.2013.812804.
[2] Gopalakrishnan M, Bokrantz J, Skoog A. Planning of maintenance activities: A current state mapping in industry. Procedia CIRP 2015; 30: 480–485. https://doi.org/10.1016/j.procir.2015.02.093.
[3] Wan S, Gao J, Li J, Tong Y. Web-based Process Planning for Machine Tool Maintenance and Services. Procedia CIRP 2015; 38:165–170. https://doi.org/10.1016/j.procir.2015.07.018.
[4] Angius A, Colledani M, Silipo M, Yamane A. Impact of Preventive Maintenance on the service level of multi-stage manufacturing systems with degrading machines. Journal of the International Federation of Manufacturers and Engineers 2016; 49: 568–573. https://doi.org/10.1016/j.ifacol.2016.07.696.
[5] Elseyi M, Unal A. An integrated heuristic and mathematical modeling method to optimize vehicle maintenance schedule under single dead-end track parking and service level agreement. Computers and Operations Research 2021; 132: 1–16. https://doi.org/10.1016/j.cor.2021.105261.
[6] Ferretti C, Andrews A, Pesenti R. A mathematical programming model to select maintenance strategies in railway networks. Reliability Engineering and System Safety 2016; 1–13. https://doi.org/10.1016/j.ress.2021.107940.
[7] Qiu S, Ming X, Sallak M, Lu J. Joint optimization of production and condition based maintenance scheduling for make-to-order manufacturing systems. Computers and Industrial Engineering 2021; 162: 1–17. https://doi.org/10.1016/j.cie.2021.107753.
[8] Zhang Z, Liu M, Xie M, Dong P. a mathematical programing–based heuristic for coordinated hydrothermal generator maintenance scheduling and long-term unit commitment. Electrical Power and Energy Systems 2022; 147: 1–13. https://doi.org/10.1016/j.ijepes.2022.108833.
[9] Li Y, He X, Huai J. Risk analysis and maintenance decision making of natural gas pipelines with external corrosion based on Bayesian network. Petroleum Science 2021; 19: 1250–1261. https://doi.org/10.1016/j.petsci.2021.09.016.
[10] Fallahnezhad M S, Mostafaeipour A, Sajadieh M. Implementation of traditional (SR)-based PM method with Bayesian inference. International Journal of Industrial Engineeringand Production Research, 2014; 25: 27–32. http://ijiepr.iust.ac.ir/article-1-296-fa.html.
[11] Allal A, Sahnoun M, Adjoudj R, Benslimane S, Mazar M. Multiagent based simulation-optimization of maintenance routing in offshore wind farms. Computers and Industrial Engineering 2021; 157: 1–13. https://doi.org/10.1016/j.cie.2021.107342.
[12] Hong S, Partellus A, Go M, Zhou J. a reliability-and-cost-based fuzzy approach to optimize preventive maintenance scheduling for offshore wind farms. Mechanical Systems and Signal Processing 2019; 124: 643–663. https://doi.org/10.1016/j.ymssp.2019.02.012.
[13] Gan S, Zhang Z, Zhou Y, Shi J. Joint optimization of maintenance, buffer, and spare parts Parts for a production system. Mathematical Modeling 2015;39: 6032–6042. https://doi.org/10.1016/j.apm.2015.01.035.
[14] Diallo C, Khatab A, Venkata U. Developing an objective imperfect selective maintenance optimization model for multicomponent systems. IFAC Papers Online 2019; 52(13): 1079–1084. https://doi.org/10.1016/j.ifacol.2019.11.339.
[15] Martinod R, Historic O, Reg N. Maintenance policy optimization for multicomponent systems considering degradation of components and imperfect maintenance action. Computers and Industrial Engineering 2018; 124: 100–112. https://doi.org/10.1016/j.cie.2018.07.019.
[16] Ghorbani M, Nourelfath M, Gendrei M. a two-stage stochastic programing model for selective maintenance optimization. Reliability Engineering and System Safety 2022; 223: 1–14. https://doi.org/10.1016/j.ress.2022.108480.
[17] Kuo Y. Optimal adaptive control policy for joint machine maintenance and product quality control. European Journal of Operational Research 2006; 171: 586–597. https://doi.org/10.1016/j.ejor.2004.09.022.
[18] Fallahnezhad M S, Nikki S T. A new machine replacement policy based on number of defective items and Markov chains. Iranian Journal of Operations Research 2011; 2: 17–28.
[19] Andersen J, Andersen A, Nielsen B. A numerical study of Markov decision process algorithms for multicomponent replacement problems. European Journal of Operational Research 2022; 299: 898–909. https://doi.org/10.1016/j.ejor.2021.07.007.
[20] Jin H, Han F, Sang Y. An optimal maintenance strategy for multistate deterioration systems based on a semi-Markov decision process coupled with simulation technique. Mechanical Systems and Signal Processing 2020; 139: 1–22. https://doi.org/10.1016/j.ymssp.2019.106570.
[21] Pricopie A, Frangu L, Vilaniva R. Caraman, Caraman S. A preventive maintenance strategy for an actuator using Markov models. IFAC Papers Online 2020; 53(2): 784–789. https://doi.org/10.1016/j.ifacol.2020.12.831.
[22] Comaserica C, Asgardhr S. Optimum Maintenance Policy Using Semi-Markov Decision Processes. Electric Power Systems Research 2009; 79: 1286–1291. https://doi.org/10.1016/j.epsr.2009.03.008.
[23] Amari S, McLaughlin L, Sham H. Cost-Effective Condition-Based Maintenance Using Markov Decision Processes. Reliability and Maintainability Symposium 2006; 06. https://doi.org/10.1109/RAMS.2006.1677417.
[24] Roman F, Kraijema S, Godjevac M, Lodowick G. Optimizing preventive maintenance policy: A data-driven application for a light rail braking system. ProcInstMechEng 2017; 231(5):534–45. https://doi.org/10.1177/1748006X17712662.
[25] Kamal G, Aly M F, Mohib A, Affy IH. Optimization of a multilevel integrated preventive maintenance scheduling mathematical model using genetic algorithm. Int J Manage Sci Eng. Manage 2020; 15(4):247–57. https://doi.org/10.1080/17509653.2020.1726834.
[26] Lin D, Zuo M J, Yam R. Sequential imperfect preventive maintenance models with two categories of failure modes. Nav. Res. Legist 2001; 48 (2): 172–183. https://doi.org/10.1002/1520-6750(200103)48:2\%3C172::AID-NAV5\%3E3.0.CO;2-5.
[27] Shi Y, Xiang Y, Li M. Optimal maintenance policies for multilevel preventive maintenance with complex effects, IISE Trans 2019; 51 (9): 999–1011. https://doi.org/10.1080/24725854.2018.1532135.
[28] Sarkar B, Fair T. Minimizing maintenance cost for offshore wind turbines following multilevel opportunistic preventive strategy. Renewable Energy 2016; 85: 104–113. https://doi.org/10.1016/j.renene.2015.06.030.
[29] Tajiani B, Vatn J, Naser M. Optimizing the maintenance threshold in presence of shocks: A numerical framework for systems with non-monotonic degradation. Reliability Engineering and System Safety 2024; https://doi.org/10.1016/j.ress.2024.110039.
[30] Li B, Ran Y, Chen B, Chen F, Cai C, Zhang G. Opportunistic maintenance strategy optimization considering imperfect maintenance under hybrid unit-level maintenance strategy. Computers & Industrial Engineering 2023; https://doi.org/10.1016/j.cie.2023.10962.
[31] Ziółkowski J, Oszczypała M, Lêgas A, Konwerski J, Małachowski J, A method for calculating the technical readiness of aviation refuelling vehicles, EksploatacjaiNiezawodnosc – Maintenance and Reliability 2024: 26(3), http://doi.org/10.17531/ein/187888.
[32] Oszczypała M, Ziółkowski J, Małachowski J, Semi-Markov approach for reliability modelling of light utility vehicles. EksploatacjaiNiezawodnosc – Maintenance and Reliability 2023: 25(2), http://doi.org/10.17531/ein/161859.
[33] Knopi K L, MigAw A K. Semi-Markov system model for minimal repair maintenance. Eksploatacjainiezawodnosc – Maintenance and Reliability 2019; 21(2): 256–260, http://dx.doi.org/10.17531/ein.2019.2.9.
[34] Kumar, Pardeep, and Amit Kumar. “Time dependent performance analysis of a Smart Trash bin using state-based Markov model and Reliability approach.” Cleaner Logistics and Supply Chain 9 (2023): 100122. https://doi.org/10.1016/j.clscn.2023.100122.
[35] Kumar, Pardeep, and Amit Kumar. “Quantifying reliability indices of garbage data collection IOT-based sensor systems using Markov birth-death process.” International Journal of Mathematical, Engineering and Management Sciences 8.6 (2023): 1255.
[36] Kumar, Amit, and Pardeep Kumar. “Reliability assessment for multi-state automatic ticket vending machine (ATVM) through software and hardware failures.” Journal of Quality in Maintenance Engineering 28.2 (2022): 448–473.
[37] Bowling, Shannon R., et al, A Markovian approach to determining optimum process target levels for a multi-stage serial production system, European Journal of Operational Research 159.3 (2004): 636–650. https://doi.org/10.1016/S0377-2217(03)00429-6.
Biographies

Mohammad Hossein Kargar Shouroki is a PhD student at Yazd University, specializing in maintenance and repair. He has been actively engaged in valuable scientific and research activities, focusing on optimizing maintenance and repair processes using Markov model relationships. His work has led to the publication of reputable scientific articles and the presentation of innovative findings in his field of expertise. Alongside his academic achievements, he has participated in university projects and international collaborations, contributing significantly to the advancement of knowledge in his domain. He has also attended various national and international scientific conferences to present his research. With his passion and dedication to research, he is expected to continue making substantial scientific and academic contributions in the future and to be recognized as one of the leading researchers in the field of maintenance and repair. His areas ofinterest include: reliability, quality control, and operations research.

Mohammad Saber Fallahnezhad is Professor at Yazd University, Iran. He received his B.S., M.S. and Ph.D. degrees, all in Industrial Engineering from Sharif University of Technology, Tehran, Iran. Also he has been a visiting researcher in Karlsruhe University, Germany. Also, he has been awarded a Silver medal in 16th National Mathematics Olympiad in Iran and he has been ranked 1st in the graduate national university comprehensive exam in System Management in Iran. He has been ranked 47th among all high school graduates in Iran. His areas of interest include: reliability, quality control, quality engineering and operations research.
Journal of Reliability and Statistical Studies, Vol. 18, Issue 1 (2025), 165–188.
doi: 10.13052/jrss0974-8024.1817
© 2025 River Publishers