Enhancing Accuracy in Population Mean Estimation with Advanced Memory Type Exponential Estimators
Poonam Singh1, Prayas Sharma2 and Pooja Maurya1,*
1Department of Statistics, Banaras Hindu University Varanasi, 221005, India
2Department of Statistics, Babasaheb Bhimrao Ambedkar University Lucknow, 226025, India
E-mail: poonamsingh@bhu.ac.in; prayassharma02@gmail.com; poojamaurya@bhu.ac.in
*Corresponding Author
Received 24 September 2024; Accepted 01 December 2024
Abstract
For a number of reasons, mean estimate is an essential sampling activity as it offers crucial information and forms the basis of statistical inference and judgement. In this study, we estimate the population mean using the Exponentially Weighted Moving Average (EWMA) statistic and provide generalized family of exponential estimators. The theoretical aspects of the suggested estimator are evaluated via rigorous mathematical derivations of the bias and mean square error (MSE), which are then compared to other exponential estimators that are already in use. Furthermore, a thorough simulation research is carried out to thoroughly assess the effectiveness and empirical performance of the suggested strategy. The results highlight how the estimator’s effectiveness is significantly increased when both recent and historical data are used in tandem.
Keywords: Bias, Exponentially Weighted Moving Average (EWMA), Mean Square Error (MSE), Memory type estimator, Percent Relative Efficiency (PRE).
1 Introduction
Utilizing supplementary information is a crucial tactic in survey sampling to increase estimators accuracy in calculating the population mean. Additional, easily accessible population data that is connected with the study variable and may be used to increase estimating accuracy and efficiency is referred to as auxiliary information.
The ratio estimator propounded by Cochran [5] is usually used when the study and auxiliary variable have a positive linear relationship. By taking advantage of the proportionality between the two variables, this estimator permits modifications that are consistent with their direct correlation. By taking into account the strength of positive correlation, the ratio estimator efficiently lowers variance and improves the estimate dependability .
On the other hand, the product estimator given by Robson [14] is better suitable when the linear connection is negative. This estimator makes adjustments that reflect the opposing trends of the study and auxiliary variables by taking advantage of their inverse connection. Despite the divergent directional trends, the product estimator guarantees more precise population mean predictions by taking into account the negative correlation.
The importance of auxiliary information in improving estimate methods in survey sampling is highlighted by the careful selection of these estimators based on the kind of correlation between the study and auxiliary variables.
Many authors [1, 4, 6, 7, 16, 17, 19, 21–25] have extensively utilized auxiliary information to refine and enhance the efficiency of estimators under various sampling designs. These contributions underscore the pivotal role of auxiliary variables in improving the accuracy and reliability of population parameter estimates, demonstrating their applicability across a wide array of methodological advancements and practical scenarios.
In recent decades, the systematic collection of data through time-scaled surveys has gained significant importance across various research fields, becoming essential for informed decision-making and effective policy formulation. Notable examples include the National Sample Survey (NSS) and the National Family Health Survey (NFHS), both conducted every five years by the Government of India. Additionally, the Annual Status of Education Report (ASER) and the Periodic Labour Force Survey (PLFS), conducted annually, provide critical insights into demographic, health, and educational trends over time. A significant challenge arises when conventional estimators are employed to estimate the population parameter from these time-scaled surveys. These estimators give ordinary results that fail to capture the complexity of the data, primarily due to their design for cross-sectional studies, which fails to account for the temporal trends inherent in longitudinal data. As a result, important changes over time, such as fluctuations in employment rates and trends in healthcare access, are overlooked, resulting in potentially misleading conclusions for policy-making.
To address these challenges, we utilize the EWMA statistic, which assigns exponentially decreasing weights to past observations. By placing greater emphasis on more recent data, EWMA facilitates a more dynamic analysis of trends. In this study, we explore the effectiveness of EWMA in estimating population parameters and propose a memory-type exponential estimator specifically designed for time-scaled surveys. Roberts [13] was the first to propose the idea of EWMA. Several authors [2, 3, 8–11, 15, 20] have utilized EWMA statistic to estimate population parameters in the context of time-scaled surveys. Their research emphasizes how important EWMA is for combining current and historical data, which improves estimating accuracy and efficiency in dynamic survey environments. Nonetheless, there is still a dearth of research on exponential estimators for time-scaled surveys. Numerous sampling methods and their uses have been extensively studied, but the particular use of exponential estimators in time-scaled surveys has not gotten as much attention. Since exponential estimators have the potential to increase the precision and effectiveness of population parameter estimation, particularly when taking into account the temporal dynamics of data collection in time-series or longitudinal surveys, this gap offers a chance for more research.
EWMA Statistic- The EWMA statistic is a memory-type statistic that enhances estimator efficiency by weighting past and present data. Roberts [13] was the first to introduce the EWMA statistic to observe the change in process mean and is given by
where is the mean of current data, and is the smoothing constant, which varies proportionally to the weight given to the latest data and is inversely proportional to the weight given to past value (information). Note that when takes the value , it means that all weight is given to the latest data, and in this case, the EWMA statistic is equal to . Here denotes the number of samples, and denotes the past value (information). Here we assume the starting value of i.e., is equal to zero.
The term “” means the weight decreases exponentially as the number of past data points increases. And
where is the mean and variance of the study variable respectively. And the limiting variance of is given by
Now we briefly outline the rest of the manuscript. In Section 2, we reassess several existing estimators from the literature and derive the expression for their . Section 3 introduces a class of memory-type exponential estimators for which we determine the minimum . In Section 4, we conduct an extensive simulation study. Finally, Sections 5 present the conclusion of our study.
2 Review of Some Existing Estimators in Literature
First, we review several prominent estimators that have been extensively studied and applied in the literature and then modify them into memory-type estimators to improve their efficiency.
Let and be the study and auxiliary variables, respectively, within a population having units. Let and denote the sample means of the study variable and the auxiliary variable, respectively. Additionally, let
| (1) | ||
| (2) |
be the EWMA statistic for study and auxiliary variables, respectively. Based on the above population, a summary of several related existing estimators along with their MSE is provided below:
(a) The classical ratio estimator suggested by Cochran [5] is
Further Noor-ul Amin [8] suggested the memory type ratio estimator as follows:
| (3) |
The approximate MSE of is given by
| (4) |
where and represent the coefficients of variation for the study and auxiliary variables, respectively, and is the correlation coefficient between the study and auxiliary variables.
(b) Regression estimator suggested by Watson [1] is as follows:
where is the regression coefficient. By utilizing (1) and (2), in the memory-type regression estimator is given as:
| (5) |
The approximated MSE of is given below
| (6) |
(c) The exponential ratio type estimator suggested by Bahl and Tuteja [4] is given by
Now, employing (1) and (2) in the above expression, the memory type exponential ratio estimator is given as:
| (7) |
and we obtain the approximate MSE of , which is as follows:
| (8) |
3 Proposed Class of Memory Type Exponential Estimators
Now, in this section, we propose a class of memory-type exponential estimators that introduce a novel approach to improving estimation accuracy. These estimators are designed to efficiently incorporate past information, potentially resulting in lower MSE and higher PRE compared to existing methods.
Suppose and are the study and auxiliary variables, respectively. The exponential type estimator given by [18] is
where and are the sample mean of study and auxiliary variable, is the population mean of auxiliary variable, and denote approximately chosen constants intended to minimize , while and are real constants.
Now, employing (1) and (2), in the memory type exponential estimator is given as follows:
| (9) |
where and represent approximately chosen constants aimed at minimizing , are real constants, and is the population mean (which is known in advance) of auxiliary variable.
Table 1 Members of the proposed class of estimator for different value of and
| Estimators | ||||
| 1 | 1 | |||
| 1 | -1 | |||
| 1 | 0 | |||
| 0 | 1 |
We use the Taylor series expansion to calculate the minimum MSE of the estimator up to the second-order approximation, using the terms listed below:
| (10) |
such that
| (11) | ||
| (12) | ||
| (13) | ||
| (14) |
Utilizing equation (10) in (9), we have
we can also write the above equation as:
where Now, by subtracting from both sides of the above equation, we obtain
| (15) |
Employing expectation on both sides of the Equation (3), and using (12), (13), (14), we have
| (16) |
By squaring and taking expectation on both sides of (3) and applying (11), (12), (13), and (14), we get:
| (17) |
where
To minimize the MSE of the estimator , we differentiate equation (17) with respect to and , we have
| (18) | ||
| (19) |
Now, utilizing and in equation (17), we obtain the expression for minimum MSE of
| (20) |
4 Simulation Studies
A comprehensive simulation study was conducted to evaluate the effectiveness of the proposed memory-type estimators. The Mean Squared Error (MSE) and Percent Relative Efficiency of both the proposed and existing estimators, relative to the usual estimator , were calculated using the following formulas, based on 10,000 replications:
| (21) |
and
| (22) |
where respectively.
The of the estimators is calculated at various levels of correlation and weight parameter using the algorithm given by [12]:
(i) Generate two independent population of size such that and
(ii) Set where is the correlation between and , and take the value for
(iii) Select samples of sizes respectively. And compute the estimator for each samples.
(iv) Compute the MSE for each sample size for each estimator using (21).
(v) Obtained the relative efficiencies for each sample using (22).
Table 2 of estimators relative to usual estimator , with smoothing constant , across different values of
| 50 | 130.339 | 259.769 | 241.379 | 259.803 | 259.815 | 259.808 | 259.777 | 124.519 | 248.9633 | 236.981 | 248.982 | 248.9865 | 248.984 | 248.9752 | |
| 100 | 130.236 | 256.483 | 240.919 | 256.499 | 256.504 | 256.501 | 256.486 | 124.446 | 245.8732 | 236.565 | 245.8819 | 245.884 | 245.8829 | 245.8789 | |
| 0.75 | 200 | 130.2458 | 254.9266 | 240.6422 | 254.9345 | 254.9371 | 254.9356 | 254.9284 | 124.4498 | 244.3562 | 236.2858 | 244.3605 | 244.3615 | 244.3609 | 244.3589 |
| 300 | 130.4292 | 254.8418 | 240.9131 | 254.8471 | 254.8488 | 254.8478 | 254.843 | 124.6254 | 244.2817 | 236.5581 | 244.2845 | 244.2852 | 244.2848 | 244.2835 | |
| 500 | 130.4138 | 254.2836 | 240.7363 | 254.2866 | 254.2875 | 254.287 | 254.2843 | 124.615 | 243.7464 | 236.3703 | 243.7481 | 243.7484 | 243.7482 | 243.7475 | |
| 50 | 158.2099 | 315.3172 | 282.7581 | 315.3644 | 315.3808 | 315.3716 | 315.3266 | 151.2466 | 302.4025 | 278.9843 | 302.4275 | 302.4339 | 302.4303 | 302.4168 | |
| 100 | 158.0578 | 311.273 | 282.2054 | 311.2949 | 311.3026 | 311.2983 | 311.2773 | 151.1315 | 298.5969 | 278.475 | 298.6085 | 298.6115 | 298.6099 | 298.6037 | |
| 0.80 | 200 | 158.0433 | 309.3339 | 281.8465 | 309.3446 | 309.3483 | 309.3462 | 309.33 | 151.1121 | 296.7074 | 278.1128 | 296.7132 | 296.7146 | 296.7138 | 296.7108 |
| 300 | 158.2765 | 309.2517 | 282.1398 | 296.7108 | 309.2613 | 309.2599 | 309.2532 | 151.3367 | 296.6392 | 278.4107 | 296.643 | 296.644 | 296.6434 | 296.6414 | |
| 500 | 158.236 | 308.5317 | 281.9107 | 308.5358 | 308.5372 | 308.5364 | 308.5325 | 151.3028 | 295.9477 | 278.1643 | 295.9498 | 295.9504 | 295.9501 | 295.9489 | |
| 50 | 204.6092 | 407.7925 | 338.1489 | 407.864 | 407.8901 | 407.8755 | 407.8044 | 195.8653 | 391.6131 | 335.8177 | 391.6501 | 391.6604 | 391.6547 | 391.6315 | |
| 100 | 204.3758 | 402.49 | 337.507 | 402.5232 | 402.5355 | 402.5286 | 402.4954 | 195.6814 | 386.6162 | 335.2139 | 386.6335 | 386.6383 | 386.6356 | 386.6249 | |
| 0.85 | 200 | 204.3206 | 399.9111 | 337.0577 | 399.9273 | 399.9333 | 399.93 | 399.9138 | 195.6229 | 384.104 | 334.7582 | 384.1125 | 384.1148 | 384.1135 | 384.1083 |
| 300 | 204.6336 | 399.8276 | 337.3538 | 399.8384 | 399.8423 | 399.8401 | 399.8294 | 195.9262 | 384.0404 | 335.0621 | 384.046 | 384.0476 | 384.0467 | 384.0432 | |
| 500 | 204.5502 | 398.8362 | 337.07 | 398.8423 | 398.8446 | 398.8433 | 398.8372 | 195.8521 | 383.0859 | 334.7517 | 383.0891 | 383.09 | 383.0895 | 383.0875 | |
| 50 | 297.0771 | 592.0839 | 410.9774 | 592.2381 | 592.2666 | 592.2381 | 592.1006 | 285.0404 | 569.9099 | 411.4358 | 569.9761 | 569.9964 | 569.9851 | 569.9365 | |
| 100 | 296.6856 | 584.2814 | 410.3027 | 584.3428 | 584.3668 | 584.3534 | 584.2891 | 284.7227 | 562.5388 | 410.7865 | 562.5697 | 562.5792 | 562.5739 | 562.5514 | |
| 0.90 | 200 | 296.5472 | 580.4236 | 409.7885 | 580.4537 | 580.4653 | 580.4588 | 580.4274 | 284.5846 | 558.7797 | 410.2613 | 558.7948 | 558.7994 | 558.7968 | 558.7858 |
| 300 | 297.0134 | 580.3257 | 410.0346 | 580.3455 | 580.3531 | 580.3489 | 580.3282 | 285.0392 | 558.7133 | 410.5154 | 558.7233 | 558.7263 | 558.7246 | 558.7173 | |
| 500 | 296.8422 | 578.789 | 409.7203 | 578.8003 | 578.8047 | 578.8022 | 578.7904 | 284.8825 | 557.2291 | 410.1636 | 557.2348 | 557.2365 | 557.2355 | 557.2314 | |
| 50 | 572.666 | 1141.341 | 491.1003 | 1141.74 | 1141.906 | 1141.813 | 1141.372 | 551.6907 | 1103.051 | 495.368 | 1103.242 | 1103.309 | 1103.271 | 1103.102 | |
| 100 | 571.8166 | 1126.114 | 490.5995 | 1126.301 | 1126.379 | 1126.335 | 1126.128 | 550.984 | 1088.603 | 494.8742 | 1088.692 | 1088.724 | 1088.706 | 1088.627 | |
| 0.95 | 200 | 571.4236 | 1118.432 | 490.1682 | 1118.523 | 1118.56 | 1118.539 | 1118.439 | 550.6043 | 1081.107 | 494.4319 | 1081.151 | 1081.166 | 1081.157 | 1081.119 |
| 300 | 572.3255 | 1118.25 | 490.2576 | 1118.31 | 1118.335 | 1118.321 | 1118.255 | 551.4904 | 1080.992 | 494.5201 | 1081.02 | 1081.03 | 1081.025 | 1080.999 | |
| 500 | 571.8849 | 1115.073 | 490.0197 | 1115.107 | 1115.121 | 1115.113 | 1115.076 | 551.0793 | 1077.909 | 494.2434 | 1077.925 | 1077.931 | 1077.928 | 1077.913 |
Table 3 of estimators relative to usual estimator , with smoothing constant , across different values of
| 50 | 119.902 | 240.574 | 233.365 | 240.613 | 240.614 | 240.613 | 240.639 | 119.377 | 239.907 | 233.025 | 240.01 | 240.012 | 240.011 | 240.08 | |
| 100 | 119.903 | 237.523 | 232.942 | 237.542 | 237.542 | 237.542 | 237.554 | 119.481 | 236.841 | 232.621 | 236.901 | 236.901 | 236.901 | 236.934 | |
| 0.75 | 200 | 119.872 | 235.995 | 232.658 | 236.004 | 236.005 | 236.005 | 236.01 | 119.465 | 235.322 | 232.334 | 235.347 | 235.347 | 235.347 | 235.363 |
| 300 | 120.048 | 235.936 | 232.946 | 235.942 | 235.942 | 235.942 | 235.946 | 119.6493 | 235.274 | 232.631 | 235.281 | 235.29 | 235.281 | 235.301 | |
| 500 | 120.051 | 235.436 | 232.764 | 235.439 | 235.439 | 235.439 | 235.441 | 119.659 | 234.767 | 232.448 | 234.776 | 234.776 | 234.776 | 234.782 | |
| 50 | 145.726 | 292.387 | 275.871 | 292.437 | 292.439 | 292.438 | 292.466 | 145.097 | 291.596 | 275.595 | 291.721 | 291.733 | 291.731 | 291.808 | |
| 100 | 145.694 | 288.613 | 275.327 | 288.637 | 288.638 | 288.637 | 288.651 | 145.188 | 287.808 | 275.049 | 287.873 | 287.874 | 287.874 | 87.91 | |
| 0.80 | 200 | 145.635 | 286.716 | 274.971 | 286.727 | 286.728 | 286.727 | 286.734 | 145.147 | 285.911 | 274.687 | 285.942 | 285.943 | 285.943 | 285.961 |
| 300 | 145.861 | 286.669 | 275.281 | 286.677 | 286.677 | 286.677 | 286.681 | 145.385 | 285.879 | 275.017 | 285.899 | 285.891 | 285.891 | 285.911 | |
| 500 | 145.845 | 286.021 | 275.046 | 286.026 | 286.026 | 286.026 | 286.028 | 145.376 | 285.223 | 274.771 | 285.235 | 285.235 | 285.2353 | 285.242 | |
| 50 | 188.936 | 379.086 | 333.901 | 379.156 | 379.151 | 379.158 | 379.188 | 188.146 | 378.108 | 333.766 | 378.296 | 378.304 | 378.299 | 378.383 | |
| 100 | 188.841 | 374.103 | 333.223 | 374.137 | 374.139 | 374.138 | 374.153 | 188.211 | 373.094 | 333.049 | 373.185 | 373.189 | 373.187 | 373.227 | |
| 0.85 | 200 | 188.746 | 371.589 | 332.789 | 371.605 | 371.606 | 371.606 | 371.613 | 188.131 | 370.581 | 332.606 | 370.625 | 370.627 | 370.626 | 370.645 |
| 300 | 189.053 | 371.557 | 333.111 | 371.568 | 371.568 | 371.568 | 371.572 | 188.455 | 370.561 | 332.949 | 370.599 | 370.591 | 370.599 | 370.611 | |
| 500 | 189.003 | 370.661 | 332.804 | 370.668 | 370.668 | 370.668 | 370.67 | 188.414 | 369.664 | 332.621 | 369.68 | 369.681 | 369.68 | 369.688 | |
| 50 | 275.507 | 552.782 | 411.883 | 552.898 | 552.906 | 552.902 | 552.9313 | 274.41 | 551.471 | 412.015 | 551.78 | 551.801 | 551.789 | 551.874 | |
| 100 | 275.312 | 545.381 | 411.101 | 545.437 | 545.441 | 545.439 | 545.453 | 274.425 | 543.998 | 411.147 | 544.147 | 544.157 | 544.151 | 544.191 | |
| 0.90 | 200 | 275.118 | 541.633 | 410.629 | 541.651 | 541.662 | 541.661 | 541.667 | 274.267 | 540.253 | 410.654 | 540.325 | 540.33 | 540.327 | 540.347 |
| 300 | 275.583 | 541.618 | 410.911 | 541.636 | 541.637 | 541.636 | 541.641 | 274.757 | 540.272 | 410.947 | 540.319 | 540.323 | 540.321 | 540.333 | |
| 500 | 275.464 | 540.221 | 410.543 | 540.231 | 540.232 | 540.232 | 540.234 | 274.651 | 538.859 | 410.571 | 538.886 | 538.888 | 538.887 | 538.894 | |
| 50 | 535.071 | 1073.594 | 499.076 | 1073.885 | 1073.919 | 1073.9 | 1073.887 | 533.135 | 1071.42 | 499.56 | 1072.192 | 1072.278 | 1072.23 | 1072.209 | |
| 100 | 534.566 | 1058.953 | 498.437 | 1059.092 | 1059.108 | 1059.099 | 1059.092 | 532.995 | 1056.565 | 498.775 | 1056.935 | 1056.976 | 1056.953 | 1056.942 | |
| 0.95 | 200 | 534.108 | 1051.514 | 498.0625 | 1051.581 | 1051.588 | 1051.584 | 1051.581 | 532.611 | 1049.14 | 498.385 | 1049.319 | 1049.338 | 1049.327 | 1049.321 |
| 300 | 535.023 | 1051.509 | 498.164 | 1051.552 | 1051.557 | 1051.555 | 1051.552 | 533.578 | 1049.208 | 498.488 | 1049.324 | 1049.337 | 1049.329 | 1049.325 | |
| 500 | 534.687 | 1048.594 | 497.859 | 1048.619 | 1048.622 | 1048.62 | 1048.619 | 533.269 | 1046.259 | 498.176 | 1046.325 | 1046.333 | 1046.328 | 1046.326 |
5 Discussion and Results
Tables 2 and 3 represents the of the existing and the proposed estimators relative to usual estimator , with smoothing constant , across different values of and . Key findings from Tables 2 and 3 are:
(i) As (smoothing constant) decreases from to for any fixed value of the of the proposed estimators increases. Here indicate the weight assign to current information so if we take i.e. we use only current information then our proposed memory type exponential estimator is equal to the estimator .
(ii) Increasing the correlation coefficient between the study and the auxiliary variable results in a rise in the of the estimators. This is true regardless of the values of and . It may be inferred from this that the effectiveness of the estimators improves as the strength of the association between the study and the auxiliary variable increases (that is, as increases). When the value of is larger, it shows that the auxiliary variable offers more relevant information for predicting the study variable, which ultimately results in more accurate predictions. This information is used more effectively by the suggested estimators, which ultimately leads to an increase in values.
(iii) As the sample size rises, notably for the values and , the proposed class of estimators has a that is higher than that of the current estimators. This is the case even when the values of and remain the same. The implication of this is that the proposed estimators demonstrate superior efficiency in utilizing the information provided by both the study and auxiliary variables as more data points become available. Furthermore, with a larger sample size, the estimators are able to better capture the underlying relationships and reduce the variability in the estimates. This better performance leads to a higher , which indicates that the suggested estimators are more effective in terms of accuracy when compared to the alternatives that are currently available.
According to Figure 1, which depicts the influence of smoothing constant on the of the suggested estimators, the sample size is set at , and the coefficient of correlation is . When the value of grows from zero to one, we find that the of the suggested class of estimators rapidly drops. This is something that we see. The fact that gradually decreases as the value of grows suggests that the suggested estimators perform better as they include more information from the past. This is because they become less susceptible to noise and fluctuations in the data that is currently being used.
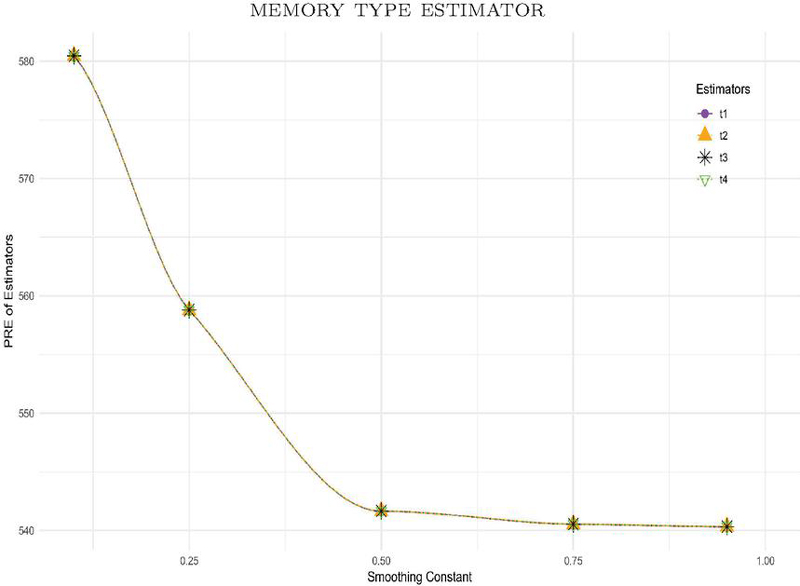
Figure 1 Effect of smoothing constant on of estimators ti (here ti, i=1,2,3,4 used for notation of the estimators respectively.)
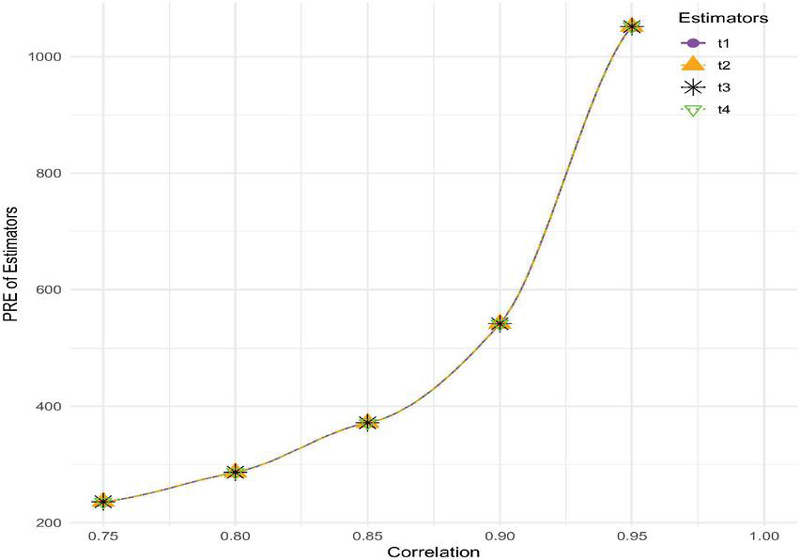
Figure 2 Effect of correlation on of estimators ti (here ti, i=1,2,3,4 used for notation of the estimators respectively.)
According to Figure 2, which depicts the influence of correlation coefficient on the of the suggested estimators, the sample size is set at , and the smoothing constant is . When the correlation coefficient is increased, the suggested class of estimators experiences a rise in the . The implication of this is that the suggested estimators become more effective as the linear connection between the study and auxiliary variables becomes stronger (that is, as increases). When is larger, it suggests that the auxiliary variable gives more pertinent information for predicting the study variable. This enables the estimator to make better use of the data that is accessible to them. Because of this, the performance of the estimator is enhanced, which ultimately results in a greater percentage.This pattern demonstrates that a larger correlation between the study and auxiliary variables helps the estimator to attain better accuracy.
6 Conclusion
In this study, we aimed to enhance the efficiency of estimators by leveraging the concept of EWMA statistic. For the purpose of accomplishing this objective, we developed a family of estimators that include the EWMA statistic. Furthermore, in order to assess the effectiveness of these estimators, we carried out a comprehensive simulation research. The results of this investigation are shown in Tables 2 and 3 to illustrate the findings. It is obvious, after doing an analysis of the data included in these tables, that the suggested category of estimators consistently displays greater efficiency when compared to other established estimators, such as , , and . Based on these results, we strongly suggest that our suggested family of estimators be used for the purpose of estimating population parameters since they provide a higher level of efficiency in comparison to the approaches that are already in use. Additionally, the scope of our research might be broadened by investigating other sampling methods, such as cluster or stratified sampling, and by using our estimators to estimate a wider variety of population characteristics, such as variances, proportions, or regression coefficients. This would allow us to investigate a wider range of population parameters. Furthermore evaluating the adaptability and robustness of the suggested estimators in a variety of statistical settings will be made easier with the assistance of this expansion.
References
[1] NK Adichwal, Prabhakar Mishra, Poonam Singh, Rajesh Singh, and Z Yan, A two parameter ratio-product-ratio type estimator for population coefficient of variation based on SRSWOR, J. Adv. Res. Appl. Math Stat 1 (2016), 1–5.
[2] Irfan Aslam, Muhammad Noorul Amin, Amjad Mahmood, and Prayas Sharma, New memory-based ratio estimator in survey sampling, Natural and Applied Sciences International Journal (NASIJ) 5 (2024), no. 1, 168–181.
[3] Irfan Aslam, Muhammad Noor-ul Amin, Muhammad Hanif, and Prayas Sharma, Memory type ratio and product estimators under ranked-based sampling schemes, Communications in Statistics-Theory and Methods 52 (2023), no. 4, 1155–1177.
[4] Shashi Bahl and RK Tuteja, Ratio and product type exponential estimators, Journal of information and optimization sciences 12 (1991), no. 1, 159–164.
[5] WG Cochran, The estimation of the yields of cereal experiments by sampling for the ratio of grain to total produce, The journal of agricultural science 30 (1940), no. 2, 262–275.
[6] Amjad Javaid, Muhammad Noor-ul Amin, and Muhammad Hanif, Modified ratio estimator in systematic random sampling under non-response, Proceedings of the National Academy of Sciences, India Section A: Physical Sciences 89 (2019), 817–825.
[7] Cem Kadilar and Hulya Cingi, Ratio estimators in simple random sampling, Applied mathematics and computation 151 (2004), no. 3, 893–902.
[8] Muhammad Noor-ul Amin, Memory type estimators of population mean using exponentially weighted moving averages for time scaled surveys, Communications in Statistics-Theory and Methods 50 (2021), no. 12, 2747–2758.
[9] Muhammad Nouman Qureshi, Osama Abdulaziz Alamri, Naureen Riaz, Ayesha Iftikhar, Muhammad Umair Tariq, and Muhammad Hanif, Memory-type variance estimators using exponentially weighted moving average statistic in presence of measurement error for time-scaled surveys, Plos one 18 (2023), no. 11, e0277697.
[10] Muhammad Nouman Qureshi, Muhammad Umair Tariq, Osama Abdulaziz Alamri, and Muhammad Hanif, Estimation of heterogeneous population variance using memory-type estimators based on EWMA statistic in the presence of measurement error for time-scaled surveys, Communications in Statistics-Simulation and Computation (2024), 1–14.
[11] Muhammad Nouman Qureshi, Muhammad Umair Tariq, and Muhammad Hanif, Memory-type ratio and product estimators for population variance using exponentially weighted moving averages for time-scaled surveys, Communications in Statistics-Simulation and Computation 53 (2024), no. 3, 1484–1493.
[12] M Krishna Reddy, K Ranga Rao, and Naveen Kumar Boiroju, Comparison of ratio estimators using monte carlo simulation, International Journal of Agriculture and Statistical Sciences 6 (2010), no. 2, 517–527.
[13] SW Roberts, Control chart tests based on geometric moving averages, Technometrics 42 (2000), no. 1, 97–101.
[14] DS Robson, Applications of multivariate polykays to the theory of unbiased ratio-type estimation, Journal of the American Statistical Association 52 (1957), no. 280, 511–522.
[15] Prayas Sharma, Poonam Singh, Mamta Kumari, and Rajesh Singh, Estimation Procedures for Population Mean using EWMA for Time Scaled Survey, Sankhya B (2024), 1–26.
[16] Anjali Singh, Poonam Singh, Prayas Sharma, and Badr Aloraini, Estimation of Population Mean using Neutrosophic Exponential Estimators with Application to Real Data, International Journal of Neutrosophic Science (IJNS) 25 (2025), no. 03, 322–338.
[17] Poonam Singh and Rajesh Singh, Exponential ratio type estimator of population mean in presence of measurement error and non response, IJSE 18 (2017), no. 3, 102–121.
[18] Rajesh Singh, Prabhakar Mishra, Ahmed Auduudu, and Supriya Khare, Exponential type estimator for estimating finite population mean, International Journal of Computational and Theoretical Statistics 7 (2020), no. 01.
[19] Rajesh Singh, and Prayas Sharma, A class of exponential ratio estimators of finite population mean using two auxiliary variables, Pakistan Journal of Statistics and Operation Research (2015), 221–229.
[20] Rajesh Singh, Poonam Singh, and Sakshi Rai, Estimators using EWMA Statistic for Estimation of Population Mean, Mathematical Statistician and Engineering Applications 72 (2023) no. 2, 31–41.
[21] Rajesh Singh, Hemant K Verma, and Prayas Sharma, Estimation of population mean using exponential type imputation technique for missing observations, Journal of Modern Applied Statistical Methods 15 (2016), no. 1, 19.
[22] DJ Watson, The estimation of leaf area in field crops, The Journal of Agricultural Science 27 (1937), no. 3, 474–483.
[23] Tolga Zaman, and Cem Kadilar, Novel family of exponential estimators using information of auxiliary attribute, Journal of Statistics and Management Systems 22 (2019), no. 8, 1499–1509.
[24] Tolga Zaman, and Cem Kadilar, Exponential ratio and product type estimators of the mean in stratified two-phase sampling, AIMS Mathematics 6 (2021), no. 5, 4265–4279.
[25] Tolga Zaman and Cem Kadilar, New class of exponential estimators for finite population mean in two-phase sampling, Communications in Statistics-Theory and Methods 50 (2021), no. 4, 874–889.
Biographies

Poonam Singh is a dedicated academician and researcher in the field of Statistics. She earned her Ph.D. in 2020 from Banaras Hindu University. With over eight years of experience in teaching and research, Dr. Singh specializes in modeling and estimating unknown population parameters in survey sampling, with a focus on addressing non-response and measurement errors. Currently serving in the Department of Statistics, Banaras Hindu University, she has published around 15 research articles in indexed journals, showcasing her contributions to the field. Dr. Singh is passionate about fostering collaboration and has been actively involved in international research initiatives. A skilled educator, Dr. Singh has a strong commitment to undergraduate and postgraduate teaching, inspiring future statisticians through her expertise and enthusiasm for the subject.

Prayas Sharma is currently working as Assistant Professor in the Department of Statistics, Babasaheb Bhimrao Ambedkar University, Lucknow. Dr. Sharma holds a Bachelor’s degree in Computer Science & Statistics, Masters and Doctorate degree in Statistics from Banaras Hindu University, Varanasi, India. Dr. Sharma has good knowledge of Statistics, Artificial Intelligence and Machine Learning, Business Analytics & Research Methodology along with strong computational & programming skills.He has more than 11 years of academic experience, both in the domain of teaching and research. His research interest includes Survey Sampling, Estimation Procedures using Auxiliary Information and Measurement Errors, Predictive Modelling, Business Analytics and Operations Research. Dr. Sharma has published more than 50 research papers in reputed National & International journals along with one book and two chapters in book internationally published. He has more than 630 citations with H-Index 17 & I index of 20. Dr. Sharma has a keen interest in reading, writing and publishing, he is serving 7 reputed journals as editor/associate editor and more than 30 journals as reviewer and reviewed more than 150 research papers from the journals like Communication in Statistics (T&F), Journal of Statistical Theory and Practice (T&F), Heliyon, Scientific Reports, Clinical Epidemiology and Global Health (Elsevier), Applied Economics, Hacettepe Journal of Mathematics and Statistics, Statistics in Transition, International Journal of Applied and computational Mathematics (Springer), International Journal of Productivity and Performance Management (Emerald), Benchmarking (Emerald), Pakistan Journal of Statistics and Operation Research to name a few.

Pooja Maurya is a research scholar in the Department of Statistics, Banaras Hindu University (BHU), Varanasi. She holds a Master’s degree in Statistics and is currently pursuing research in the field of sampling theory. Her work focuses on developing innovative methodologies and techniques within sampling theory, contributing to advancements in the domain.
Journal of Reliability and Statistical Studies, Vol. 17, Issue 2 (2024), 417–434.
doi: 10.13052/jrss0974-8024.1728
© 2025 River Publishers