Multi-objective Reliability-Oriented Optimal Energy and Reserve Management in Renewable-based Microgrids in Presence of Demand Response Programs
Ehsan Bazgir, Abouzar Samimi* and Abolfazl Salami
Department of Electrical Engineering, Arak University of Technology, Arak, Iran
E-mail: abouzarsamimi@alumni.iust.ac.ir
*Corresponding Author
Received 19 November 2024; Accepted 08 March 2025
Abstract
As utilization of renewable energy sources (RESs) and microgrids (MGs) grow, assessing their reliability becomes crucial in smart grid studies. This paper introduces a novel method for evaluating MG reliability in both islanded and grid-connected modes, addressing optimal energy and reserve management in renewable-based MGs. The introduced model is formulated as a multi-objective problem aimed at enhancing reliability while minimizing operating costs, incorporating various price-based (PB) and incentive-based demand response programs (DRPs). The presented framework is tested on a typical MG and to solve it, two multi-objective optimization techniques including Non-Dominated Sorting Genetic Algorithm-II (NSGA-II) and Multi-Objective Particle Swarm Optimization (MOPSO) are used. Results indicate the effectiveness of proposed method in evaluating reliability and improving examined reliability indices.
Keywords: Microgrid, demand response programs, renewable generations, energy and reserve management, reliability, multi-objective optimization.
Nomenclature
| Abbreviation | |
| MG | Microgrid |
| DG | Distributed Generation |
| DER | Distributed Energy Resource |
| ESS | Energy Storage System |
| FC | Fuel Cell |
| RES | Renewable Energy Sources |
| LOLP | Loss of Load Probability |
| EENS | Expected Energy Not Supplied |
| MOPSO | Multi-Objective Particle Swarm Optimization |
| NSGA-II | Non-Dominated Sorting Genetic Algorithm-II |
| DRP | Demand Response Program |
| MCS | Monte Carlo simulation |
| PV | Photovoltaic |
| WT | Wind Turbine |
| DR | Demand Response |
| Probability Distribution Function | |
| PBDRP | Price-based Demand Response Program |
| TOU | Time-of-Use |
| RTP | Real-Time Pricing |
| CPP | Critical Peak Pricing |
| I/C | Interruptible/Curtailable |
| Indices, Parameters and Variables | |
| t | Time period index from 1 to T |
| i | DG index from 1 to I |
| j | ESS index from 1 to J |
| Event index | |
| S | Set of possible loss of load events due to uncertainties in the load, wind, and solar generations and/or unit outages |
| Normal PDF of load demand ( | |
| Weibull PDF of wind speed (v) | |
| Beta PDF of the solar irradiation () | |
| Active power of load demand | |
| and | Standard deviation and mean values of load demand, respectively |
| Wind speed | |
| k and c | Shape factor and scale factor of Weibull PDF of wind speed |
| WT output power | |
| Rated power of a WT | |
| Rated wind speed of a WT | |
| and | Cut-in and the cut-out wind speed, respectively |
| Irradiation level in kWh/m | |
| Weighting factor of the Beta PDF | |
| and | Shape factors of the Beta PDF |
| and | Scale factors of the Beta PDF |
| Output power of PV unit | |
| Efficiency of the PV panel | |
| Total panel area of the PV unit | |
| Total costs of generation | |
| Total costs of reserve | |
| Cost of reliability (EENS) | |
| LOLP of period t | |
| Maximum acceptable LOLP at period t | |
| Cost function coefficients of DG i-th | |
| and | Active power and reserve provided by DG i-th in period t, respectively |
| A binary variable shows the on/off state of DG i-th in period t | |
| A binary variable which becomes 1 if DG i-th starts up during period t and 0, otherwise. | |
| Start-up cost of DG i | |
| Hourly cost of ESS j-th in $/h | |
| Energy price of market in period t in $/kWh | |
| and | Power and reserve purchased from the upstream grid in period t, in turn. |
| Reserve price of the upstream grid in period t | |
| Reserve price of DG i-th in period t | |
| Value of lost load | |
| Charging/discharging power of ESS j-th at period t | |
| Maximum permittable charge/discharge limit of ESS j-th | |
| Charging/discharging efficiency of ESS j-th | |
| Energy stored in the ESS j-th until period t | |
| Probability of event s in period t | |
| Power curtailment in event s and period t | |
| Reserve curtailment in event s and period t | |
| Total reserve provided by DGs at period t ( | |
| A binary variable determining the status of loss of load | |
| EENS caused by uncertainties related to WT, PV and load demand along with i-th order outage events () | |
| Probability of l-th load demand interval at period t | |
| Load demand deviation (or forecast error) at time t when load falls in interval l-th | |
| Probability of k-th interval of WT power at period t | |
| Total WT power deviation (or forecast error) at time t when wind speed is in interval k-th | |
| Probability of m-th interval of PV power at period t | |
| Total PV power deviation (or forecast error) at time t when wind speed is in interval m-th | |
| Probability that all dispatchable DG units are in service during period t | |
| Probability of only outage of DG i | |
| Probability of simultaneous outage of DGs i and j during period t | |
| State number of WT unit | |
| Total number of equivalent states of WT | |
| and | Probability of interval for the WT and PV , respectively |
| Total number of equivalent states of PV | |
| NS | Total number of system states |
| Total number of decreased states after integrating similar states | |
| Number of occurrence times of state i in the system | |
| A binary variable indicating the loss of load in system state i-th based on the amount of load curtailment | |
| The amount of load curtailment at state i-th | |
| Duration of interruption at state i-th | |
| Initial load demand in period t | |
| Load demand after running of TOU/RTP programs in period t, respectively | |
| load consumption after running the CPP program at period t | |
| Adjusted load after implementing all BPDRPs | |
| Price elasticity of demand in period t with respect to and period k | |
| Initial price at period k | |
| (k) | Electricity tariff of DRPs at period k |
| () | Percentage of load participation in TOU and RTP programs, respectively |
| Percentage of consumers’ contribution in the CPP program | |
| Temperature at period t | |
| Incentive paid to the loads at period t for each kWh load reduction | |
| Percentage of load reduction in period t | |
| Contract level for t-th period | |
| Penalty cost for t-th period | |
1 Introduction
1.1 Background
The shift towards renewable energy sources (RES), particularly wind and solar, has been motivated by the rising consumption of conventional energy sources and a growing awareness of the environmental consequences associated with traditional energy systems. Nonetheless, the inherent variability and unpredictability of RES present challenges to their reliability within electrical networks (Ahmadpour et al., 2021). In the 21st century, the emerging concept of the smart grid has evolved into a promising solution for addressing future challenges. Microgrids (MGs), low-voltage sections of distribution systems with Distributed Energy Resources (DERs), are one of the important features of the smart grid. Renewable-based MGs need the requisite level of reliability due to the intermittent nature of RES (Sakthivelnathan et al., 2024b). Even MGs that have a significant installed capacity for RES such as photovoltaic (PV) and wind turbines (WT) face reliability challenges. To address the risk of insufficient power supply stemming from the variability of renewable resources, an acceptable level of reserve as well as energy storage systems (ESS) should be incorporated into MGs.
One way to enhance the reliability of distribution networks is by minimizing the recovery time after an error occurs. Integrating distributed generation (DG) units into these networks can substantially decrease the duration of outages, thereby lowering the outage index (r) at load points and improving overall network reliability (Liu et al., 2020). ESS play a vital role in enhancing load balance by mitigating the impact of unpredictable spikes in renewable energy production (Wang et al., 2021). Compact battery energy storage systems (BESS) are essential for stabilizing the inconsistent output from RES. Generally, the emergence of DG based on renewable energy units necessitates the incorporation of large-scale distributed ESS to enhance grid flexibility and effectively address the fluctuations and uncertainties associated with renewable power plants (Dejamkhooy and Ahmadpour, 2022). Utilizing quick-response energy sources, such as hydroelectric and natural gas turbines, can mitigate the output uncertainty of extensive renewable energy facilities. Implementing large-scale ESSs for energy balancing within power grids will lead to greater grid reliability. Additionally, following a fault in the grid, ESS can assist in restoring power in areas cut off from the main substation or in regions reconnected to nearby feeders with limited transmission capacity through emergency connections.
The evaluation of reliability in traditional power systems has been extensively researched. However, assessing reliability concerning DERs and ESS represents a relatively new research domain. Additionally, assessing reliability for a completely renewable energy- MG is a vital area of investigation, with several researchers suggesting various alternative methodologies (Rathore and Patidar, 2019; Riou et al., 2021).
1.2 Literature Review
MGs are increasingly popular because they can integrate a variety of independent energy sources, including micro-turbines (MTs), fuel cells (FCs), and renewable sources such as WTs and PV systems. This blend of energy resources enhances the resilience and flexibility of energy systems in localized regions (Dejamkhooy and Ahmadpour, 2021). Many studies have focused on battery capacity to assess the role of energy storage in grid areas affected by islanding operations (Sarableh et al., 2022). However, existing models often overlook critical factors such as the timing and charging processes, battery discharge and failure rates during faults, and time-varying changes in production and demand when evaluating reliability indices. To enable a thorough quantitative impact assessment, a more detailed probabilistic multi-state model of the battery is employed, utilizing an analytical approach that reflects real-world conditions. The study concludes by evaluating reliability indicators, comparing the results of the analytical technique for assessing the reliability of both the reservoir and the power plant’s storage pump (Mokaramian et al., 2022). In the study by (Baherifard et al., 2022), an intelligent distribution network organized into multiple MGs is utilized. The modeling incorporates the uncertainties associated with RES, and the final problem is addressed using the intelligent bat algorithm. This optimization aims to minimize the proposed cost-reliability objective function as effectively as possible. Meanwhile, (Xu et al., 2022) introduced a strategy for planning DGs that takes into account the uncertainties linked to RES. Their objective function encompasses costs related to generated and reserved power, as well as fluctuations in unit planning due to varying wind and photovoltaic power behavior. Additionally, this research considers constraints such as electricity market balance, power generation capacity, spinning reserve limits, DR costs, and unit startup expenses.
Gholami et al. (2024) have introduced a model to improve the reliability of MGs that incorporate RES and BESS by assessing their performance across various regulatory frameworks, specifically feed-in tariff (FiT), net metering (NM), and energy storage incentive (ESI). Additionally, a dynamic feed-in tariff (D-FiT) framework is employed to further enhance the MG’s reliability. An artificial bee colony optimization algorithm is applied to determine the optimal size of the BESS under each regulatory policy, aiming to minimize the overall costs of the MG. The study of (Sakthivelnathan et al., 2024a) aims at analyzing the Cost-Effective Reliability Level (CERL). To this end, initially, the reliability of MG is thoroughly assessed by evaluating the availability of equipment and resources every hour. Next, an optimization method for investment costs is applied to establish the necessary installed capacity of RES for different levels of reliability. Then, the cost associated with the Loss of Load Frequency (LOLF) penalty is factored into the EENS cost. Finally, the overall cost is calculated, allowing for the determination of the CERL by integrating these components. To achieve optimal performance in multi-MG (MMG) systems, (Afrakhte and Bayat, 2020) introduced a coordinated energy management strategy. In addition to their reliability analysis, the study proposes an optimization algorithm known as targeted search shuffled complex evolution. This research aims to enhance economic benefits while considering equipment failures and the feasibility of bidirectional energy trading among MGs.
Mobile energy storage systems (MESS) have recently been examined as a solution to improve operational resilience by supplying localized emergency power during power outages. A MESS is a truck-mounted or towable battery storage device that typically has utility-scale capacity. (Chen et al., 2016) proposed a method for assessing the reliability of distribution networks through the use of a MESS. In their study, the MESS was designed to be deployable to a fault-affected area with at least 50% state of charge (SOC). The model also incorporates a traffic component to represent the local transportation conditions.
A significant advancement in road safety is the implementation of solar road studs, which utilize solar energy – an eco-friendly and sustainable power source. These solar-powered LED devices are used in road construction to mark edges and centerlines. (Ram et al., 2021) focuses on assessing the reliability of solar road studs, examining factors such as availability, mean time to failure (MTTF), cost analysis, and sensitivity analysis, all represented graphically using the Markov process. Additionally, the study employs Particle Swarm Optimization (PSO) to optimize the system’s cost. The allocation of reliability for components, along with redundancy and reliability redundancy allocation, plays a crucial role in designing reliable systems. One of the most commonly used methods to achieve high reliability is the cold standby strategy, which employs backup components to ensure that they can effectively take over if the active component fails (Bhandari et al., 2024).
The future power system, characterized by a significant increase in RES, will encounter considerable uncertainties that could impact its operations. Therefore, assessing the uncertainties in system performance within this network is crucial. Traditional operational methods that account for the constraints of electricity and gas networks may not be suitable for distribution networks, such as multicarrier MGs. The previously highlighted challenges in constructing uncertainty sets have led to an increasing trend toward the data-driven development of polyhedral uncertainty sets in recent years. For example, (Saini et al., 2024) introduced a data-driven robust coordination method that addresses the uncertainties inherent in power generation and demand-side factors, particularly those related to PV generation. Their approach sought to minimize fuel costs for energy storage units within a two-stage operational framework, utilizing a PV uncertainty forecasting method based on an extreme learning machine (ELM). Another instance is presented by (Sharifpour et al., 2023), who have presented a resilience-focused DR program aimed at improving the use of RESs and other available resources to reduce load shedding during emergencies. Additionally, (Li et al., 2023) developed spatiotemporal correlations in RES generation through historical data series, creating intervals that captured correlations between data points for days with similar RES output characteristics. While this methodology enhanced reliability, its dependence on the quantity of historical data could affect the reliability and convergence when solving robust dispatch models (Ji et al., 2023). (Hai et al., 2023) have introduced an innovative approach for formulating the problem of cost-effective reliability, proposing solutions for reducing MG costs through the utilization of electric and hybrid vehicles and the optimal planning of MGs. (Chen et al., 2021) have introduced an efficient and practical multi-objective optimization model for the optimal planning of a connected MG to the main network. This model incorporates uncertainty modeling of RES outputs and leverages probabilistic relationships. It also introduces a customer satisfaction index to evaluate subscriber experiences as costs are reduced and MG reliability improves.
A novel management approach is introduced in the reference authored by (Ali Dashtaki et al., 2023) to enhance the efficiency of a MG connected to the main grid, focusing on reducing overall costs. It accounts for uncertainties in renewable generation units, such as WT and PV, and balances generation and demand through power exchange between the MG and the distribution network. The optimization problem aims to minimize the total cost of efficiency, optimize MG planning, and improve the voltage profile. (Abdulgalil Mohammed and Khalid, 2019) have suggested a method aimed at enhancing MG reliability through the integration of an ESS, employing a mixed-integer linear programming approach to determine the optimal size of ESS for MG connected to the main grid. The reliability of the power system is defined as its ability to meet load demands under normal operations and during faults, such as power transmission line failures. The development of a model has been explored in (Zhong et al., 2020) based on the failure rates of power electronic devices to assess the reliability of islanded MGs with high renewable energy penetration. The innovation here is the consideration of variable failure rates across electronic power equipment. (Adefarati and Bansal, 2019) have focused on minimizing energy supply costs, annual load losses, and greenhouse gas emissions in MGs by calculating reliability indices using probabilistic relationships and employing the “fmincon” optimization tool in MATLAB to analyze the environmental and economic effects of RES. In the research done by (Gholami et al., 2023), the integration of ESSs with RESs is recommended to enhance MG reliability. However, choosing the right capacity for ESS is crucial to avoid overestimating reliability and operational costs. The goal is to find the optimal size and type of ESS to boost MG reliability. Traditional reliability improvement strategies is discussed by (Escalera et al., 2018) for distribution networks, including mesh networks, efficient asset management, use of reliable components, and additional protective devices. It also reviews methods for assessing reliability in distribution and MG networks. In (Hariri et al., 2020), a new analytical reliability assessment method for smart grids is presented. The proposal of a new method based on partitioning concepts and graph theory to create various states of the smart grid is an efficient solution. One of the most significant advantages of this reference is the development of a new generalized mathematical model for generating the state matrix based on the discretization of the uncertain elements’ states. In (Zhang et al., 2016), a set of reliability measurement parameters for islanded MGs is proposed. This article introduces a two-stage Monte Carlo simulation (MCS) method to evaluate the reliability and cost-effectiveness of MGs equipped with various distributed generation units. It identifies DRPs as effective solutions to mitigate the impact of uncertainty in power generation capacity on the reliability of active MGs.
1.3 Contribution and Paper Organization
By reviewing the studies and research conducted in this section, it seems that carrying out a comprehensive study on a MG based on the RES, aimed at minimizing operational costs and maximizing its reliability while considering different types of DRPs could provide a more efficient strategy for the operation of MGs. In this paper, with the goal of improving the reliability at the lowest cost, an optimal energy and reserve management in renewable-based MGs is studied. To evaluate all intermittency associated with solar and wind, the MG reliability is evaluated using both analytical method and MCS. The MCS has been conducted with 1000 times simulations for each scenario to assess the reliability of the MG in an accurate and practical way. In line with this purpose, in this paper, a multi-objective optimization-based analytical model is presented to evaluate the reliability and optimize the energy and reserve scheduling in a MG in both islanded and grid-connected modes. The simultaneous scheduling of energy and reserves is modeled with the aim of minimizing operational costs and maximizing reliability indices in the presence of RES and DRP programs. In the proposed model, the uncertainties associated with wind and solar resources, as well as the demand load, are considered simultaneously. The proposed model is designed and formulated based on a scenario-driven approach and an analytical model. MCS validates the model’s accuracy in calculating EENS and LOLP. The proposed optimization model is solved using two multi-objective techniques including NSGA-II and MOPSO algorithms.
The key innovations of this paper can be summarized as follows:
• Analytical model and a MCS are presented for evaluating the reliability of a MG in both grid-connected and islanded modes.
• A multi-objective optimization model is developed for simultaneous energy and reserve scheduling in the MG, aimed at minimizing operational costs and improving the reliability of the MG.
• Uncertainties in renewable resources and demand loads are considered using a scenario-based approach.
• Price-based (PB) and incentive-based DRPs are incorporated in the proposed model.
The following sections of the article are presented as follows:
In Section 2, modeling of uncertainties associated with wind and solar resources, as well as load is presented. Section 3 outlines the proposed problem formulation. Section 4 scrutinizes the modeling of DRPs. Section 5 presents and analyzes the simulation results and finally the conclusions are outlined in Section 6.
2 Uncertainty Modeling
Here, the uncertainties related to the active power generation of WT and PV units as well as the demand load are taken into consideration. To create the desired scenarios, the first step involves modeling the uncertainties of the power generation values of WT and PV units, along with the demand load based on the corresponding Probability Density Functions (PDFs) derived from the forecasting errors.
2.1 Probabilistic Load Model
Owing to inaccuracies in load forecasting in the operation and planning studies of power systems, the load is considered a non-deterministic parameter. In majority of studies in the power systems, the load demand forecasting error is modeled using a normal PDF as Equation (1) in which the mean value is set equal to the predicted load value. Moreover, a certain percentage of the predicted value is taken into account as the standard deviation (Samimi et al., 2017). In this paper, the normal PDF is supposed to be discretized to L intervals.
| (1) |
2.2 Probabilistic Wind Model
The power output of a WT is determined by the wind speed. Wind speed at a specific location can be characterized as a Weibull distribution function (Samimi et al., 2017). In this paper, the hourly average wind speed prediction is modeled using the Weibull PDF, as formulated in Equation (2) (Firouzi et al., 2022):
| (2) |
The PDF curve defined by Equation (2) is divided into K equal intervals, each one portraying a distinct scenario of wind power. To generate scenarios for the output power of a WT, the wind speed values are incorporated into the transformation function which converts the wind speed to the produced active power. Here, a linear transformation function has been utilized for the conversion of wind speed to power, as illustrated in Equation (3) (Nikzad and Samimi, 2020):
| (3) |
2.3 Probabilistic PV Model
The output of PV units is closely tied to the intensity of solar irradiation. At a particular location, the distribution of hourly solar irradiation is essentially in accordance with a bimodal PDF expressed by a linear combination of two unimodal distribution functions (Firouzi et al., 2022). In this study, a Beta PDF has been applied for each unimodal, and accordingly, the double Weibull PDF has been utilized to model the uncertainty of the solar irradiance as described in Equation (2.3):
| (4) |
Similar to the wind speed PDF, the irradiation PDF can also be discretized into M intervals. By adopting the irradiation-to-power conversion function while taking into account the irradiation distribution, the PDF of PV power can be extracted. The conversion function employed for transforming irradiation into power is given as follows (Bahramirad et al., 2012):
| (5) |
3 Problem Formulation
Due to the uncertainty of RES, the optimal operation of a MG necessitates the estimation of required reserve. Nevertheless, it is not easy to make a realistic prediction of the amount of optimal reserve in MGs. An analytical model is utilized to tackle this issue in MGs. In this approach, the necessary reserve is determined by a compromise between reliability indices and operational costs. The MG that can be operated by connecting the upstream distribution network, has renewable, non-renewable DERs and ESS. In order to alleviate the effects of uncertainties and fluctuations corresponding to renewable generations on providing the required energy for load demand, several measures including the use of ESS, reserve, DRP, and ultimately load curtailment as the last and the most expensive solution have been adopted. As a result, the mathematical model incorporates the operational costs encompassing the production costs of generating units, reserve cost, cost associated with running DRPs, and ultimately, the cost for load curtailment integrated into a cost objective function. The objective function of the proposed model comprises two main components: cost and Loss of Load Probability (LOLP) index. Cost includes total expenses of generation (), reserve () and EENS as an important reliability index, defined by . Thus, the proposed model is defined as a multi-objective optimization problem as follows:
| (6) |
where:
| (7) | ||
| (8) | ||
| (9) | ||
| (10) |
It is assumed that all the power produced by the WTs and PV units is purchased from them at a regulated price. It should be noted that WTs and PVs do not participate in providing reserve. The objective functions must be optimized subject to the active power balance constraint and a number of constraints, as follows:
| (11) |
The constraints of an ESS:
| (12) | |
| (13) | |
| (14) |
3.1 Evaluation and Calculation of Reliability Indices
Hence, this section begins by providing evaluation of EENS and LOLP indices using the analytical approach, followed by an exploration of how they are computed using the Monte Carlo method.
3.1.1 Analytical assessment method
The two critical reliability indices employed in this paper are EENS and LOLP. These indices are chosen due to the uncertainties existing in RES, load variations, and the possibility of generation unit outages. These two indices are calculated as follows (Wang and Gooi, 2011):
| (15) | |
| (16) |
In Equations (15) and (16), S represents the set of possible loss of load events due to uncertainties in the load, wind, and solar generations and/or unit outages. is a binary variable determining the status of loss of load is defined as follows:
| (17) |
Considering the low probability of load curtailment originating from outage events of third and higher order, EENS can be formulated as follows:
| (18) |
where, is EENS caused by uncertainties related to WT, PV and load demand along with i-th order outage events. According to Equation (15), are computed as follows (Wang and Gooi, 2011):
| (19) | ||
| (20) | ||
| (21) |
can be expressed as:
| (22) |
and can be formulated in the same way.
On the other hand, according to Equation (16), is given by:
3.1.2 Evaluation using the Monte Carlo method
Typically, two main stages in reliability assessment using the MCS involve scenarios generation representing different system states and evaluation of these states. To this end, assuming as a generated random number, the output state of the WT is determined as follows:
| (24) |
Similarly, for PV panels, we have:
| (25) |
Accordingly, an array of numbers is derived to specify the random scenarios of the system consisting of multiple states for RES along with binary states (success and failure) for other devices including dispatchable DGs. Each element of this array corresponds to one of the system’s generation units. For instance, if a WT has five operational states, the respective array element will take an integer number between 0 and 4. It is evident that for non-renewable resources only two values, 0 or 1, can be assigned, where 0 signifies failure whereas 1 signifies success or “in service” status.
After generating a sufficient number of random arrays, each of these arrays is evaluated in terms of total generated power. Should the total load demand of the MG be less than the total generated power, this state and the corresponding probability are not considered in the load curtailment states. Conversely, if this state cannot meet the load demand, the amount of load not-supplied and its probability are recorded. At the end of this process, by considering the probabilities of the states in which loss of load occurs, the probability of loss of load is calculated. Then, by using the probability of each state associated to loss of load and duration of the corresponding outage, the EENS is determined. Accordingly, the LOLP and indices for each period can be assessed as follows:
| (26) | |
| (27) | |
| (28) |
4 Demand Response (DR) Programs
DRPs are essentially categorized into two main types: price-based DRPs (PBDRP) and incentive-based DRPs.
4.1 PBDRPs
Time-of-Use (TOU), Real-Time Pricing (RTP) and Critical Peak Pricing (CPP) are three main price-based DRPs. The TOU and RTP programs follow a same relationship as presented in Equation (29). The difference between these two programs lies in the pricing structure . In the TOU program, a three-level tariff is implemented, distinguishing between low, off-peak, and peak periods. Conversely, the RTP program adjusts a tariff using an hourly basis.
| (29) |
To design the DRPs, the amount of the hourly tariff and the percentage of the consumers’ participation in DRPs should be determined.
Moreover, to model the effect of CPP on consumer electricity consumption, the consumption of users is considered as a function of temperature and price, utilizing the Cobb-Douglas function, as follows:
| (30) |
and are fixed coefficients. As a result, the adjusted load after implementing all PBDRPs will be derived from the following equation:
| (31) |
4.2 Incentive-based DRPs
Incentive-based DRPs are defined as voluntary programs that encourage consumers to cut or reduce their electricity usage during peak periods, in return for receiving incentives from the service provider. Interruptible/Curtailable (I/C) service is one of the incentive-based DRPs in which customers enrolled in this program reduce consumption for incentive benefits. However, penalty is considered in this program for consumers in case of no responding to load reduction. Therefore, the cost of running I/C program (, including incentive and penalty is considered as given by Equation (32) (Aalami et al., 2010).
| (32) | |
| (33) |
It should be noted that if a consumer who has been enrolled in the I/C-DRP does not commit to his obligations based on the contract, he is faced with penalty. Thus, the needs to be integrated into the optimization model as given below:
| (34) |
In order to solve the proposed model, the NSGA-II algorithm and MOPSO are implemented.
5 Simulation Results and Discussion
As depicted in Figure 1, a typical MG comprising a MT, a PV unit, a FC, a WT, and an ESS has been used to examine the proposed model. Using the scenario-based method explained in Section 2, the uncertainties of load, wind and irradiation are modeled. Here, the PDFs related to load demand, wind generation and PV output power are supposed to be discretized to seven, five and five intervals, respectively. The scenarios pertaining to load, WT and PV output power generation are depicted in Figures 2–4, respectively.
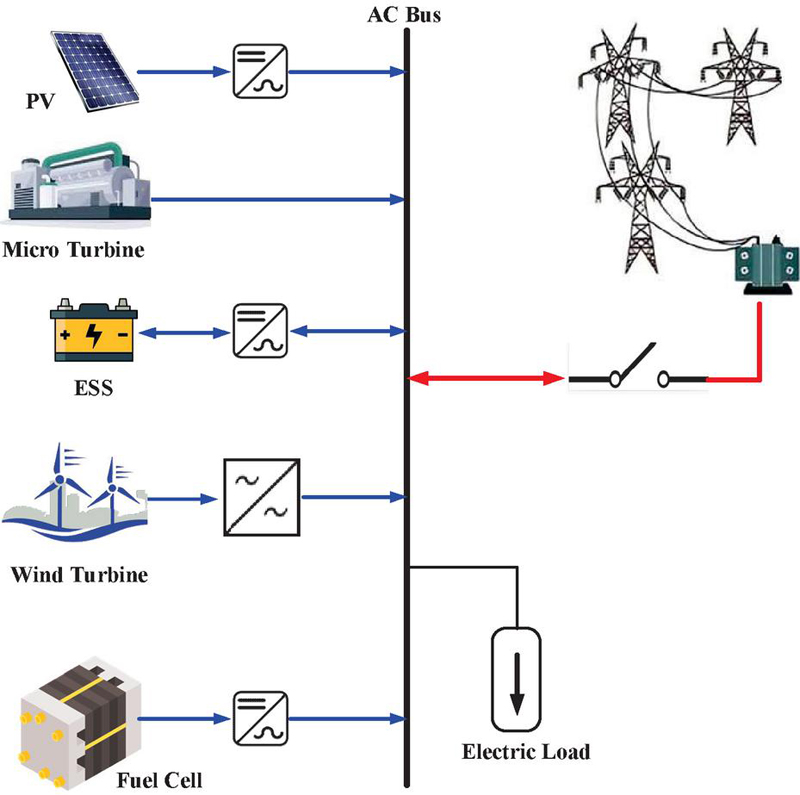
Figure 1 Illustration of the MG structure.
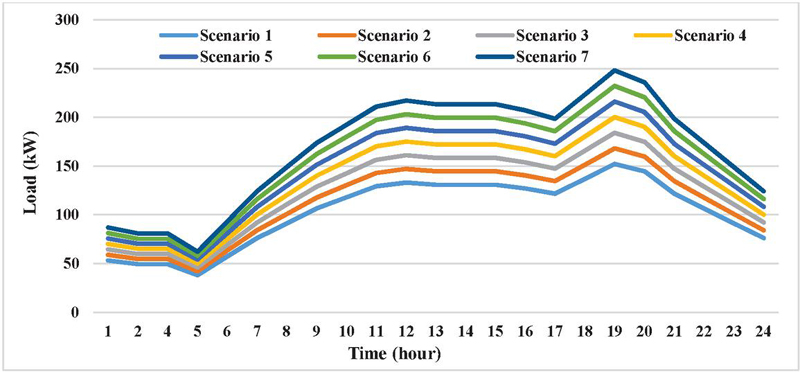
Figure 2 Seven load scenarios during 24 hours.
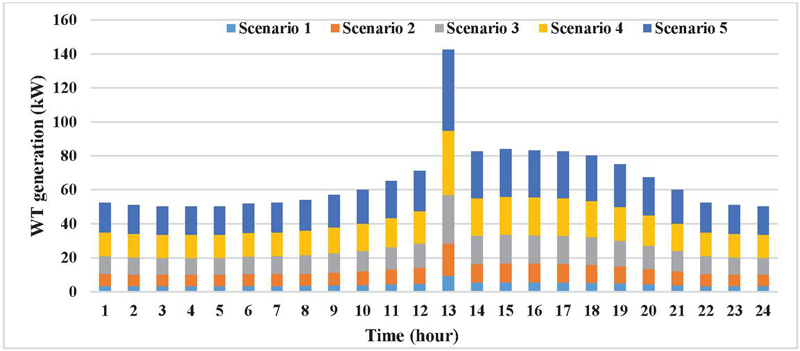
Figure 3 Five scenarios for wind generation during 24 hours.
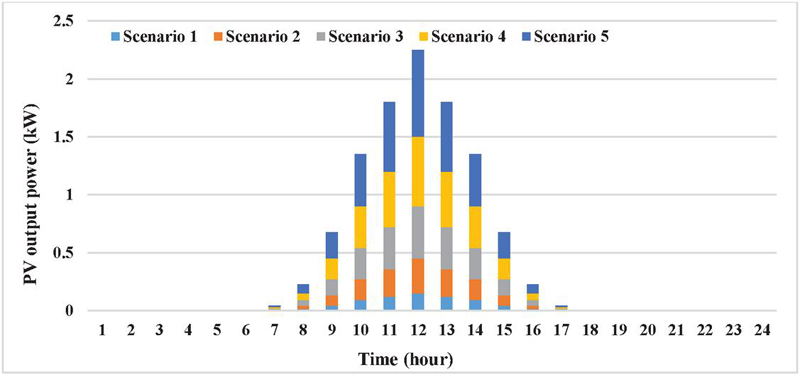
Figure 4 Five scenarios for PV generation during 24 hours.
The corresponding probabilities of all scenarios related to the load, WT and PV output power are listed in Table 1.
The hourly prices of energy purchased from upstream grid are illustrated in Figure 5.
Table 1 Probabilities of load, wind and PV power generations
| Scenario | Probability of | Probability of | Probability of |
| Number | Load Scenarios | Wind Scenarios | PV Scenarios |
| 1 | 0.00595 | 0.18171 | 0.11809 |
| 2 | 0.06029 | 0.37221 | 0.27875 |
| 3 | 0.24069 | 0.28512 | 0.28398 |
| 4 | 0.38254 | 0.12401 | 0.19264 |
| 5 | 0.24069 | 0.03348 | 0.11971 |
| 6 | 0.06029 | – | – |
| 7 | 0.00595 | – | – |
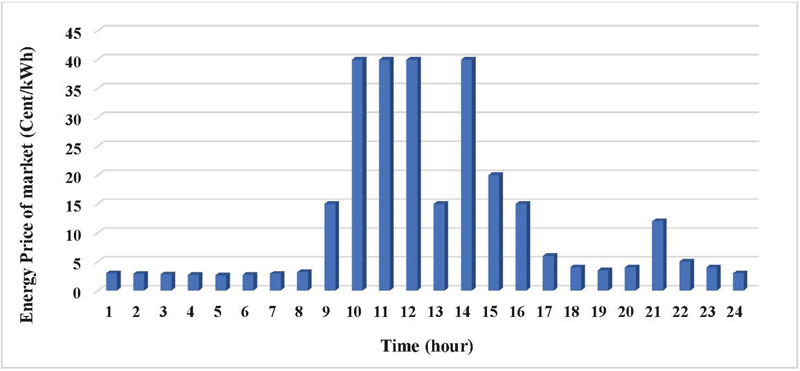
Figure 5 Hourly energy prices of the upstream market.
The techno-economic data of the generation units are provided in Table 2. According to Table 2, negative values for the upstream grid and the ESS denote selling power to the upstream grid and charging of the ESS, respectively. For the ESS, , and . VOLL is assumed to be 100 $/kWh. The cost of reserve provided by a DG ( in Cent/kWh) is priced at a rate equal to the 25% of generation cost of the corresponding DG unit. The maximum LOLP in each period is assumed to be 0.05.
Table 2 Techno-economic data of the generation units and ESS
| Generating | Minimum | Maximum | Failure | |||
| Units | Power (kW) | Power (kW) | Rate (f/year) | Cost Coefficient | (Cent) | |
| Upstream grid | 100 | 190 | 0.002 | 0 | Shown in Figure 5 | 0 |
| ESS | 20 | 20 | 0.002 | (Cent/h) | - | 0 |
| PV | 0 | 70 | 0.002 | (Cent/kWh) | 0 | |
| WT | 0 | 80 | 0.002 | (Cent/kWh) | 0 | |
| FC | 0 | 100 | 0.002 | (Cent/h) | (Cent/kWh) | 53 |
| MT | 30 | 150 | 0.002 | (Cent/h) | (Cent/kWh) | 45 |
The initial price for consumers in all periods ( is 15 Cent/kWh. The TOU, RTP and CPP tariffs are displayed in Figure 6. The values of elasticities are given in (Nikzad and Samimi, 2020).
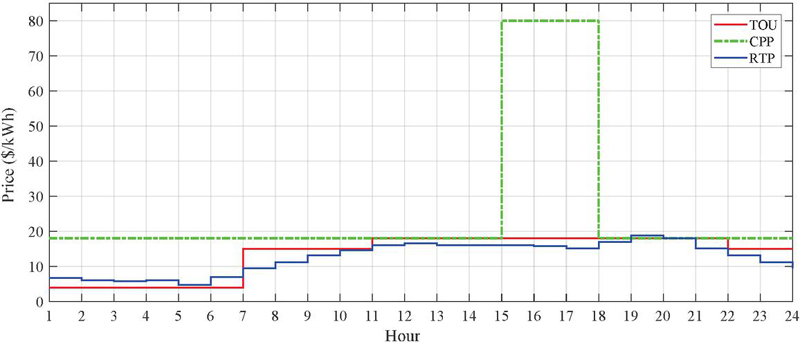
Figure 6 TOU, CPP, RTP tariffs.
In order to analyze the efficiency of the proposed method, four different cases are conducted as described in the following:
Case 1: Simulation with excluding DRPs in the grid-connected mode.
Case 2: Simulation with a 5%-participation of loads in only PBDRPs in the grid-connected mode.
Case 3: Simulation with a 10%-participation of loads in the PBDRPs and considering I/C program in the grid-connected mode.
Case 4: Simulation with a 10%-participation of loads in the price-based DRPs and considering I/C program in the isolated mode.
To evaluate the accuracy of the analytical method described in Section 3.1.1, the results of the MCS have been assessed alongside the analytical method for each case study. For the MCS, approximately 1000 simulations provide sufficient accuracy for evaluation. On the other hand, the computation time for the Monte Carlo method is significantly longer. However, this method has been utilized solely to demonstrate the accuracy of the analytical model.
Case 1: In this case, the total cost amounts to 43,303 and 48,631 cents obtained by the MOPSO and NSGA-II, respectively, while LOLP is 0.0169 for both algorithms. The total cost and reliability indices in case 1 using the MOPSO and NSGA-II algorithms are listed in Table 3.
Table 3 Optimization results in case 1
| EENS (kWh) | LOLP | ||||
| Optimization | Cost | Monte | Analytical | Monte | Analytical |
| Technique | (Cent) | Carlo | Assessment | Carlo | Assessment |
| MOPSO | 43,303 | 0.0130 | 0.0126 | 0.0171 | 0.0169 |
| NSGA-II | 48,631 | 0.0168 | 0.0162 | 0.0177 | 0.0169 |
By comparing the results obtained by the MOPSO and the NSGA-II, the simulation results of case 1 based on the MOPSO are far better compared to the NSGA-II. In addition, the reliability indices obtained based on the analytical method are slightly better than the indices obtained using the Monte Carlo method. This confirms the accuracy and verification of the analytical method for calculating reliability indices. Furthermore, optimal power and reserve scheduling of generation units based on the MOPSO are shown in Figures 7 and 8, respectively.
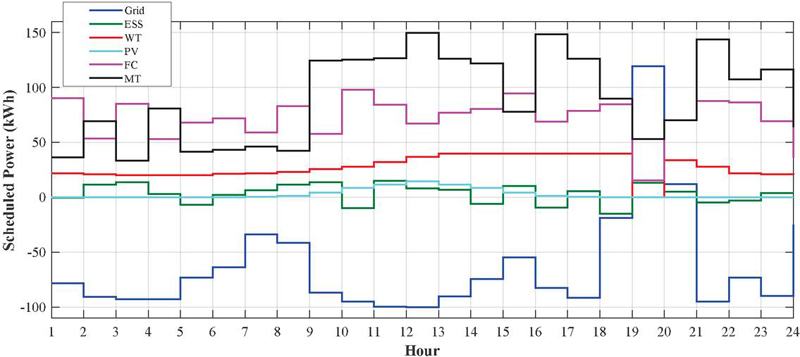
Figure 7 Hourly scheduled power of generation units using MOPSO.
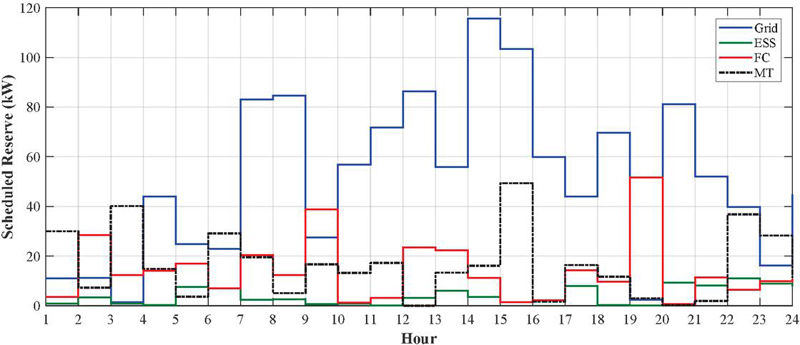
Figure 8 Hourly scheduled reserve of dispatchable generation units using MOPSO.
Case 2: Three patterns including non-interruptible loads, I/C loads and shiftable loads are the components that describe the total load demand of the network. In this case study, the shiftable load is shifted through three PBDRPs: TOU, RTP, and CPP. In this case, the participation level of loads in the price-based DRPs is considered as 5%. In the first case study, it is assumed that the price paid by the loads to meet electricity demand is fixed for all periods (15 Cent/kWh). However, in case 2, the loads participate in PBDRPs with variable tariffs over the time horizon. Table 4 shows the cost of consuming electricity by applying only TOU, RTP and CPP tariffs without running DRPs and after implementing these programs. It is worth mentioning that the cost of energy consumption before the implementation of the DRPs is calculated by multiplying the hourly consumption initial load demand by the amount of the tariff for the same hour. On the other words, the effect of elasticity coefficients and load shift is not taken into consideration. It is observed that the highest cost paid by consumers will be with the RTP tariff, while the lowest amount will be related to the CPP tariff.
Table 4 Comparison of the cost of consuming electricity by loads before and after implementation of the BPDRPs (participation level is 5%)
| Cost of Consuming Electricity by Loads (Cent) | ||
| BPDRP | Before Running DRP | After Running DRP (By Load Shift) |
| TOU tariff | 737 | 671 |
| RTP tariff | 805 | 775 |
| CPP tariff | 585 | 345 |
Table 5 Optimization results in case 2
| Optimization Technique | Cost (Cent) | EENS (kWh) | LOLP |
| MOPSO | 42,570 | 0.0115 | 0.0153 |
| NSGA-II | 46,562 | 0.0117 | 0.0154 |
The simulation results including reliability indices are reported in Table 5. As it can be seen, the participation of 5% of loads in three BPDRPs improves the cost objective function and reliability indices significantly. It is worth be mentioning that the reliability indices are obtained by analytical assessment method. By applying DRPs to 5% of MG load, EENS and LOLP improve about 9% and 10%, respectively.
Case 3: In this case study, the participation level of loads in the BPDRPs is considered as 10%. Subsequently, the updated load reduced during the optimization process under I/C program to assess the impact of these DRPs on the reliability indices. The cost of consuming electricity by loads by applying TOU, RTP and CPP tariffs without running DRPs and after implementing these programs is presented in Table 6. It can be clearly seen that similar to case 2, the cost of loads prior to their participation in the DRPs are higher than after running these programs.
Table 6 Comparison of the cost of consuming electricity by loads before and after implementation of the BPDRPs (participation level is 10%)
| Cost of Consuming Electricity by Loads (Cent) | ||
| BPDRP | Before Running DRP | After Running DRP |
| TOU tariff | 1460 | 1373 |
| RTP tariff | 1609 | 1550 |
| CPP tariff | 1168 | 690 |
In case 3, the total cost function value is obtained as 58713 cents using the MOPSO algorithm and 51397 cents using the NSGA-II technique. This is mainly because, the is included in the optimization model. Additionally, as reported in Table 7, the EENS is computed to be 0.002 kWh and 0.003 kWh using the MOPSO algorithm and the NSGA-II algorithm, in turn. This means that by adopting I/C program, reliability indices have improved significantly in the face of increasing costs.
Table 7 Comparison of the optimization results of case 2 and case 3
| 5%-participation of Loads in the BPDRPs (Case 2) | With I/C Program and 10%-participation of Loads in the BPDRPs (Case 3) | |||
| Optimization Technique | Cost (Cent) | EENS (kWh) | Cost (Cent) | EENS (kWh) |
| MOPSO | 42,570 | 0.0115 | 58713 | 0.002 |
| NSGA-II | 46,562 | 0.0117 | 51397 | 0.003 |
Figure 9 shows the LOLP at each hour based on the two optimization algorithms.
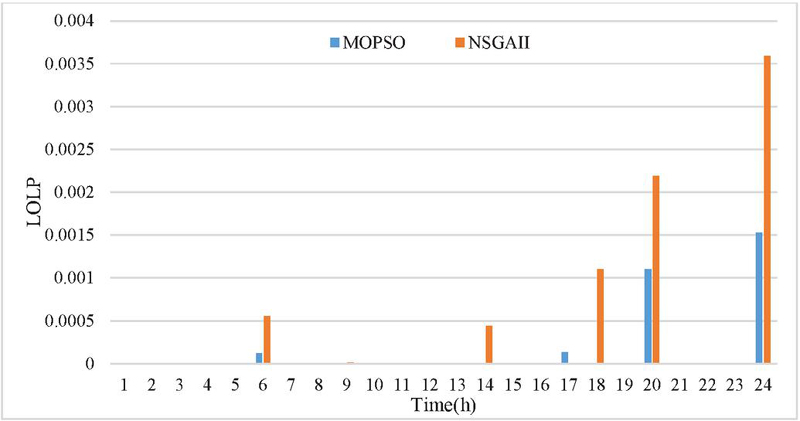
Figure 9 LOLP obtained by the MOSPO and the NSGA-II in case 3.
Case 4: The total cost function in this case is obtained as 61356 and 62108 cents using the MOPSO algorithm and the NSGA-II, respectively. Additionally, the EENS using the MOPSO and NSGA-II approaches is calculated as 1.1395 kWh and 2.1896 kWh, respectively.
Comparing the results of cases 3 and 4 shows that the lack of access to the main grid energy in the operation of the MG in the islanded mode will lead to a lack of energy to supply the loads. As a result, this has led to an increase in the EENS index, which indicates a decrease in the reliability level of the MG. At the same time, the implementation of I/C program has resulted into an increase in the operating cost of the MG.
6 Conclusion
In this paper, a novel method for assessing the reliability of MGs in both islanded and grid-connected modes was presented based on the analytical method and the MCS. In the presented framework, the effects of power generation fluctuations caused by renewables and the corresponding uncertainty on the reliability of energy supply for consumers were taken into consideration. The proposed model was formulated as a multi-objective problem where objective functions consist of enhancing reliability and minimizing costs in renewable-based MGs. The operational cost encompasses the production costs of generating units, reserve cost, costs associated with running DRPs, and ultimately, the cost for load curtailment integrated into a cost objective function. Time-of-Use (TOU). Critical Peak Pricing (CPP) and Real-Time Pricing (RTP) programs as Price-Based DR as well as incentive-based DRP were incorporated in the proposed model. Loss of Load Probability (LOLP) index was considered as the second objective function. The proposed optimization model is solved using two multi-objective techniques including NSGA-II and MOPSO algorithms. The proposed framework is examined on a typical test MG and the simulation results are evaluated in four different cases simulation results briefly show that:
• By comparing the results obtained by the MOPSO and the NSGA-II, the obtained results by the MOPSO are far better compared to the NSGA-II.
• The reliability indices obtained based on the analytical method are slightly better than the indices obtained using the Monte Carlo method. This confirms the accuracy and verification of the analytical method for calculating reliability indices.
• The participation of responsive loads in the BPDRPs improves the cost objective function and reliability indices.
• Running I/C programs can lead to increasing total cost of the MG. This is mainly because, the is added to the cost objective function. On the other side, by increasing the level of participation of loads in the DRPs, it leads to the further improvement of MG reliability indices.
• The operation of the MG in the islanded has led to an increase in the EENS index and increase in LOLP which indicate a decrease in the reliability level of the MG.
Cost and reliability-based energy, reactive power and reserve management of MGs integrated with electric vehicle charging stations (EVCSs) as well as reliability assessment of multi-carrier energy MGs are potential future works.
Funding
No funding was provided for this research and the whole exercise was fully funded by the researchers.
Competing Interest
The authors declare that they have no known competing financial interests or personal relationships that could have appeared to influence the work reported in this paper.
Acknowledgment
The authors gratefully acknowledge the technical support received from the “Power Quality Lab” of Arak University of Technology.
Data Availability
All data generated or analyzed during this study are included in this article. However, all datasets used during the current study are also available from the corresponding author upon reasonable request.
References
Aalami, H. A., Moghaddam, M. P. and Yousefi, G. R. (2010). Demand response modeling considering Interruptible/Curtailable loads and capacity market programs. Applied Energy, 87(1), 243–250. https://doi.org/10.1016/j.apenergy.2009.05.041.
Abdulgalil Mohammed, A. and Khalid, M. (2019). Enhancing the reliability of a microgrid through optimal size of battery ESS. IET Generation, Transmission & Distribution, 13(9), 1513–1522. https://doi.org/10.1049/iet-gtd.2018.5335.
Adefarati, T. and Bansal, R. C. (2019). Reliability, economic and environmental analysis of a microgrid system in the presence of renewable energy resources. Applied Energy, 236, 1089–1114. https://doi.org/10.1016/j.apenergy.2018.12.050.
Afrakhte, H. and Bayat, P. (2020). A contingency based energy management strategy for multi-microgrids considering battery energy storage systems and electric vehicles. Journal of Energy Storage, 27, 101087. https://doi.org/10.1016/j.est.2019.101087.
Ahmadpour, A., Mokaramian, E. and Anderson, S. (2021). The effects of the renewable energies penetration on the surplus welfare under energy policy. Renewable Energy, 164, 1171–1182. https://doi.org/10.1016/j.renene.2020.10.140.
Ali Dashtaki, A., Mehdi Hakimi, S., Arezoo, H., Derakhshani, G. and Abdi, B. (2023). Optimal management algorithm of microgrid connected to the distribution network considering renewable energy system uncertainties. International Journal of Electrical Power & Energy Systems, 145, 108633. https://doi.org/10.1016/j.ijepes.2022.108633.
Baherifard, M. A., Kazemzadeh, R., Yazdankhah, A. S. and Marzband, M. (2022). Intelligent charging planning for electric vehicle commercial parking lots and its impact on distribution network’s imbalance indices. Sustainable Energy, Grids and Networks, 30, 100620. https://doi.org/10.1016/j.segan.2022.100620.
Bahramirad, S., Reder, W. and Khodaei, A. (2012). Reliability-Constrained Optimal Sizing of Energy Storage System in a Microgrid. IEEE Transactions on Smart Grid, 3(4), 2056–2062. https://doi.org/10.1109/TSG.2012.2217991.
Bhandari, A. S., Kumar, A. and Ram, M. (2024). Hybrid PSO-GWO algorithm for reliability redundancy allocation problem with Cold Standby Strategy. Quality and Reliability Engineering International, 40(1), 115–130. https://doi.org/10.1002/qre.3243.
Chen, H., Gao, L. and Zhang, Z. (2021). Multi-objective optimal scheduling of a microgrid with uncertainties of renewable power generation considering user satisfaction. International Journal of Electrical Power & Energy Systems, 131, 107142. https://doi.org/10.1016/j.ijepes.2021.107142.
Chen, Y., Zheng, Y., Luo, F., Wen, J. and Xu, Z. (2016). Reliability evaluation of distribution systems with mobile energy storage systems. IET Renewable Power Generation, 10(10), 1562–1569. https://doi.org/10.1049/iet-rpg.2015.0608.
Dejamkhooy, A. and Ahmadpour, A. (2021). Optimal UC and economic dispatching with various small energy resources in the micro-grid using IPPOA and IMILP. Energy Reports, 7, 7572–7590. https://doi.org/10.1016/j.egyr.2021.10.124.
Dejamkhooy, A. and Ahmadpour, A. (2022). Prediction and Evaluation of Electricity Price in Restructured Power Systems Using Gaussian Process Time Series Modeling. Smart Cities, 5(3), 889–923.
Escalera, A., Hayes, B. and Prodanoviæ, M. (2018). A survey of reliability assessment techniques for modern distribution networks. Renewable and Sustainable Energy Reviews, 91, 344–357. https://doi.org/10.1016/j.rser.2018.02.031.
Firouzi, M., Samimi, A. and Salami, A. (2022). Reliability evaluation of a composite power system in the presence of renewable generations. Reliability Engineering & System Safety, 222, 108396. https://doi.org/10.1016/j.ress.2022.108396.
Gholami, M., Mousavi, S. A. and Muyeen, S. M. (2023). Enhanced Microgrid Reliability Through Optimal Battery Energy Storage System Type and Sizing. IEEE Access, 11, 62733–62743. https://doi.org/10.1109/ACCESS.2023.3288427.
Gholami, M., Muyeen, S. M. and Abokhamis Mousavi, S. (2024). Optimal sizing of battery energy storage systems and reliability analysis under diverse regulatory frameworks in microgrids. Energy Strategy Reviews, 51, 101255. https://doi.org/10.1016/j.esr.2023.101255.
Hai, T., Alazzawi, A. K., Mohamad Zain, J. and Oikawa, H. (2023). A stochastic optimal scheduling of distributed energy resources with electric vehicles based on microgrid considering electricity price. Sustainable Energy Technologies and Assessments, 55, 102879. https://doi.org/10.1016/j.seta.2022.102879.
Hariri, A.-M., Hashemi-Dezaki, H. and A. Hejazi, M. (2020). A novel generalized analytical reliability assessment method of smart grids including renewable and non-renewable distributed generations and plug-in hybrid electric vehicles. Reliability Engineering & System Safety, 196, 106746. https://doi.org/10.1016/j.ress.2019.106746.
Ji, J., Wang, Z., Zhang, Z. and Liao, W. (2023). Robust reliability-based design approach by inverse FORM with adaptive conjugate search algorithm. International Journal for Numerical and Analytical Methods in Geomechanics, 47(8), 1481–1495. https://doi.org/10.1002/nag.3524.
Li, Y., Han, M., Shahidehpour, M., Li, J. and Long, C. (2023). Data-driven distributionally robust scheduling of community integrated energy systems with uncertain renewable generations considering integrated demand response. Applied Energy, 335, 120749. https://doi.org/10.1016/j.apenergy.2023.120749.
Liu, Y., Guan, X., Li, J., Sun, D., Ohtsuki, T., Hassan, M. M. and Alelaiwi, A. (2020). Evaluating smart grid renewable energy accommodation capability with uncertain generation using deep reinforcement learning. Future Generation Computer Systems, 110, 647–657. https://doi.org/10.1016/j.future.2019.09.036.
Mokaramian, E., Shayeghi, H., Sedaghati, F., Safari, A. and Alhelou, H. H. (2022). An Optimal Energy Hub Management Integrated EVs and RES Based on Three-Stage Model Considering Various Uncertainties. IEEE Access, 10, 17349–17365. https://doi.org/10.1109/ACCESS.2022.3146447.
Nikzad, M. and Samimi, A. (2020). Integration of Optimal Time-of-Use Pricing in Stochastic Programming for Energy and Reserve Management in Smart Micro-grids. Iranian Journal of Science and Technology, Transactions of Electrical Engineering, 44(4), 1449–1466. https://doi.org/10.1007/s40998-020-00342-4.
Ram, M., Bhandari, A. S. and Kumar, A. (2021). Reliability Evaluation and Cost Optimization of Solar Road Studs. International Journal of Reliability, Quality and Safety Engineering, 29(01), 2150041. https://doi.org/10.1142/S0218539321500418.
Rathore, A. and Patidar, N. P. (2019). Reliability assessment using probabilistic modelling of pumped storage hydro plant with PV-Wind based standalone microgrid. International Journal of Electrical Power & Energy Systems, 106, 17–32. https://doi.org/10.1016/j.ijepes.2018.09.030.
Riou, M., Dupriez-Robin, F., Grondin, D., Le Loup, C., Benne, M. and Tran, Q. T. (2021). Multi-Objective Optimization of Autonomous Microgrids with Reliability Consideration. Energies, 14(15).
Saini, V. K., Al-Sumaiti, A. S. and Kumar, R. (2024). Data driven net load uncertainty quantification for cloud energy storage management in residential microgrid. Electric Power Systems Research, 226, 109920. https://doi.org/10.1016/j.epsr.2023.109920.
Sakthivelnathan, N., Arefi, A., Lund, C., Mehrizi-Sani, A. and Muyeen, S. M. (2024a). Cost-effective reliability level in 100% renewables-based standalone microgrids considering investment and expected energy not served costs. Energy, 311, 133426. https://doi.org/10.1016/j.energy.2024.133426.
Sakthivelnathan, N., Arefi, A., Lund, C., Mehrizi-Sani, A. and Muyeen, S. M. (2024b). Energy storage as a service to achieve a required reliability level for renewable-rich standalone microgrids. Journal of Energy Storage, 77, 109691. https://doi.org/10.1016/j.est.2023.109691.
Samimi, A., Nikzad, M. and Siano, P. (2017). Scenario-based stochastic framework for coupled active and reactive power market in smart distribution systems with demand response programs. Renewable Energy, 109, 22–40. https://doi.org/10.1016/j.renene.2017.03.010.
Sarableh, A. M., Khorsandi, A. and Hosseinian, S. (2022, 11-12 May 2022). Performance Evaluation and Determination of Hybrid Battery Energy Storage for Optimal Placement of Virtual Inertia in Island Microgrid. 2022 26th International Electrical Power Distribution Conference (EPDC).
Sharifpour, M., Ameli, M. T., Ameli, H. and Strbac, G. (2023). A Resilience-Oriented Approach for Microgrid Energy Management with Hydrogen Integration during Extreme Events. Energies, 16(24).
Wang, C., Zhang, Z., Abedinia, O. and Farkoush, S. G. (2021). Modeling and analysis of a microgrid considering the uncertainty in renewable energy resources, energy storage systems and demand management in electrical retail market. Journal of Energy Storage, 33, 102111. https://doi.org/10.1016/j.est.2020.102111.
Wang, M. Q. and Gooi, H. B. (2011). Spinning Reserve Estimation in Microgrids. IEEE Transactions on Power Systems, 26(3), 1164–1174. https://doi.org/10.1109/TPWRS.2010.2100414.
Xu, X., Niu, D., Peng, L., Zheng, S. and Qiu, J. (2022). Hierarchical multi-objective optimal planning model of active distribution network considering distributed generation and demand-side response. Sustainable Energy Technologies and Assessments, 53, 102438. https://doi.org/10.1016/j.seta.2022.102438.
Zhang, Y., Wang, R., Zhang, T., Liu, Y. and Guo, B. (2016). Model predictive control-based operation management for a residential microgrid with considering forecast uncertainties and demand response strategies. IET Generation, Transmission & Distribution, 10(10), 2367–2378. https://doi.org/10.1049/iet-gtd.2015.1127.
Zhong, W., Wang, L., Liu, Z. and Hou, S. (2020). Reliability Evaluation and Improvement of Islanded Microgrid Considering Operation Failures of Power Electronic Equipment. Journal of Modern Power Systems and Clean Energy, 8(1), 111–123. https://doi.org/10.35833/MPCE.2018.000666.
Biographies

Ehsan Bazgir received his B.Sc. degree in electrical engineering from Islamic Azad University, Khorram Abad Branch, Iran, in 2005, and M.Sc. degree in power engineering from Arak University of Technology, Arak, Iran, in 2022. He works currently as a researcher. His main research interests are power system studies, optimization and reliability.

Abouzar Samimi received his B.Sc. degree in electrical engineering from Iran University of Science and Technology, Tehran, Iran, in 2004, and M.Sc. degree in electrical engineering (power systems) from K. N. Toosi University of Technology, Tehran, Iran in 2006. He received the Ph.D. degree in power engineering from the Department of Electrical Engineering, Iran University of Science and Technology, in 2016. He is currently an assistant professor at Arak University of Technology, Arak, Iran. His main research interests are smart grids, power system operation, optimization, uncertainty modeling, electricity markets and distribution systems. Dr. Samimi serves as a reviewer for many international journals.

Abolfazl Salami received his B.Sc. degree in electronics engineering from Isfahan University of Technology, Isfahan, Iran, in 1996, and M.Sc. degree in power engineering from Iran University of Science and Technology, Tehran, Iran in 1999. He received the Ph.D. degree in power engineering from the Department of Electrical Engineering, Iran University of Science and Technology, in 2006. He is currently an assistant professor at Arak University of Technology, Arak, Iran. His main research interests are smart grids, power system dynamics and control, electricity markets.
Journal of Reliability and Statistical Studies, Vol. 18, Issue 1 (2025), 69–102.
doi: 10.13052/jrss0974-8024.1814
© 2025 River Publishers