Understanding Reliability indices of a Seabin for Automated Water Cleaning through Markov State based Modelling
Pardeep Kumar1, Amit Kumar2,* and Shagun Sharma1
1Lovely Professional University, Punjab, India
2Symbiosis Institute of Technology, Pune Campus, Symbiosis International (Deemed University), Pune, India
E-mail: amit303singh@gmail.com
*Corresponding Author
Received 15 February 2025; Accepted 14 May 2025
The presented work explores the performance analysis of a Seabin, which is used for automated water cleaning, through Markov decision process and mathematical modelling. With the rapid increase in waste disposal into water bodies, the need for automated systems to maintain cleanliness without human intervention becomes essential. Seabin, installed at various locations, rely on the proper working of critical components, including the catch bag, pump, outer shell, filter, and power source. This paper develops a state-based mathematical model to evaluate the key parameters such as component wise reliability, mean time to first failure (MTTF) and sensitivity analysis for system’s MTTF. Performing sensitivity analysis recognizes the behaviors of different components failure on the overall performance of the system. Finally, on the basis of obtained results author provide valuable recommendations to enhance the efficiency and reliability of the Seabin.
Keywords: Seabin, Markov modeling, Reliability analysis, MTTF, Sensitivity analysis.
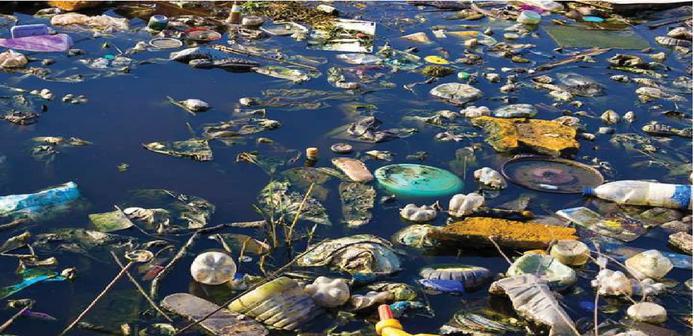
Plastic waste and water contamination have ended up becoming the urgent environmental demanding situations, significantly impacting aquatic ecosystems and biodiversity global. The ever-increasing manufacturing of plastics, coupled with inefficient waste management systems, has caused the accumulation of significant amount of particles and waste in rivers, lakes, and oceans. Globally, over three hundred million tonnes of plastic are produced yearly, with a huge portion ending up in water bodies, where it poses intense risks to marine lifestyles, ecosystems, and human fitness. Plastics break down into micro plastics, which could persist inside the environment for hundreds of years, getting into the food chain and affecting each aquatic species and humans. This pollution now not only threatens biodiversity however also disrupt critical environment services, consisting of water purification and carbon storage, exacerbating weather trade and water shortage troubles. This is quite clear from the Figure 1 (https://www.tiredearth.com/news/water-pollution-causes-effects-and-solutions) given below.
In India, the scenario is in particular alarming. With fast urbanization and industrialization, rivers like the Ganges, Yamuna, and Brahmaputra have grown to be the hotspots for plastic pollution. Research shows that the Ganges itself contributes approximately 1.2 billion kilograms of plastic waste to the oceans every twelve months, making it one of the top ten most polluted rivers inside the world. The effects of unrestrained plastic garbage are also being felt in coastal areas, where damaged coral reefs and dwindling fish population are the results. Millions of people whose livelihoods depend on agriculture, tourism and fishing are directly impacted by these issues. Moreover, despite numerous government initiatives like Swachh Bharat Abhiyan and plastic ban, the lack of infrastructure for waste segregation, collection and reutilizing keeps making the problem worse. Water contamination from plastic and related pollution poses severe public health risks such as hormonal imbalances and carcinogenic effects. This stresses how instantly sophisticated, automated solutions are needed to combat plastic pollution and re-establish the health of India’s waterways.
Figure 1 Water pollution.
The increasing production of waste and pollutants and the poor waste control system have worsened the issue, highlighting the want for immediate change. While mechanical solutions like litter capture systems are being examined, their long time period effectiveness remains uncertain. With increasing level of particles and pollutants in water bodies, there may be the urgent want for efficient and automatic solution to cope with the hassle. Traditionally, waste collection from ports, harbours, and marinas has been a manual and labour-intensive method. The introduction of the Seabin has significantly converted this scenario by presenting an automated and sustainable method for collecting floating particles, micro plastics, and oil contaminants.
The Seabin gadget operates with the function of drawing water and waste into its filter bag, trapping solid waste and returning clean and clear water back to the environment as shown in Figure 2. This tool, frequently anchored to docks or piers, adapts to tidal adjustments and operates continuously, collecting up to twenty kilograms of particles within a day. By integrating advanced features such as oil-absorbing filters and a software system for debris monitoring, the Seabin not only removes waste and other pollutants but also helps track pollution trends, pollutants weight for better waste management strategies. The Seabin is intended to be placed in enclosed spaces, such as ports and marinas and uses a motorized water pump to move water through the device and gather debris in a bag made of natural fiber. The catch bag is also composed of eco-friendly hessian fiber. Its efficacy and dedication to addressing micro-plastic pollution sustainably are demonstrated by its ability to capture plastic as small as 5 mm. In addition to assisting in the preservation and upkeep of marine life, the system is made to need less human labour. Like any artificial solution, it can have drawbacks of its own. The trap bag, oil filter and submersible pumps are some of the essential parts that greatly affect its performance.
Beyond assessing the Seabin’s lifetime, functionality and reliability, this study explores its several operating modes by incorporating mathematical modelling into the system. By quantifying transitions between various system states and identifying probable failure mode, the modelling framework offers a thorough insight of the system’s performance under various circumstances. Through a combination of empirical data from field research and theoretical models, the paper provides a thorough assessment of the Seabin’s strengths and weaknesses. Discussion about automated systems’ contribution to aquatic ecosystem preservation and sustainable marine waste management are intended to be furthered by this analysis.
The novelty of this work is that no study in the past has ever been done by any researchers to determine the performance of the Seabin system through reliability approach under random operating conditions. The authors have utilized the Markov state based model to build the mathematical model and solve the equations with the help of the Laplace transformation. The authors have determined the various reliability measures such as reliability and MTTF of the system. Also, authors performed the sensitivity analysis to identify the main critical components of the system.
This literature review’s primary aim is to explore and evaluate previous studies on marine waste collection technologies, with a particular emphasis on automated system such as Seabin. This review focuses to contextualize the development of the Seabin, explore its operational principles, and evaluate its contribution to reduce plastic pollution in aquatic environments. Furthermore, it identifies gaps inside the current body of knowledge that this study aims to address.
Marine waste control has been a persistent worldwide challenge, on the whole pushed by the increasing production of plastic and useless waste disposal structures. Early approaches relied closely on manual and hard work-in depth methods, which, while powerful on a small scale, were inefficient for addressing large volumes of debris. The need for scalable solution was highlighted in studies such as those presented by Parker-Jurd et al. [1], which prompted the creation of mechanical devices, such boom barriers and litter traps. Despite offering temporary respite, these systems frequently lacked effectiveness and flexibility in a variety of aquatic environments. Wang et al. [2] used surveys in the East Indian Ocean, South China Sea and Pearl rivers to examine the dispersion of atmospheric micro plastic concentrations throughout the ocean. They found that one of the main causes of oceanic micro plastic pollution is the atmosphere, which can carry micro plastics over great distances. Kandare et al. [3] focused on developing a high-tech tool to solve waste management problems in fresh water settings, particularly in rivers like India’s Ulhas River. The three main focuses of their program were increasing public awareness of environmental protection, preventing additional pollution through political and social means and cleaning previously polluted waters with stae of art technological procedures. The system employs a garbage collection technique and makes recommendations for future enhancements, such as the employment of innovative remote control technologies for improved monitoring the complete automation of the process to minimize human labour and utilization of renewable energy sources like solar and wave power. The study emphasizes how crucial it is to manage fresh water resources sustainably by using proactive societal and technological measures. Hundekar and Ahmed [4] described the Swachh Bharat Abhiyaan’s Clean Ganga Mission, which aims to preserve and revive the Ganga River. Among the measures used to improve water quality are the Namami Gange Programme, wastewater treatment, riverside development and public participation. The effort tackles issues such as pollution, industrial waste and sewage. Infrastructure improvements, pollution control strategies and community engagement are remarkable achievements.
Using a motorized pump to pull garbage into an environmentally friendly jute bag, Gupta et al. [5] investigated the operation of the Seabin, a floating waste collection device encased in water bodies. The Seabin is positioned as a sustainable solution to water contamination tanks to its enhanced IoT features, which include infrared sensors and Node MCU boards, which enable automatic monitoring and effective pollution removal. Qureshi et al. [6] emphasized the Seabin’s low energy consumption and biodegradable jute bags, which can be composted after use, as examples of its sustainability. The Seabin can remove oil and floating garbage from water, is more economical, and is more efficient than hand trash collecting. Additionally, it promotes a circular economy by producing new Seabin by recycling the marine plastic garbage that has been collected. By adding rotating motion in addition to translational motion. Gulati et al. [7] improved Seabin design and increased garbage collection by producing centripetal forces. They created a real-time water quality monitoring system that uses wireless sensors to detect parameters like pH and temperature, and they added corn-straw fiber pads for more efficient oil-water separation. This method improves water quality monitoring and rubbish collection efficiency. Mukhtar et al. [8] assessed how well Seabin collected oil, debris, and micro plastics while incorporating enhancements such as improved filers and renewable energy sources. The study examines the advancements in buoyancy force analysis and River Trash Collector Systems (RTCS), which improve waste capacity and operation in high-flow rivers and provide scalable solutions for lowering river pollution, while contrasting Seabin with alternative waste management strategies. A thorough review of the Seabin was given by Kulkarni et al. [9], who emphasized its capacity to filter floating debris and micro plastic in placid waterways like ponds and oceans. The study emphasizes the sustainability of the catch bag by highlighting its incorporation of recyclable materials and its potential for solar-powered operation. It also covers the strategic use of Seabin and the advantages they have for society, such as increased employment and better cleanliness. A Programmable Logic Controller (PLC) and Arduino were used by Yunianto et al. [10] to implement an automated waste collection system in order to combat water pollution caused by plastic and other floating waste. Real-time garbage detection, collection and monitoring are accomplished by the system using sensors including LDR, ultrasonic sensors and a GSM SIM 900 A module. When the bin is full, SMS notifications are sent. Although the mechanical design, which includes lifting mechanisms and DC motor, is effective at cleaning coastal areas, sensor performance at night might be further enhanced.
Ma et al. [11] overcame the drawbacks of conventional techniques by creating a mass sink function in Open FOAM to model the Seabin’s water pumping mechanism. The movement of floating debris was successfully modelled by combining waste action and water pumping simulations with the overset grid technique, confirming the simulation’s accuracy under varied environmental conditions. Vigneswaran et al. [12] created an affordable River Water Trash Collector (RWTC) prototype that is driven by a 220V motor and environmentally friendly flow generators. The system effectively removes debris by adjusting flotation, strain gradient, and flow velocity, capturing up to 1 kg of water waste each day. After debris is removed, the system returns cleansed water, offering a long-term solution to the problem of water pollution. Shaw et al. [13] used resources including plastic bottles, mosquito netting and a homemade water pump to develop a low-cost environmentally friendly Seabin prototype. By efficiently collecting floating water waste, this prototype shows that it is suitable for a variety of water bodies, including ponds and lakes. It operates independently and lessens dependency on pricey technology because it doesn’t require external power source. Its promise as a scalable and cost-effective remedy to water pollution is demonstrated by the design, which encourages a circular economy by recycling collected waste to create more Seabin. An eco-friendly maize straw material with superoleophobic qualities was presented by Tan et al. [14] as a means of extracting oil from liquid mixtures. Because of its chemical resistance and environmental sustainability, modified maize straw is a perfect way to clean up oil spills and cope with the disposal of agricultural waste. Land-based solutions that target the main sources of marine plastics and provide high-quality, affordable, and recyclable results were highlighted by Winterstetter et al. [15]. While long-term strategies concentrate on systemic changes, like cutting back on plastic usage and investing in waste management infrastructure, short-term solutions use technology in conjunction with community-driven initiatives to create jobs and financial incentives. They also call for international cooperation to scale local effort for significant change.
There are still gaps in the literature despite the encouraging results. The majority of research has concentrated on Seabin’s immediate operating effectiveness, paying little attention to its reliability over extended periods of time and in a range of environmental circumstances. Additionally, little is known about how mathematical modelling may be used to forecast system performance and identify possible failure states. To fill up these gaps, this study offers a thorough assessment of Seabin’s lifetime, overall performance and reliability by fusing mathematical modelling with real data from subject survey. By way of investigating its operational states, failure modes, and transitions, this research aims to contribute to the developing discourse on sustainable marine waste control and the integration of automated structures in retaining aquatic ecosystems.
The Seabin system is designed to remove floating debris, micro plastics, and oil pollutants from water bodies. In controlled environments like marinas, harbors, and ports, water circulation is limited and pollution accumulates. Depending on environmental conditions, maintenance frequencies, and the quality of components used, the Seabin has a life expectancy of 5–10 years. There is a detailed description of its main components.
(a) Catch Bag (Filter Bag)
Purpose and Operation: The catch bag is the main component in collecting waste. It is made from durable marine-grade mesh and has a holding capacity of 20 kilograms of debris and can remove particles as small as 2 mm. Failure of this component takes the system into the degraded state only.
Lifespan: Depending on the amount of debris collected, the catch bag lasts 6 to 12 months.
Impact of Failure: On the failure of the bag, waste collection mechanism is stopped, and the bag needs to be replaced by another one.
(b) Pump
Purpose and Operation: The purpose and operation of the pump is to draw water and debris into the Seabin. It can process up to 25,000 litres of water per hour. The failure of this component takes the entire system into a completely failed state.
Lifespan: A good quality pump at least lasts 3–5 years, but exposure to debris or insufficient maintenance can reduce its lifespan.
Impact of Failure: Seabin becomes completely useless if pump fails. Cleaning and debris removal are important preventive measures for increasing it lifespan.
(c) Outer Shell (Body)
Purpose and Operation: The outer shell protects the internal components of the Seabin. It is made from rust-free material. Failure of this component takes the system into a completely failed state.
Lifespan: If not exposed to excessive physical damage the outer shell is designed to last the full lifespan of Seabin.
Impact of Failure: Excessive physical damage causes the system to fail.
(d) Filters
Purpose and Operation: The purpose and operation of the filters are to absorb oil and fuel. The filter can absorb up to 1 litre of oil. The failure of this system takes the system into a degraded state.
Lifespan: Depending on the level of oil pollution in the water, oil-absorbing filters last 2–3 months.
Impact of Failure: Failure of these filters reduces the system’s capacity to manage chemical pollutants.
(e) Power Source
Purpose and Operation: The Seabin consumes 500W daily and is powered by a 115–230V power source. During power outages, backup systems run the system. When the main power supply and backup system fails the system fails to function.
Lifespan: UPS batteries need to be replaced every three to four years.
Impact of Failure: When the pump is stopped by a power outage, the Seabin stops working. In the event that a backup system also fails, the Seabin won’t work until the power is restored.
Proper maintenance and attention to component lifespans are required for optimal performance of the Seabin system. The seamless interaction of its hardware and software components makes preventive maintenance a cornerstone of reliability.
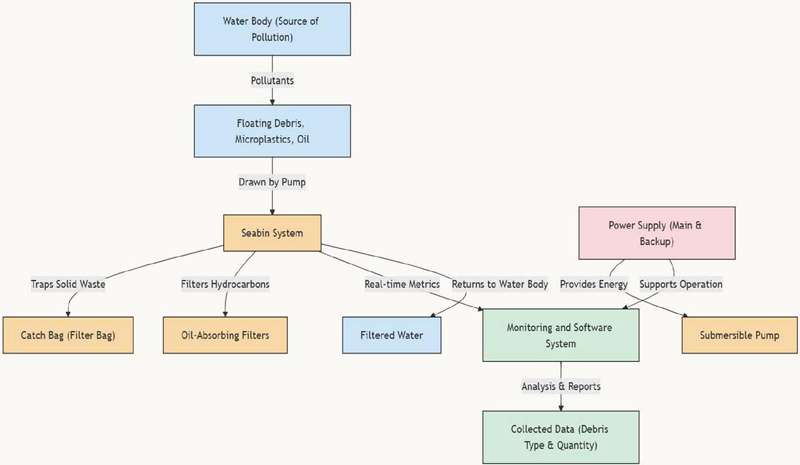
Figure 2 Data flow representation of Seabin.
The following assumptions are taken all the way through the discussion of the model.
• Initially, all the components of the system are in perfect working condition.
• All the failure and repair rates of the components of the system are assumed to follow an exponential distribution.
• Upon failure of the component immediate repair is offered to the system’s components.
• As soon as the failed component is repaired it starts performing it’s working.
• Only one component can fail at a time and failures of the components are independent of one another.
The description of the different notation that authors used in the manuscript is given in the following Table 1 and Table 2.
| Notation | Description |
| Time variable | |
| Frequency Variable | |
| Likelihood of the system being in the state. | |
| Laplace transformation of | |
| Represents the failure rate of pump/ outer shell/ power source/catch bag/ Filter | |
| Represents the repair rate of pump/ outer shell/ power source/catch bag/ Filter | |
| Reliability of the system | |
| MTTF | Mean time to Failure |
| Notation | Description |
| Symbolizes the good working state of the system. | |
| Symbolizes the failed state of the system due to the failure of the pump. | |
| Symbolizes the failed state of the system due to the failure of the outer shell. | |
| Symbolizes the failed state of the system due to the failure of the power source. | |
| Symbolizes the degraded state of the system due to the degradation of the catch bag. | |
| Symbolizes the failed state of the system due to the failure of the pump after the degradation of the catch bag. | |
| Symbolizes the failed state of the system due to the failure of the outer shell after the degradation of the catch bag. | |
| Symbolizes the failed state of the system due to the failure of the power source after the degradation of the catch bag. | |
| Symbolizes the degraded state of the system due to the degradation of the filter. | |
| Symbolizes the failed state of the system due to the failure of the pump after the degradation of the filter. | |
| Symbolizes the failed state of the system due to the failure of the outer shell after the degradation of the filter. | |
| Symbolizes the failed state of the system due to the failure of the power supply after the degradation of the filter. | |
| Symbolizes the degraded state of the system due to the degradation of catch bag and filter. | |
| Symbolizes the failed state of the system due to the failure of the pump after the degradation of filter and catch bag. | |
| Symbolizes the failed state of the system due to the failure of the outer shell after the degradation of filter and catch bag. | |
| Symbolizes the failed state of the system due to the failure of the power source after the degradation of filter and catch bag. |
The authors have utilized the Markov model to formulate the mathematical model of the Seabin system. It has various components such as pump, outer shell, power source, catch bag and Filter. The failure of some components
degrades the performance of the Seabin and failure of some components takes the Seabin into the failure states. During operation, due to the failure of its various components, a Seabin transitions into different states with different probabilities. The state represents the perfect working state of the system. The states represent the degraded states of the system. The states , , represent the failed states of the system. Table 2 provides an overview of these states with best suitable description.
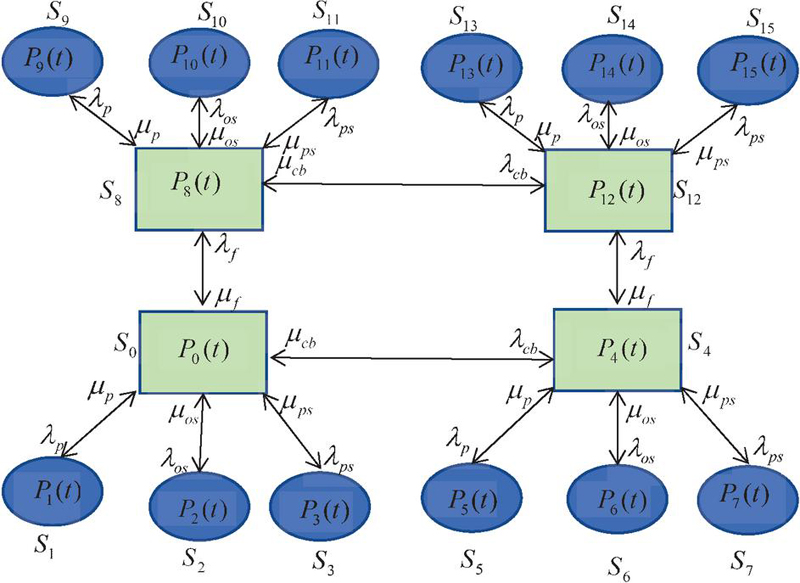
Figure 3 State transition diagram of Seabin.
The state transition diagram of the Seabin system is given below in Figure 3.
Initially, all the components of the system are in good working condition. When any component of the Seabin fails, it transitions from one state to another state. The Seabin remains functional in both good state and degraded states, which are represented by the states while it becomes non-functional in the failed states which are represented by . Upon the failure or the degradation of any component, immediate repair facility is offered to bring the system back in the good working condition. All the failure and repair rates of the system’s components are assumed to follow an exponential distribution.
Within this section, the authors have given the Chapman- Kolmogorov differential equations which have been generated from the state transition diagram of the model. Assuming the system makes the transition at time , and letting , the following set of the differential equations can be generated as shown below.
Now taking limit , we get:
| (1) | |
| (2) | |
| (3) | |
| (4) | |
| (5) | |
| (6) | |
| (7) | |
| (8) | |
| (9) | |
| (10) | |
| (11) | |
| (12) | |
| (13) | |
| (14) | |
| (15) | |
| (16) |
With the Initial condition,
| (17) |
Taking Inverse Laplace transformation of Equations (1)–(16), the following set of equations is obtained.
| (18) | |
| (19) | |
| (20) | |
| (21) | |
| (22) | |
| (23) | |
| (24) | |
| (25) | |
| (26) | |
| (27) | |
| (28) | |
| (29) | |
| (30) | |
| (31) | |
| (32) | |
| (33) |
The solution of above set of Equations (18)–(33) gives the expression for different state probabilities as follows.
| (34) | |
| (35) | |
| (36) | |
| (37) |
where,
| (38) | ||
| (39) | ||
| (40) | ||
| (41) | ||
| (42) |
A system’s possibility of being in a working state (upstate) or a failed/non-working state (downstate) is defined by its upstate and downstate probabilities, respectively. The system’s upstate probability is the sum of its probabilities of working in both its good and degraded states, whereas its downstate probability is the sum of its probabilities of all states in which it is not working. The system’s upstate probability is given in Equation (43) and system’s downstate probability is given in Equation (44).
| (43) | |
| (44) |
The authors obtain the various reliability performance measures of the Seabin system in this section.
Reliability of the system is defined as the probability that system will perform its intended task for a specified period of time when operated under prescribed conditions [16–20]. Let random variable denotes the time of the failure of the system. Then the reliability of the system is given by the following Equation (45).
| (45) |
The Equation (45) describes the reliability is the probability that the system can’t fail before the time period . For finding the reliability of the Seabin system, set all the repair rates equal to zero, i.e., set in Equation (43) and then take inverse Laplace transform of the equation, one can easily obtain the time dependent reliability of the Seabin system as shown in Equation (46).
| (46) |
For the analysis of the performance of the Seabin, we set the failure rate as , , , , . These failure rates have been taken as failure rate/month.
From Equation (46), it is quite clear that Seabin’s reliability mainly depends on the pump, outer shell, and power source. Now we want to see the effect of the different failure rates of the pump, outer shell and power supply on the system’s reliability.
Here, reliability of the Seabin is obtained by varying the failure rates of the pump and keeping the failure rates of the other components fixed. The obtained results are shown in the following Table 3 and Figure 4.
Table 3 Reliability of Seabin w.r.t fluctuation in the failure rates of the pump
| 0 | 1 | 1 | 1 |
| 1 | 0.95 | 0.95 | 0.95 |
| 2 | 0.91 | 0.90 | 0.89 |
| 3 | 0.87 | 0.85 | 0.84 |
| 4 | 0.82 | 0.81 | 0.79 |
| 5 | 0.79 | 0.77 | 0.76 |
| 6 | 0.75 | 0.73 | 0.71 |
| 7 | 0.71 | 0.69 | 0.67 |
| 8 | 0.68 | 0.66 | 0.64 |
| 9 | 0.64 | 0.63 | 0.60 |
| 10 | 0.62 | 0.59 | 0.57 |
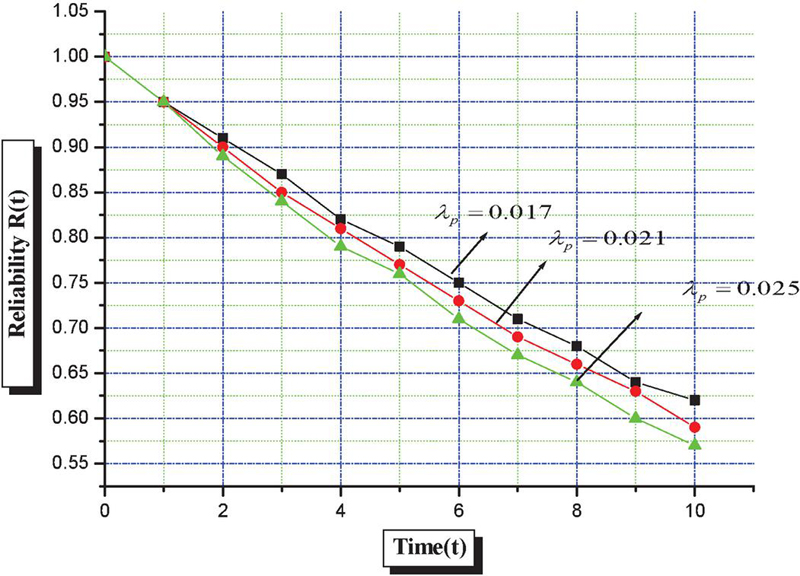
Figure 4 Reliability of Seabin w.r.t fluctuation in the failure rates of the pump.
Here, reliability of the Seabin is obtained by varying the failure rates of the outer shell and keeping the failure rates of the other components fixed. The obtained results are shown in the following Table 4 and Figure 5.
Table 4 Reliability of Seabin w.r.t fluctuation in the failure rates of the outer shell
| 0 | 1 | 1 | 1 |
| 1 | 0.95 | 0.95 | 0.95 |
| 2 | 0.90 | 0.90 | 0.90 |
| 3 | 0.85 | 0.85 | 0.85 |
| 4 | 0.81 | 0.81 | 0.81 |
| 5 | 0.77 | 0.77 | 0.77 |
| 6 | 0.73 | 0.73 | 0.73 |
| 7 | 0.70 | 0.69 | 0.69 |
| 8 | 0.66 | 0.65 | 0.65 |
| 9 | 0.62 | 0.62 | 0.62 |
| 10 | 0.59 | 0.59 | 0.59 |
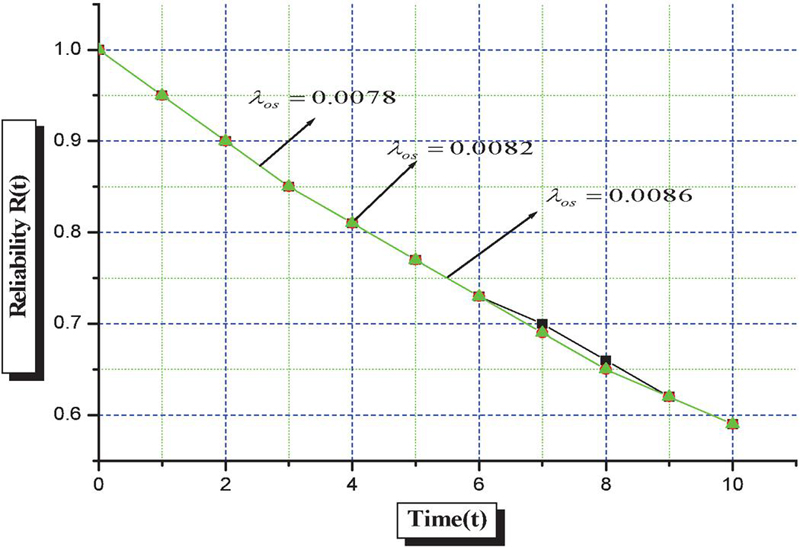
Figure 5 Reliability of Seabin w.r.t fluctuation in the failure rates of the outer shell.
Here, reliability of the Seabin is obtained by varying the failure rates of the power source and keeping the failure rates of the other components fixed. The obtained results are shown in the following Table 5 and Figure 6.
Table 5 Reliability of Seabin w.r.t fluctuation in the failure rates of the power source
| 0 | 1.00 | 1.00 | 1.00 |
| 1 | 0.95 | 0.95 | 0.95 |
| 2 | 0.90 | 0.90 | 0.89 |
| 3 | 0.86 | 0.86 | 0.84 |
| 4 | 0.82 | 0.81 | 0.80 |
| 5 | 0.78 | 0.77 | 0.76 |
| 6 | 0.74 | 0.73 | 0.71 |
| 7 | 0.71 | 0.69 | 0.67 |
| 8 | 0.68 | 0.66 | 0.63 |
| 9 | 0.64 | 0.63 | 0.60 |
| 10 | 0.61 | 0.59 | 0.57 |
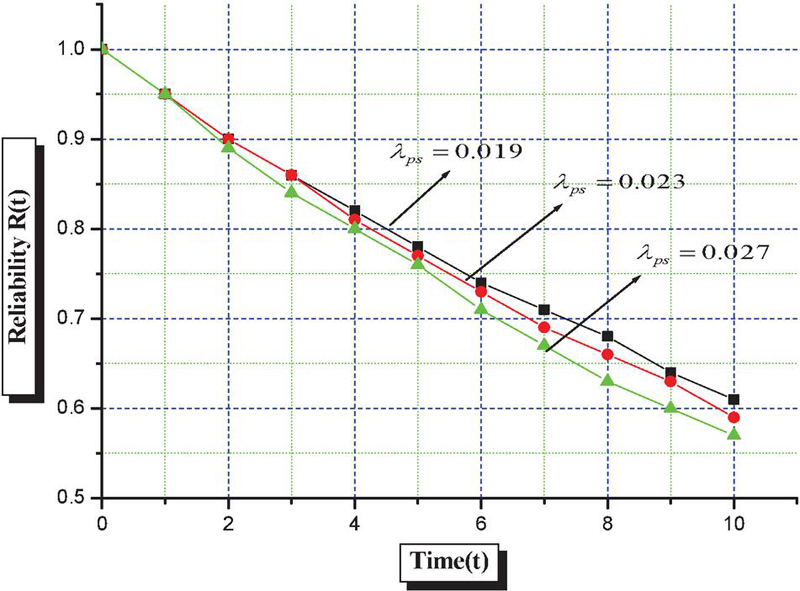
Figure 6 Reliability of Seabin w.r.t fluctuation in the failure rates of the power source.
System MTTF plays a very crucial role in the overall planning of maintenance strategy of a system [21–23]. It is the average time that a system takes to fail for the first time to fail. It is often considered that greater is the value of the system’s MTTF the greater is the system reliability and lesser is the value of the value of the system’s MTTF the lesser is the system reliability [24]. To compute the MTTF of the Seabin set all the repair rates equal to zero, i.e., set in Equation (43) and then take the limit , one can obtain the expression for the MTTF of the system as given in Equation (47).
| (47) |
Now set the failure rates as in Equation (47) and vary each failure rate sequentially from 0.01 to 0.09, one can obtain the follow Table 6 and Figure 7 as given.
Table 6 MTTF of Seabin w.r.t fluctuation in the failure rate
| Failure Rate | |||||
| 0.01 | 19.15 | 24.27 | 18.51 | 19.15 | 25.51 |
| 0.02 | 19.15 | 19.53 | 15.63 | 19.15 | 20.32 |
| 0.03 | 19.15 | 16.33 | 13.51 | 19.15 | 16.82 |
| 0.04 | 19.15 | 14.04 | 11.90 | 19.15 | 14.45 |
| 0.05 | 19.15 | 12.31 | 10.64 | 19.15 | 12.62 |
| 0.06 | 19.15 | 10.96 | 9.62 | 19.15 | 11.21 |
| 0.07 | 19.15 | 9.88 | 8.77 | 19.15 | 10.08 |
| 0.08 | 19.15 | 8.99 | 8.06 | 19.15 | 9.15 |
| 0.09 | 19.15 | 8.25 | 7.46 | 19.15 | 8.38 |
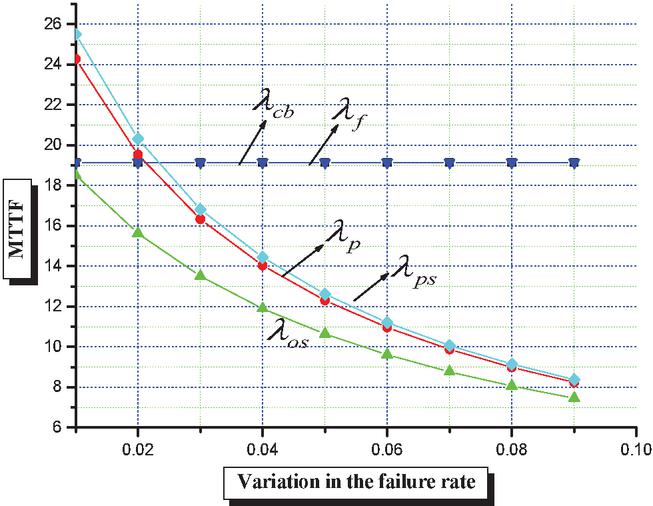
Figure 7 MTTF of Seabin w.r.t fluctuation in the failure rates.
The sensitivity of the mean time to failure indicates how alterations in system factors impact MTTF [25]. To demonstrate its effect on system MTTF, it is commonly computed as the partial derivative of MTTF w.r.t a parameter. To calculate the sensitivity of the system MTTF, differentiate equation (47) w.r.t each failure rate sequentially and set the failure rates as , and vary each failure rate sequentially from 0.01 to 0.09 and keep the other failure rates fixed, one can easily obtain the following Table 7 and Figure 8 as given.
Table 7 Sensitivity of MTTF w.r.t fluctuation in the failure rate
| Failure Rate | |||||
| 0.01 | 0.00 | -589.12 | -342.93 | 0.00 | -650.77 |
| 0.02 | 0.00 | -381.46 | -244.14 | 0.00 | -413.11 |
| 0.03 | 0.00 | -266.99 | -182.61 | 0.00 | -285.33 |
| 0.04 | 0.00 | -197.26 | -141.72 | 0.00 | -208.82 |
| 0.05 | 0.00 | -151.66 | -113.17 | 0.00 | -159.42 |
| 0.06 | 0.00 | -120.22 | -92.45 | 0.00 | -125.68 |
| 0.07 | 0.00 | -97.64 | -76.94 | 0.00 | -101.61 |
| 0.08 | 0.00 | -80.87 | -65.03 | 0.00 | -83.85 |
| 0.09 | 0.00 | -68.07 | -55.69 | 0.00 | -70.37 |
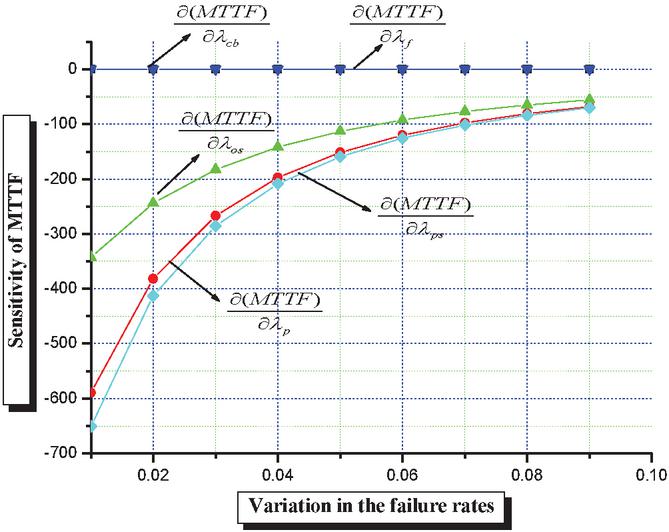
Figure 8 Sensitivity of MTTF w.r.t fluctuation in the failure rate.
In this paper, the authors have analysed the performance of a Seabin using a reliability approach and Markov modelling. The authors have developed a stochastic model of a Seabin by considering its components, such as the catch bag, filter, outer shell, pump and power source. The failure and repair rates of these components are assumed to follow an exponential distribution. By varying the failure rates of the components of the Seabin, the following results have been obtained.
• Table 3 and Figure 4 validate how the reliability of a Seabin decreases over time due to the fluctuating failure rates of its pump. While all scenarios start with perfect reliability 1.0, systems with higher failure rates experience a sharper decline, with noticeable differences emerging as time progresses. At , reliability drops to 0.62 for the lowest failure rate scenario, compared to 0.59 and 0.57 for higher failure rates. This highlights the critical role of the pump’s reliability in the overall system’s performance, emphasizing the need for robust design and timely maintenance to ensure sustained operation.
• Table 4 and Figure 5 show the reliability of a Seabin over time, considering fluctuating failure rates of the outer shell while keeping the failure rates of the other components fixed. Initially, all reliability values are 1, indicating perfect functionality. However, as time progresses, the reliability consistently decreases in all the scenarios, with no significant difference across the three columns, suggesting that the failure rates of the outer shell have a uniform effect on the system’s performance. At , the reliability is 0.59 in all cases, indicating a steady degradation of the Seabin’s performance over time, irrespective of the specific failure rate condition for the outer shell.
• Table 5 and Figure 6 show the reliability of a Seabin over time, considering fluctuating failure rates of the power source while keeping the failure rates of the other components fixed. Initially, all reliability values are 1, indicating perfect functionality. As time progresses, the reliability decreases consistently across all scenarios. At , the reliability drops to 0.61 for the lowest failure scenarios, compared to 0.59 and 0.57 for the higher failure rate scenarios. This indicates that fluctuation in the power source have a significant impact on the Seabin’s overall reliability, with higher failure rates leading to a faster decline in performance.
• Table 6 and Figure 7 show the mean time to failure (MTTF) of the Seabin as function of fluctuating failure rates, varying sequentially from 0.01 to 0.09. The results show that the MTTF remains constant at 19.15 for the variations in the failure rate of catch bag and filter. However, the MTTF decreases as the failure rates of the pump, outer shell and power source increases. The MTTF of the system is lowest with respect to the variation in the failure rate of the outer shell.
• Table 7 and Figure 8 show the sensitivity of the MTTF of the Seabin with respect to variations in the failure rate of the system’s components. The system is least sensitive to the variation in the failure rates of the catch bag and filter. However, the system’s MTTF is most sensitive to the failure rate of the power source and pump.
Based on the analysis and findings, the authors conclude that the failure rates of the outer shell, pump and power source have the significant impact on the Seabin’s performance. The system’s MTTF is very low w.r.t variation in the failure rate of the outer shell and it is constant w.r.t variation in the failure rate of catch bag and filter . Similarly, the Seabin’s MTTF is very sensitive w.r.t the variation in the failure rate of the power source and pump . The slight increase in the failure rates of the power source and pump drastically decreases the system’s MTTF.
Therefore, to improve Seabin’s performance, it is essential to lower the power source, outer shell and pump failure rates using strong design techniques, like incorporating redundancy, using materials with high durability, and guaranteeing predictive maintenance. All things considered, a focused reliability growth approach focused on the power source, outer shell and pump will have the biggest influence on prolonging the system’s operating life and guaranteeing steady long-term performance.
• IoT sensors may be incorporated into future projects to enable predictive maintenance and real-time monitoring of Seabin components.
• To improve reliability and performance in a range of climatic situations, more study might concentrate on improving the materials and design of Seabin components.
[1] Parker-Jurd, F. N., Smith, N. S., Gibson, L., Nuojua, S., and Thompson, R. C. (2022). Evaluating the performance of the ‘Seabin’–A fixed point mechanical litter removal device for sheltered waters. Marine Pollution Bulletin, 184, 114199.
[2] Wang, X., Li, C., Liu, K., Zhu, L., Song, Z., and Li, D. (2020). Atmospheric microplastic over the South China Sea and East Indian Ocean: abundance, distribution and source. Journal of hazardous materials, 389, 121846.
[3] Kandare, D. N., Kalel, A. N., Jamdade, A. S., and Jawale, G. P. (2018). Design & construction of river cleaning mechanism. International Journal of Innovative Science and Research Technology, 3(11), 428–432.
[4] Hundekar, S., and Ahmed, Z. (2019). A study report on Clean Ganga Mission under Swachh Bharat Abhiyaan. Journal of Emerging Technologies and Innovative Research (JETIR), 6(6). 97–101.
[5] Gupta, N., Kumari, K., Arshad, M.N., Mishra, A., and Kumar, A.(2023). IoT based automated floating water waste collector by seabin mechanism, International Journal of Novel Research And Development, 8(5), 887–892.
[6] Qureshi, N., Yadav, A., Sharma, A., and Delvi, A.(2014). Seabin, International Journal of Emerging Technologies and Innovative Research, 9(4), 702–706.
[7] Gulati, L., Kumar, A., Sengar, K., Kumar, R. R., Arora, K., Chauhan, N., and Verma, Y. K. (2022). Methodology for designing and fabricating a novel SEABIN used in the marine industries. In 10th International Conference on Advancements in Engineering and Technology (ICAET-2022), Sangrur, Punjab, India.
[8] Mukhtar, M. F., Rosley, M. I. F., Lubis, A. M. H. S., Tamaldin, N., Hussin, M. S. F., Damanhuri, A. A. M., Azlan, K. A., Hanizat, N. H. (2020). Development of river trash collector system. In Journal of Physics: Conference Series (Vol. 1529, No. 4, p. 042029). IOP Publishing.
[9] Kulkarni, K., Anand, and Prabhushetty, V. (2021). Seabin: A floating bin for collecting pollutants floating on surface of water. International Research Journal of Modernization in Engineering, Technology and Science, 3(8), 121–123.
[10] Yunianto, A. H., Prayetno, E., Susanto, F. I., and Suhendra, T. (2021, November). Smart system using programmable logic controller for Seabin prototype. In IOP Conference Series: Earth and Environmental Science (Vol. 926, No. 1, p. 012063). IOP Publishing.
[11] Ma, Z., Gao, M., and Zhai, G. (2023). Numerical study on the capture capacity of coastal Seabin-type debris collection devices under regular waves. Ocean Engineering, 267, 113111.
[12] Vigneswaran, C., Afifah Z. M., Keerthana, J., Harish K. R., and Hariharan, R. (2022). Design and development of river water trash collector for a sustainable environment. In Materials, Design and Manufacturing for Sustainable Environment: Select Proceedings of ICMDMSE 2022 (pp. 589–600). Singapore: Springer Nature Singapore.
[13] Shaw, S. K., Paul, S., Mitra, B. R., Dhar, P., Pal, K., and Banerjee, A. Design of low-cost Seabin for efficient marine debris collection, Sirjana Jounal, 54(3), 83–86.
[14] Tan, X., Wang, H. M. D., Zang, D., Wu, L., Liu, F., Cao, G., Hu, Y., Ho, S. H. (2021). Superhydrophobic/superoleophilic corn straw as an eco-friendly oil sorbent for the removal of spilled oil. Clean Technologies and Environmental Policy, 23, 145–152.
[15] Winterstetter, A., Grodent, M., Kini, V., Ragaert, K., and Vrancken, K. C. (2021). A review of technological solutions to prevent or reduce marine plastic litter in developing countries. Sustainability, 13(9), 4894.
[16] Srinath, L. S. (1991). Reliability engineering. New Delhi, Delhi: Affiliated East-West Press.
[17] Opyrchał, L. (2021). Is mean time to failure (MTTF) equal to mean time of life for unrepairable systems? Journal of KONBiN, 51(1), 255–264.
[18] Ram, M., and Manglik, M. (2016). Stochastic biometric system modelling with rework strategy. International Journal of Mathematical, Engineering and Management Sciences, 1(1), 1–17.
[19] Kumar, A., and Ram, M. (2018). System reliability analysis based on Weibull distribution and hesitant fuzzy set. International Journal of Mathematical, Engineering and Management Sciences, 1(1), 513–521.
[20] Kumar, A., and Ram, M. (2019). Computation interval-valued reliability of sliding window system. International Journal of Mathematical, Engineering and Management Sciences, 4(1), 108–115.
[21] Kumar, P., Kumar, A., and Chhetri, G. (2024). Reliability centered modeling of an automated waste sorting robotic arm system. International Journal of Mathematical, Engineering & Management Sciences, 9(5), 1210–1225.
[22] Ram, M., Kumar, A. (2014). Performance of a structure consisting a 2-out-of-3: F substructure under human failure. Arabian Journal for Science and Engineering, 39(11), 8383–8394.
[23] Kumar, P., and Kumar, A. (2023). Time dependent performance analysis of a Smart Trash bin using state-based Markov model and Reliability approach. Cleaner Logistics and Supply Chain, 9, 100122.
[24] Ram, M., Singh, S. B., Singh, V. V. (2013). “Stochastic analysis of a standby system with waiting repair strategy,” IEEE Transactions on Systems Man & Cybernetics: Systems, 43(3), 698–707.
[25] Jadhav, S., and Kumar, A. (2025). Feeding system’s sensitivity and reliability analysis through Markov decision process. International Journal of Mathematical, Engineering and Management Sciences, 10(2), 567–582.

Pardeep Kumar is currently working as an Assistant Professor in the Department of Mathematics at Lovely Professional University, Punjab, India. He holds a Doctorate in Philosophy with a specialization in Reliability theory. His research interests include system reliability analysis, multistate systems, Markov Modeling, and applied mathematics in engineering systems. He has published several research papers in reputed journals and has contributed significantly to the field through his work on modelling and analysing the performance of different complex systems using probabilistic and statistical techniques.

Amit Kumar is working as an Assistant Professor in the department of Applied Sciences at Symbiosis Institute of Technology, Symbiosis International (Deemed University), Pune, Maharashtra, India. He has been taught several core courses in pure and applied mathematics at undergraduate and postgraduate levels. He has done his Bachelors and Master’s form Choudhary Charan Singh University Meerut, India, in 2006 and 2009 respectively. In 2016 he completed his Doctorate in applied mathematics in the field of Reliability theory. He published 65+ research papers/Book chapters in various esteemed international journals/Books including Taylor & Francis, Elsevier, Springer, Emerald, World Scientific, Inder Science and many other international journals of repute and also presented his works at national and international conferences. He is a reviewer of many international journals including Elsevier, Springer, Emerald, John Wiley, Taylor & Francis and many other publishers. His fields of research are Operations Research, Reliability theory, Fuzzy Reliability, and System Engineering.

Shagun Sharma is a B.Tech. student in Computer Science and Engineering at Lovely Professional University, Punjab, India. He has a strong foundation in data structures, algorithms, and full-stack development, with hands-on experience in building MERN stack applications. He is passionate about research and development, with a focus on leveraging technology for real-world problem solving. He has contributed to projects ranging from cultural heritage platforms to automated appraisal systems for faculty advancement. Shagun continues to explore areas such as reliability theory, artificial intelligence, IoT, and sustainable tech solutions through academic research and practical implementations.
Journal of Reliability and Statistical Studies, Vol. 18, Issue 1 (2025), 243–270.
doi: 10.13052/jrss0974-8024.18110
© 2025 River Publishers