Forecasting models for forewarning Soybean Yellow Mosaic Virus for Tarai Zone of Uttarakhand
Yunish Khan* and Vinod Kumar
Department of Mathematics, Statistics and Computer Science, College of Basic Sciences and Humanities, G.B. Pant University of Agriculture and Technology, Pantnagar, Uttarakhand, India
E-mail: khanyunish263145@gmail.com; vinod_kumarbcb@yahoo.com
*Corresponding Author
Received 18 March 2025; Accepted 10 October 2025
Abstract
The emergence of soybean diseases represents a formidable obstacle to the sustainable progression of the rapidly evolving soybean industry, which endeavors to achieve elevated productivity and enhanced crop excellence. Prompt and accurate disease prognostication is imperative for efficacious management protocol, as it contributes to limiting pathogen proliferation. This investigation examined the impact of various meteorological factors on the incidence of Soybean Yellow Mosaic Virus (SYMV) in Pantnagar, Uttarakhand. Six multivariate frameworks were assessed, encompassing Stepwise Multiple Linear Regression (SMLR), Artificial Neural Network (ANN) and Elastic Net (ELNET), employing both original climatic parameters and calculated weather indices to predict disease severity. For model construction, 80% of the dataset was allocated for training purposes while the remaining 20% was reserved for validation procedures. Among all examined frameworks, the ANN model incorporating weather indices (ANN-WI) exhibited exceptional predictive performance, attaining a Normalized Mean Square Error (nRMSE) of only 3.08% and an R coefficient of 0.99 during the calibration phase. Based on performance metrics, the frameworks were ranked as follows: ANN-WI ANN-W ELNET-W ELNET-WI SMLR-WI SMLR-W. The results definitively demonstrate that ANN-based frameworks, especially those incorporating weather indices, significantly exceeded alternative modeling techniques within the investigated area.
Keywords: Crop disease severity forecasting, Stepwise Multiple Linear Regression (SMLR), Artificial Neural Network (ANN), Elastic Net (ELNET).
1 Introduction
Soybean represents an essential oilseed crop globally, with India occupying as the fifth position among major producers (Soystats, 2022), while Uttarakhand accounts for 90–95% of cultivation in the Northwestern Himalayan territory (Bhartiya et al., 2017). Crop productivity suffers considerably from pathological conditions, resulting in yield decreases spanning 5–15%, and escalating to 47% in extreme scenarios (Kolte et al., 1987). Over three hundred soybean pathologies have been identified, with Soybean Yellow Mosaic Virus (SYMV) proving exceptionally destructive throughout South and Southeast Asian regions (Hartman et al., 1999; Naveesh et al., 2020). Climate variability further intensifies pest and pathogen risks, with each 1C elevation potentially amplifying insect-related damages by 10% to 25% (Domingues et al., 2022). Climate conditions exercise a crucial influence on crop wellness, rendering climate-based prognostication indispensable for early disease detection and mitigation (Agrawal and Mehta, 2007).
Phenological climate indices-deployed to evaluate crop development phases such as anthesis and maturation-provide invaluable perspectives into disease susceptibility (Khan et al., 2023a). Although conventional regression methodologies have been utilized for pathological prediction, machine learning techniques are increasingly favored for their capacity to model intricate associations. Nevertheless, comparative studies examining the efficacy of raw meteorological data versus derived indices in predicting disease severity remain limited. This research addresses this knowledge gap by evaluating both statistical and machine learning frameworks to determine the most precise approach for forecasting soybean pathological severity.
2 Materials and Methods
Disease severity prediction frameworks were developed utilizing Kharif season soybean pathological severity data and meteorological variables obtained from GBPUAT, Pantnagar, located in the agriculturally productive Tarai region of Uttarakhand, India (Latitude 29 N, Longitude 79 E, Elevation 243 m). Information on Soybean Yellow Mosaic Virus (SYMV) severity (2001–2020) was produced from the Department of Plant Pathology, with corresponding climatic data from the Department of Agrometeorology.
For modeling purposes, information spanning 2001 to 2016 were employed for training, whereas 2017–2020 data facilitated framework evaluation (Montaseri et al., 2018). Concerning phenological aspects (Figure 1), weekly means of daily meteorological variables were computed to align with pathological observation frequency. Both direct climatic parameters (W) and derived weather indices (WI) were employed as predictors, adhering to the methodologies established by Khan et al. (2023b) and Satpathi et al. (2023).
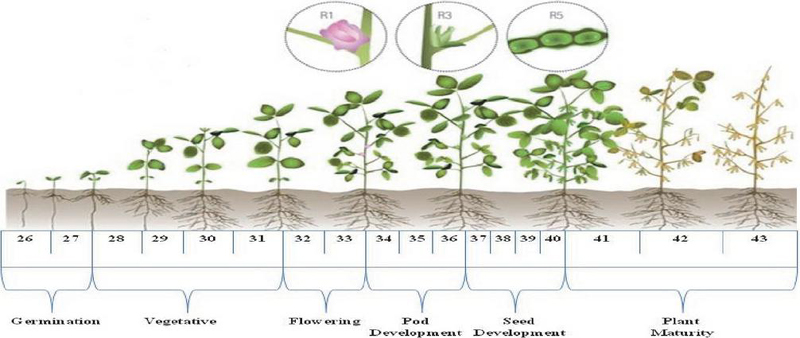
Figure 1 Soybean crop developmental stages based on standard meteorological weeks.
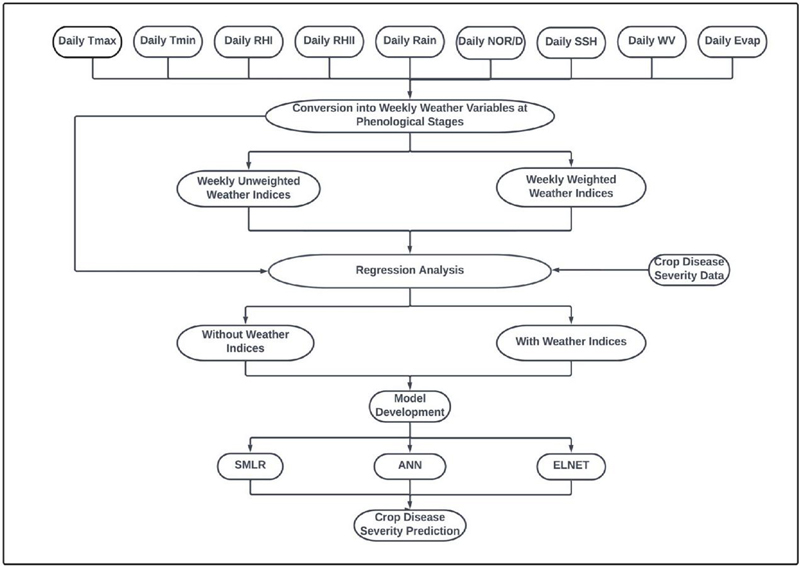
Figure 2 Flowchart depicting the various phases of disease severity prediction framework development.
The framework development process is illustrated in Figure 2, delineating the sequential procedures implemented. Six multivariate frameworks were constructed: SMLR-W, SMLR-WI, ANN-W, ANN-WI, ELNET-W and ELNET-WI. The multivariate statistical approaches utilized in this investigation for developing crop pathological severity prediction frameworks are elaborated below:
Percent Disease Index (PDI): The Percent Disease Index (PDI) for foliar pathogens was calculated employing the methodology proposed by Wheeler (1969).
Area Under Disease Progress Curve (AUDPC): AUDPC was determined following the procedure outlined by Pandey et al. (1989), which quantifies pathological progression over time based on successive severity observations (Khan et al., 2025).
Stepwise Multiple Linear Regression (SMLR): Stepwise MLR represents a traditional statistical technique that enhances framework interpretability and precision by systematically incorporating or excluding predictors based on statistical criteria (Das et al., 2018).
Artificial Neural Network (ANN): ANNs constitute bio-inspired computational frameworks structured with input, hidden, and output layers, capable of capturing nonlinear relationships in complex datasets (Dahikar et al., 2014). Framework optimization was executed using “caret” package in R with the “nnet” method and 10-fold cross-validation (Kuhn, 2008).
Elastic net (ELNET): ELNET combines the regularization strengths of LASSO and Ridge regression by adjusting alpha and lambda parameters, offering a flexible and robust modeling framework (Hastie et al., 2021). Implementation was carried out using the “glmnet” package in R.
Framework Performance Assessment: Framework performance was evaluated using R, RMSE, nRMSE, MAE, MBE, and EF, following classification criteria and formulas reported by Khan et al. (2025), Setiya et al. (2022) and Satpathi et al. (2023). R and nRMSE 10% indicated outstanding predictive accuracy.
Table 1 Performance metrics obtained from SMLR frameworks during calibration and validation phases
| Model | Equation | R | MAE | RMSE | nRMSE | EF |
| Calibration | ||||||
| SMLR-WI | 0.81 | 23.68 | 27.65 | 14.91 | 0.77 | |
| SMLR-W | 0.32 | 42.28 | 52.69 | 28.42 | 1.15 | |
| Validation | ||||||
| SMLR-WI | 0.07 | 100.36 | 119.88 | 47.72 | -35.50 | |
| SMLR-W | 0.31 | 114.46 | 127.61 | 50.80 | 42.37 | |
| Where: G Germination, V Vegetative, F Flowering, Pod Pod development, | ||||||
| S Seed development, PM Plant maturity | ||||||
3 Results
Stepwise Multiple Linear Regression Models (SMLR): The predictive performance metrics for all SMLR-based frameworks are presented in Table 1. Initially, the effectiveness of the Stepwise Multiple Linear Regression Framework incorporating weather indices (SMLR-WI) was evaluated. The coefficient of determination (R) reached 0.81, demonstrating that approximately 81% of the variance in soybean pathological severity was explained by the principal predictors (Z and Z). The root mean square error (RMSE) during calibration phase was 27.65, whereas it escalated to 119.88 during validation. The normalized RMSE (nRMSE) was 14.91 in calibration and 47.72% in validation. The mean absolute error (MAE) values were 23.68 in the calibration stage and 100.36 in validation. A decrease in R and an increase in error metrics (RMSE, nRMSE and MAE) were observed during validation. The SMLR-WI framework demonstrated stable performance across both calibration and validation phases, with error percentages fluctuating between 87.43% and 63.58%.
During the construction of the Stepwise Multiple Linear Regression Framework utilizing direct weather variables (SMLR-W), the coefficient of determination (R) was determined to be 0.32, indicating that approximately 32% of the variance in soybean pathological severity was attributed to meteorological parameters across various development stages of the crop. The RMSE during calibration was measured at 52.69, increasing to 127.61 during validation. The nRMSE values were 28.42 for calibration and 50.80 for validation. The MAE values were recorded at 42.28 during calibration and 114.46 in validation. A reduction in R and an increase in error values (RMSE, nRMSE and MAE) were evident during the validation phase. The SMLR-W framework exhibited consistent behavior during both calibration and validation, with error percentages ranging from 68.51% to 65.49%.
Artificial Neural Network Models (ANN): The predictive performance metrics for all ANN-based frameworks are consolidated in Table 2. The assessment of the artificial neural network framework utilizing weather indices (ANN-WI) yielded a coefficient of determination (R) of 0.99 and a root mean square error (RMSE) of 5.71 during the calibration phase. In the validation stage, the R value was established at 0.98, with an RMSE of 17.12. The normalized RMSE (nRMSE) during calibration and validation was calculated as 3.08 and 6.82, respectively. The mean absolute Error (MAE) during calibration and validation phases was obtained as 4.70 and 11.58, respectively. A decline in R and an elevation in error metrics (RMSE, nRMSE and MAE) were observed during validation. The error percentage varied from 0.33% to 8.71%.
For the artificial neural network framework utilizing direct weather variables (ANN-W), the coefficient of determination (R) and RMSE during calibration were established at 0.97 and 14.04, respectively. In the validation phase, the R value improved to 0.99, with an RMSE of 10.29. The nRMSE for calibration and validation was computed at 7.57 and 4.09, respectively. The MAE values for calibration and validation were 9.86 and 7.42, respectively. An improvement in R and a reduction in error values (RMSE, nRMSE and MAE) were observed during validation. The error percentage ranged between 12.30% to 2.04%.
Table 2 Performance metrics obtained from ANN frameworks during calibration and validation phases
| Model | No. of hidden Neurons | R | MAE | RMSE | nRMSE | EF |
| Calibration | ||||||
| ANN-WI | 10 | 0.99 | 4.70 | 5.71 | 3.08 | 0.99 |
| ANN-W | 5 | 0.97 | 9.86 | 14.04 | 7.57 | 0.95 |
| Validation | ||||||
| ANN-WI | 10 | 0.98 | 11.58 | 17.12 | 6.82 | 0.97 |
| ANN-W | 5 | 0.99 | 7.42 | 10.29 | 4.09 | 0.99 |
ELASTIC NET (ELNET): The prediction performance metrics for ELNET-based frameworks are presented in Table 3. The forecasting accuracy represented by coefficient of determination (R) and root mean square error (RMSE) was established at 0.90 and 26.68, respectively, for the elastic net framework incorporating weather indices (ELNET-WI) during the calibration phase. During validation, the R value decreased to 0.84, while the RMSE escalated to 108.46. The normalized RMSE (nRMSE) registered at 14.39 during calibration and 43.18 during validation. The mean absolute error (MAE) was obtained as 22.88 in the calibration stage and 92.33 in the validation stage. A decline in R accompanied by an elevation in error metrics (RMSE, nRMSE and MAE) was observed during validation. The framework demonstrated satisfactory performance during calibration but exhibited inadequate predictive accuracy during validation. The error percentage fluctuated between 152.35% to 39.30%.
For the elastic net framework utilizing direct weather variables (ELNET-W), the coefficient of determination (R) and RMSE values during calibration were 0.95 and 32.18, respectively. However, during the validation phase, the R value plummeted to 0.15, while the RMSE surged to 111.46. The nRMSE values were 17.36 during calibration and 44.37 during validation. The MAE during calibration and validation phases was 23.57 and 95.75, respectively. Similar to the ELNET-WI framework, a reduction in R and an escalation in error indicators (RMSE, nRMSE and MAE) were observed during validation. Although the framework demonstrated high accuracy during calibration, its predictive capability deteriorated substantially during validation. The error percentage ranged from 130.52% to 47.47%.
Table 3 Performance metrics obtained from ELNET frameworks during calibration and validation phases
| Model | R | MAE | RMSE | nRMSE | EF |
| Calibration | |||||
| ELNET-WI | 0.89 | 22.88 | 26.68 | 14.39 | 0.82 |
| ELNET-W | 0.95 | 23.57 | 32.18 | 17.36 | 0.74 |
| Validation | |||||
| ELNET-WI | 0.84 | 92.33 | 108.46 | 43.18 | 0.05 |
| ELNET-W | 0.15 | 95.75 | 111.46 | 44.37 | 0.01 |
4 Discussion
All constructed frameworks were evaluated based on R and nRMSE values presented in Table 4. According to the analysis, the ANN-WI and ANN-W frameworks demonstrated excellent performance during the calibration phase, while the SMLR-WI and ELNET-WI frameworks yielded satisfactory results. During the validation phase, the ANN-WI framework again manifested superior accuracy, establishing itself as the most robust approach for predicting soybean pathological severity in the study region. The framework performance hierarchy can be delineated as follows: ANN-WI ANN-W ELNET-W ELNET-WI SMLR-WI SMLR-W. The investigation’s findings indicated that ANN-WI and ANN-W were the most efficacious frameworks for the examined region. These results are consistent with findings by Khan et al. (2023a) and Khan et al. (2025), who determined that ANN surpassed other modeling methodologies.
Table 4 Framework performance comparison using R and nRMSE values
| Model/Performance | R | R | nRMSE | nRMSE |
| SMLR-WI | Good | Poor | Good | Poor |
| SMLR-W | Poor | Poor | Fair | Poor |
| ANN-WI | Excellent | Excellent | Excellent | Excellent |
| ANN-W | Excellent | Excellent | Excellent | Excellent |
| ELNET-WI | Good | Good | Good | Poor |
| ELNET-W | Excellent | Poor | Good | Poor |
5 Conclusion
The investigation analyzed six multivariate frameworks to estimate soybean pathological severity utilizing different meteorological variables. The outcomes indicated that the ANN-WI framework exhibited the highest accuracy in predicting soybean pathological severity. Based on the current findings, the ANN-W framework was the second-best performer. Hence, this study concludes that in Pantnagar, the ANN-WI and ANN-W frameworks substantially outperformed the SMLR-WI, SMLR-W, ELNET-WI, and ELNET-W frameworks in forecasting soybean pathological severity.
Conflict of Interests
The authors declare have no conflicts of interest.
Data Availability
The datasets employed in this study are available upon request.
References
A REFERENCE GUIDE TO IMPORTANT SOYBEAN FACTS & FIGURES, SOYSTATS (2022). Accessed online: http://soystats.com/wp-content/uploads/Soy-Stats-2022-Web.pdf (Accessed on 20 April 2023).
Bhartiya, A., Chandra, N., Pal, R.S., Aditya, J.P. and Bajeli, J. (2017). Comparative yield gaps, economic impact and constraint analysis in front line demonstrations of soybean and black soybean in Uttarakhand hills. Indian J. Agric. Res., 51(5): 483–487.
Kolte, S. J., Awasthi, R.P., and Vishwanath (1987). Assessment of yield losses due to Alternaria blight in rapeseed and mustard. Ind. Phytopathol., 40, 209–211.
Hartman, G.L., Sinclair, J.B., and Rupe, J.C. (1999). Compendium of soybean diseases. American Phytopathological Society, St. Paul, Minnesota, 24–25.
Naveesh, Y.B., Prameela, H.A., Basavaraj, S. and Rangaswamy, K.T. (2020). Screening of Soybean Genotypes to Soybean Yellow Mosaic Virus Disease. Int.J.Curr.Microbiol.App.Sci. 9(3): 2070–2076, https://doi.org/10.20546/ijcmas.2020.903.237.
Agrawal, R. and Mehta, S.C. (2007). Weather Based Forecasting of Crop Yields, Pests and Diseases – IASRI Models. J. Ind. Soc. Agril. Stati.ft., 61(2): 255–263.
Domingues, T., Brandao, T. and Ferreira J.C. (2022). Machine Learning for Detection and Prediction of Crop Diseases and Pests: A Comprehensive Survey. Agriculture, 12, 1350, https://doi.org/10.3390/agriculture12091350.
Montaseri, M., Zaman Zad Ghavidel, S. and Sanikhani, H. (2018). Water quality variations in different climates of Iran: Toward modeling total dissolved solid using soft computing techniques. Stoch. Environ. Res. Risk Assess., 32: 2253–2273.
Satpathi, A., Setiya, P., Das, B., Nain, A.S., Jha, P.K., Singh, S. and Singh, S. (2023). Comparative Analysis of Statistical and Machine Learning Techniques for Rice Yield Forecasting for Chhattisgarh, India. Sustainability, 15(3), 2786.
Wheeler, B.E.J. (1969). An introduction to plant diseases. The English Language Book Society and John Wiley and Sons Limited, London, pp 386.
Pandey, H.N., Menon, T.C.M. and Rao, M.V. (1989). A simple formula for calculating area under disease progress curve. Barley Genet. News, 2(1), 38–39.
Das, B., Nair, B., Reddy, V.K. and Venkatesh, P. (2018). Evaluation of multiple linear, neural network and penalised regression models for prediction of rice yield based on weather parameters for west coast of India. Int. J. Biometeorol., 62(10), 1809–1822.
Dahikar, S.S. and Rode, S.V. (2014). Agricultural crop yield prediction using artificial neural network approach. Int. J. Inov. Res. Electr. Electron. Instrum. Control Eng., 2, 683–686.
Kuhn, M. (2008). Building Predictive Models in R Using the caret Package. J. Stat. Softw., 28, 1–26.
Hastie, T., Qian, J. and Tay, K. (2021). An Introduction to glmnet. https:/glmnet.stanford.edu/articles/glmnet.html.
Khan, Y., Kumar, V., Setiya, P. and Satpathi, A. (2023a). Comparison of phenological weather indices based statistical, machine learning and hybrid models for soybean yield forecasting in Uttarakhand. J. Agromet, 25(3), 425–431.
Khan, Y., Kumar, V., Setiya, P. and Satpathi, A. (2023b). Forecasting soybean yield: a comparative study of neural networks, principal component analysis and penalized regression models using weather variables. Theor. Appl. Climatol., https://doi.org/10.1007/s00704-023-04767-9.
Khan, Y., Kumar, V., Satpathi, A., Setiya, P., Surbhi, K., Nain, A. K., Vishwakarma, D. K., Yradav, K. K., Gacem, A. and Choi, J. R. (2025). Comparative Evaluation of Hybrid and Individual Models for Predicting Soybean Yellow Mosaic Virus Incidence. Scientific Reports. https://doi.org/10.1038/s41598-025-99427-5.
Setiya, P., Satpathi, A., Nain, A.S. and Das, B. (2022). Comparison of weather-based wheat yield forecasting models for different districts of Uttarakhand using statistical and machine learning Techniques. J. Agrometeorol., 24(3), 255–261. https://doi.org/10.54386/jam.v24i3.1571.
Biographies

Yunish Khan is a Teaching Personnel in the Department of Mathematics, Statistics, and Computer Science at G.B. Pant University of Agriculture and Technology, Pantnagar. He holds a Ph.D. in Agricultural Statistics from the Department of Mathematics, Statistics and Computer Science at G.B. Pant University of Agriculture and Technology, Pantnagar. His research focuses on Yield and Disease Severity Forecasting. He has published extensively in reputed journals and serves as a reviewer for several esteemed academic publications. Dr. Khan completed his B.Sc. from VCSGUUHF, Bharsar and M.Sc. from GBPUA&T, Pantnagar. Alongside his academic responsibilities, he remains actively engaged in research, contributing to advancements in his field.

Vinod Kumar is an esteemed Professor in the Department of Mathematics, Statistics, and Computer Science at G.B. Pant University of Agriculture and Technology, Pantnagar. With a distinguished career in academia, he has also held various administrative positions at the university. His research interests include Applied Statistics, Life Testing, Reliability and Bayesian Inference. He has published numerous research papers in reputed journals and actively contributes as a reviewer for many prestigious publications. Additionally, he serves as an Editor-in-Chief, further demonstrating his dedication to the advancement of statistical research.
Journal of Reliability and Statistical Studies, Vol. 18, Issue 2 (2025), 447–458.
doi: 10.13052/jrss0974-8024.1828
© 2025 River Publishers