Fuzzy Reliability Estimation Within a Stress-Strength Framework Incorporating Distortion Functions
K. Sruthi* and M. Kumar
Department of Mathematics, National Institute of Technology Calicut, India
E-mail: sruthikmath@gmail.com
*Corresponding Author
Received 19 March 2025; Accepted 26 October 2025
Abstract
The primary focus of this paper is to present an estimation of fuzzy system reliability for a stress-strength model that accounts for uncertainty in the parameters of the distribution function. A drawback of existing methods in the literature is that they do not consider data uncertainty or fuzziness when estimating system reliability. To obtain a more realistic estimation, it is necessary to incorporate the uncertainty present in real-world scenarios. In this work, we incorporate both a distortion function and data fuzziness to estimate system reliability using the stress-strength model, resulting in a more practical approach. We estimate reliability using a suitable distortion function with fuzzy parameters. Specifically, Power, Dual Power, and Piece-wise Type II distortion functions are considered in conjunction with a standard exponential lifetime distribution. Additionally, we obtain a system reliability estimate under a dynamic stress-strength model using a power distortion function with a fuzzy parameter. Several numerical examples are computed to illustrate our approach to fuzzy system reliability estimation. To demonstrate practical application, an illustrative example using simulated estimates is presented for a real-life problem, the stress-strength reliability of reinforced concrete roofs. Finally, a discussion compares the proposed method to an existing method using numerical values.
Keywords: Stress-strength model, distortion function, membership function, fuzzy reliability estimation.
1 Introduction
In today’s competitive world, especially in manufacturing industries, human thinking and reasoning frequently involve fuzzy information. This information originates from inherently vague human concepts, as our systems are often unable to answer many questions of practical importance with precision. Fuzzy set theory has been able to provide solutions to many of these real-world problems. The word “fuzzy” means “vagueness”; this occurs when the boundary of a piece of information is not precise. Zadeh [17, 18] developed some basic set-theoretic concepts of fuzzy sets and introduced the concept of fuzzy set theory. Zadeh [19] developed the probability measures of fuzzy events. In 1993, Cai et al. [3] developed fuzzy system reliability based on fuzzy state assumption and probability assumption. Singpurwalla and Booker [10] introduced the membership functions and probability measures of fuzzy sets. The concept of stress-strength reliability was introduced by Birnbaum [1] and later developed by Birnbaum and McCarty [2].
Most of the authors in the literature assumed that stress and strength random variables are independent. Domma and Giordano [4] proposed a copula approach in order to take into account the dependence between and . Rao et al. [11] estimated the multicomponent stress-strength reliability of a system when strength and stress variates are drawn from an exponentiated Weibull distribution. Later Zhang [20] proposed a stress-strength time-varying correlation interference model for structural reliability analysis using copulas.
Yazgan et al. [16] have studied the reliability of the stress-strength model in the presence of the fuzziness when the stress and strength variables have weighted exponential distribution with the common shape parameter. Wu [14] proposed a possible attempt on how to apply the fuzzy sets theory to Bayesian system reliability assessment. Taheri and Zarei [12] proposed a new Bayesian approach to system reliability analysis that was developed in the vague environment. Pakdaman and Ahmadi [8] estimated the system reliability in a stress–strength model when the distributions of the stress and the strength random variables are replaced by two distorted distributions. Also studied the conditions to increase the reliability under several distortion functions. The fuzziness in the data is not taken into consideration in their work.
Gaidai et al. [5] introduced a methodology notable for its ability to study the reliability of high-dimensional nonlinear dynamic systems. Their study analyzed both a synthetic wind speed dataset and simulated energy harvester dynamic time series. Luo et al. [7] proposed a highly efficient structural reliability analysis method that couples an active Kriging algorithm with the conjugate first-order reliability method. Shi et al. [9] proposed a novel graph-based neural network framework for accurately and efficiently estimating survival signatures and network reliability. The method incorporates a novel strategy to aggregate feature information from neighboring nodes, effectively capturing the response flow characteristics of networks. Xu et al. [15] proposed a bivariate Wiener model to capture the degradation patterns of two key performance characteristics of permanent magnet brakes and introduced an objective Bayesian method to analyze degradation data with small sample sizes.
The following research gaps were identified through a review of the literature.
• Existing models do not account for the inherent fuzziness and uncertainty present in real-life data and distribution parameters.
• They fail to employ fuzzy distortion functions, which are necessary to process such uncertain data and produce realistic reliability estimates.
Most of the research work in the aforementioned papers estimates system reliability using stress-strength models without incorporating a distortion function and fuzziness. These studies do not account for data uncertainty or fuzziness, which is essential for realistic reliability estimation. This omission represents a significant drawback in existing models. In this paper, we address this limitation by proposing a stress-strength model that integrates both a distortion function and data fuzziness, resulting in a more practical and realistic approach to system reliability estimation.
The rest of this paper is organized as follows. Section 2 gives basic definitions connected with fuzzy numbers and distortion functions. Section 3 deals with the estimation of reliability of the stress strength model using the fuzzy power distortion function (where the parameter of the distortion function is taken as fuzzy). Section 4 deals with the estimation of reliability of the stress strength model using the fuzzy dual power distortion function. Section 5 deals with the estimation of the reliability of the stress strength model using a piecewise-type distortion function, where we consider the parameter of the distortion function as fuzzy. Section 6 deals with dynamic stress-strength reliability using the power distortion function. An illustrative example is discussed in Section 7. A comparison of existing results and new results is given in section 8. Finally, The conclusions and future scope of research are presented in Section 9.
Since existing methods in the literature do not consider data uncertainty or fuzziness, we propose a new model that incorporates both. To obtain a more realistic estimation, it is necessary to incorporate the uncertainty present in real-world scenarios. In our work, we address this limitation by incorporating both a distortion function and data fuzziness into the stress-strength model, resulting in a more practical approach. System reliability is estimated using a suitable distortion function with fuzzy parameters.
2 Some Basic Definitions
In this section, we present some important definitions that will be useful in the following sections to understand the results obtained.
Fuzzy set theory is that it provides a mathematical framework for representing and reasoning with uncertainty, imprecision, and vagueness, concepts that are pervasive in the real world but are poorly handled by traditional binary logic.
A fuzzy set defined on a set is a mapping from to the unit interval denoted by
where is the membership function of the set .
For any an -cut set of denoted by is a classic set defined by
A fuzzy set , defined on , is referred to as a fuzzy number if it is normalized, convex, and piecewise continuous. From this definition we immediately arrive at that the cut set of fuzzy number is an interval. Symbolically,
If the membership function of fuzzy number is determined by
Then is referred to as a triangular fuzzy number, denoted
A distortion function is a mathematical tool that systematically modifies a probability distribution to reflect risk preference or uncertainty. It transforms objective probabilities into subjective measures, making models more realistic for decision-making under real-world conditions.
A function is called a distortion function if the following conditions hold:
(i) is a non-decreasing function on the interval [0, 1],
(ii) and ,
(iii) Except for a finite number of points, exists on the interval [0, 1].
3 Fuzzy Stress-Strength Reliability of a System Using Power Distortion Function
In traditional reliability analysis, the effect of the environment is not considered. In general, reliability of the system is affected by environmental factors. Hence, it becomes necessary to incorporate the influences of such factors while estimating the system reliability. In this section, we assume that the external factors have an impact on the original distribution of the system as a distortion function. That is, under the presence of a distortion function, the lifetime distribution is undergoing a change. Let be the corresponding transformation such that and change to and , respectively, where and . Let the new random variables and have cumulative distribution functions and , respectively. Then, the stress-strength reliability of the system under the transformation is given by
Let the random variable represent the strength of the system with cumulative distribution function and the random variable represent the stress of the system with cumulative distribution function .
Now it is to be observed that the effect of the external factor modelled by the distortion function need not be a simple real-valued function. A large number of applications that come from areas such as applied probability and statistics, reliability, financial economics, insurance, and risk management use reweighted probability distributions. Many methods can be used to transform one probability distribution into another. In this paper, we consider the distortion method of transforming probability distributions, which is discussed by Pakdaman and Ahmadi [8]. The distortion function is also widely used to price insurance risks and in risk management. Wang [13] introduced the class of distortion function, which can be applied to both assets and liabilities. The author recovers the risk-neutral valuation for options by applying the distortion function to stock price distributions.Lin and Cox [6] studied mortality-based securities, such as mortality bonds and swaps, and priced the proposed mortality securities by distortion function. In all these works, the parameter of the distortion function is a real variable, which, in general, is under the randomness and uncertainty in the system. In other words, the distortion force can not be considered as a constant force acting on the system at any given time. Hence, one may not obtain the realistic results. Hence, it is necessary to incorporate this vagueness in the parameters of the distortion function. Therefore, we let the parameter of the distortion function be a fuzzy parameter having some membership function.
Let be the distortion function, where is a triangular fuzzy number with membership function given by
| (1) |
Then, the fuzzy reliability of the stress-strength model using the fuzzy distortion function (see [8] for more details about evaluation of stress-strength reliability using distortion function) is given by
| (2) |
Let be a triangular fuzzy number. We have chosen this simple membership function to keep the problem simple and thereby pave the way for easy understanding. One can choose the membership function depending upon the form of the distortion function and the lifetime distribution of stress and strength. A complicated form of membership function may lead to an intractable reliability expression. As a next step, we estimate the -cut of fuzzy reliability from the -cut of . Let be the -cut of , where and . For a real number , we can evaluate Equation (3). By taking and in Equation (3), we obtain and , respectively. That is, we have
| (3) | ||
| (4) |
Observe from above -cuts of reliability that as varies from to , reliability also varies from to . Thus for a fixed , the estimated -cut for stress-strength reliability is given by
| (5) |
Note that when , the above Equations (3) and (4) reduce to a reliability expression with a distortion function under stress-strength reliability, which is given by
| (6) |
Note that, even though the choice of membership function is simple for the parameter in the distortion function, the integrals in (3) and (4) does not have closed form expression. Hence, we resort to numerical integration for plotting cuts of reliability. And use quadrature method available in matlab for getting approximate integral value. Figure 1 shows the plot of limits of -cut of fuzzy reliability for different values of . Next, study the changes of the stress strength reliability of the system under the distortion function . And examine the difference . Figure 2 shows the limits of -cut of fuzzy reliability difference from original reliability. That is, we have plotted and for various values of . In Figure 2 shows the graph of difference between -cuts of fuzzy reliability and original reliability without distortion function, which is given by
It is noted from the graph that the minimum difference is about , whereas the maximum difference is about for various values of in . Hence, the incorporation of vagueness has a significant advantage in improving the reliability estimate. However, we note that this improvement also depends upon the choice of membership function and the form of distortion function as well. In the following section, we explore this possibility by considering the dual power distortion function and the piecewise type II distortion function.
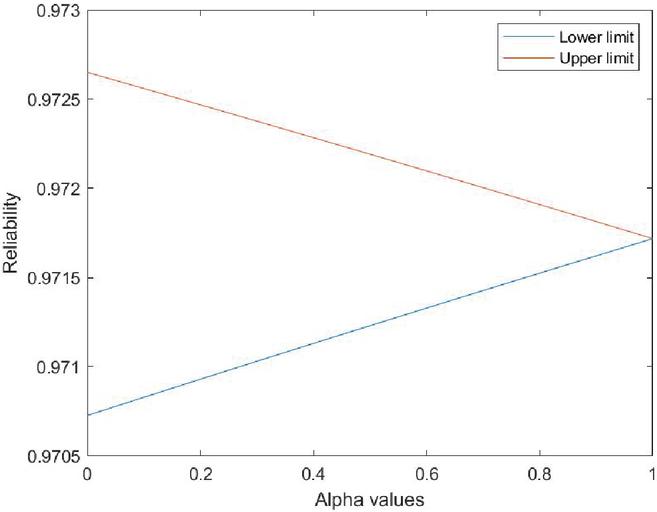
Figure 1 The fuzzy reliability under the power distortion function, for , , and .
Note that for , (when is a real number), our reliability under stress-strength relation with power distortion function is given by 0.9717. Observe that this reliability belongs to (0.9715, 0.972).
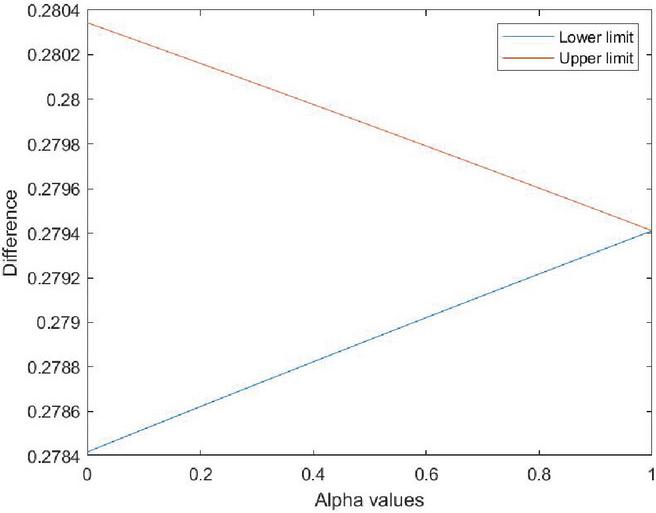
Figure 2 The difference for various values, when , , and .
4 Fuzzy Stress-Strength Reliability Based on Dual Power Distortion Function
In this section, we study the application of the dual power distortion function to evaluate the stress-strength reliability of a system. Let the random variable represent the strength of the system with cumulative distribution function , and the random variable represent the stress of the system with cumulative distribution function
Let be a dual distortion function, where is a triangular fuzzy number with membership function given by
| (7) |
Then, as usual, the fuzzy reliability under the stress-strength model (see [8]) is given by
| (8) |
Observe that this new reliability under the dual power distortion function is the same as the original reliability . Therefore, there is no change in reliability when this distortion function is considered while keeping the membership function for as triangular. Hence, in Section 5, a reliability expression by using a piecewise type II distortion function is presented.
5 Stress Strength Reliability Using Piecewise Type II Distortion Function
In this section, a piecewise type II function is taken as the distortion function. Let random variable represent the strength of the system with cumulative distribution function , and let the random variable represent the stress of the system with cumulative distribution function .
Again, as discussed in previous sections, the effect of external factors need not be expressed in a single real-valued function, and hence we let the parameter of the distortion function be fuzzy. Let be the distortion function, where is a triangular fuzzy number. Then for a real number , we have
| (9) |
and for a real number ,
| (10) |
Now for a real number , the fuzzy reliability of the stress-strength model (see [8]) is given by
| (11) | ||
Now take as a triangular fuzzy number. Estimate the -cut of fuzzy reliability from the -cut of as follows. Let be the -cut of where and . For a real number , we can obtain a value of the integral in (11). By taking and in Equation (11), we obtain values and , respectively, for various choices of . That is, we have
| (12) | ||
| (13) |
Note that as varies from to , reliability also varies from to . Then for the -cut of , the corresponding -cut of reliability will contain values that lie between and . Thus for a fixed , we estimate the -cut for stress-strength reliability as .
Note that when , the above Equations (12) and (13) reduce to a reliability expression with a distortion function under stress-strength reliability, which is given by
| (14) |
Now for , there are two possibilities depending on the value of . We discuss the following two cases.
Case (i). If , then for . Then fuzzy reliability of the stress-strength model (see [8]) is given by
| (15) | ||
Case (ii). if , then for . Let , then fuzzy reliability of the stress-strength model (see [8]) is given by
| (16) | ||
Again, take as a triangular fuzzy number. Estimate the -cut of fuzzy reliability from the -cut of as follows. Let be the -cut of where and . For a real number , we can get an estimate from Equation (15). Now taking and in Equation (15), we get the estimated values, say and , respectively.
| (17) | ||
| (18) |
Similar to the case of , as varies from to , reliability also varies from to . Then for the -cut of , the corresponding -cut of reliability will contain values that lie between and . Thus for a fixed , an estimated -cut for stress-strength reliability is given by .
Note that when , the above equations (17) and (18) reduce to a reliability expression with a distortion function under stress-strength reliability, which is given by
| (19) |
It is to be noted that the most important advantage of using this distortion function here is that the reliability expression in (15) has a closed form and does not require numerical methods to evaluate.Expressions similar to (17) and (18) for the cuts can be obtained under Case (ii) as well.
Figure 3 shows the plot of limits of -cut of fuzzy reliability for different values of . That is, the plot of and for various values of . Figure 4 shows the corresponding fuzzy reliability difference from original reliability . From Figure 4, it is clear that the application of the piecewise type II distortion function with the triangular fuzzy parameter has led to significant improvement in reliability as compared to the ordinary reliability estimate . Observe that the maximum increase is about .
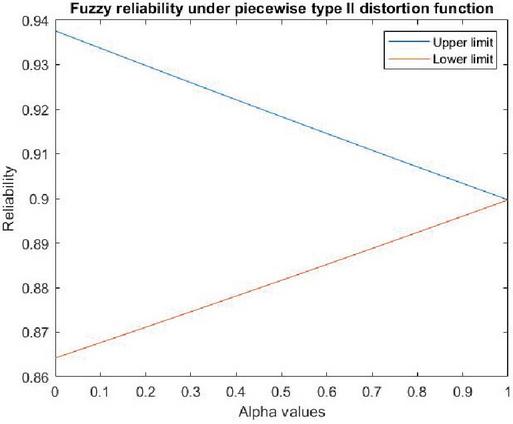
Figure 3 The fuzzy reliability under the piecewise type II distortion function, when , , and .
Note that for , (when is a real number), our reliability under stress-strength relation with dual power distortion function is given by 0.8997.
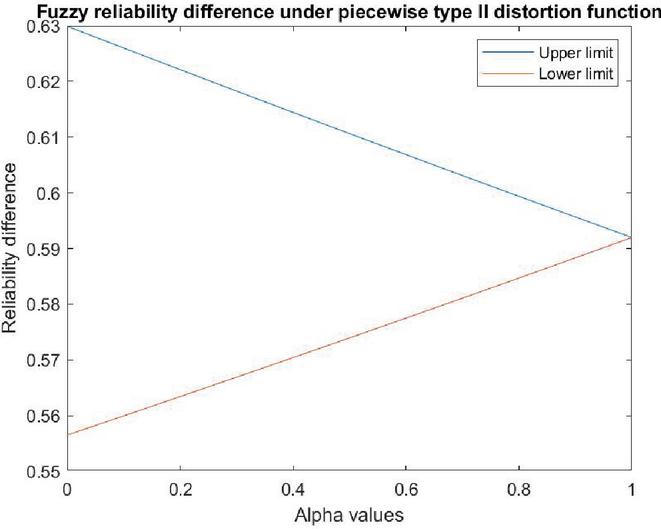
Figure 4 The fuzzy difference for different values under the piecewise type II distortion function, when , , and .
6 Dynamic Stress-Strength Reliability Using Fuzzy Power Distortion Function
Assume that the stress and strength systems have lifetimes and with distribution functions and , respectively. Assume that the systems started at time , and they are alive at time . In this section, we compute the stress-strength reliability of the residual lifetime of the system.
Now, similar to the development of fuzzy reliability expressions in previous sections, to incorporate the environmental factors, which affect the system, we apply the power distortion function as a distortion function, where is a triangular fuzzy number.
As usual in previous sections, let the random variable represent the strength of the system with cumulative distribution function and the random variable represent the stress of the system with cumulative distribution function . By referring to the dynamic reliability of the stress-strength model in ([8]), we define fuzzy dynamic reliability of the stress-strength model, which is given by the following:
| (20) | ||
In the above expression in (20), we have and .
Observe that the integral in (20) does not have a closed-form solution. Hence, we apply the numerical integration technique. We employ the quadrature method available in MATLAB for getting approximate integral value. Figure 5 shows the plotting of limits of -cut of fuzzy dynamic stress strength reliability for different values of . Figure 6 shows the corresponding fuzzy reliability difference from original reliability . Note that the dynamic stress strength reliability without using the distortion function is given by the following expression.
| (21) | ||
In the above expression in (21), we have and .
Therefore, it is observed that the dynamic version of the stress–strength reliability is the same as the usual stress-strength reliability when exponential distribution is considered.
Figure 5 shows the fuzzy residue reliability under the power distortion function when , , , and . Figure 6 shows the fuzzy difference for different values under the power distortion function, when , , , and .
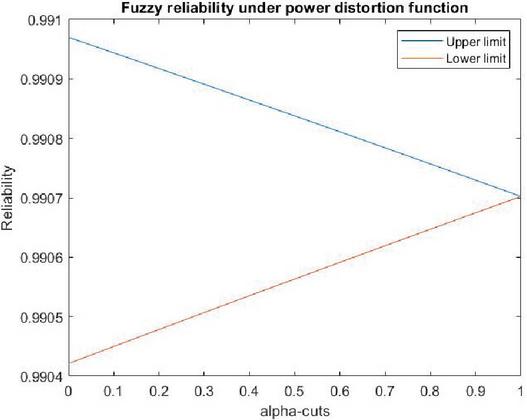
Figure 5 The fuzzy reliability under the power distortion function, when , , , and .
Note that for , (when is a real number), our dynamic stress-strength reliability with power distortion function is given by 0.9907.
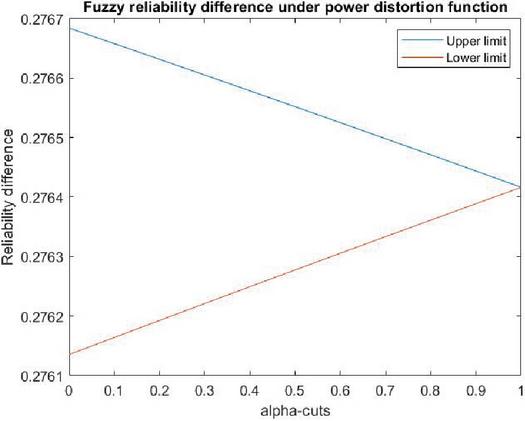
Figure 6 The fuzzy difference for different values under the power distortion function, when , , and .
From Figure 6, it is observed that the minimum growth in residue reliability after incorporating the fuzziness in the data is about .
7 An Illustrative Example
In this section, the result obtained in Section 3 is evaluated using data obtained from a simulation study. The stress strength data are presented in Table 1. The fuzzy distortion function used was , where is a fuzzy number. Practically, in a real-life situation, one can think of evaluating the reliability of a reinforced cement concrete (RCC) roof, where the strength of the concrete is the key factor that determines the duration of the RCC roof, which can withstand the stress acting on it. Also, while evaluating the stress-strength reliability of such a structure, external factors such as temperature play a very important role in determining the reliability of the structure. In this illustrative study, we can take the distortion function, , acting on the structure, which affects the reliability of the structure for a specified duration of time. Note that the parameter can be treated as a fluctuating temperature in a given region where the building structure is constructed, and then the temperature cannot be taken as a fixed real number in practice. Hence, treating as a fuzzy number makes sense in practice. Thus, using simulated data presented in Table 1, we have obtained fuzzy reliability for various values of .
Table 1 Simulated data
| X | 2.2540 | 1.0884 | 22.7004 | 0.9967 | 5.0413 |
| 25.7004 | 14.0618 | 6.6388 | 0.4776 | 0.3932 | |
| 20.3237 | 0.3283 | 0.4816 | 7.9512 | 2.4507 | |
| 21.4800 | 9.4965 | 0.9683 | 2.5623 | 0.4549 | |
| Y | 68.1012 | 2.9901 | 15.1238 | 76.8071 | 42.1853 |
| 19.9163 | 1.4329 | 1.1795 | 60.9712 | 0.9850 | |
| 1.4447 | 23.8535 | 7.3522 | 64.4401 | 28.4894 | |
| 2.9049 | 7.6868 | 1.3646 | 13.9257 | 109.9652 |
We observe from Table 1 that maximum likelihood estimation (MLE) for the stress data is estimated as and MLE for the strength data is estimated as . Next, estimated cuts of fuzzy reliability of the stress-strength model using the power distribution with parameter are presented.
Figure 7 shows the graph of limits of cuts of fuzzy reliability for different values of .
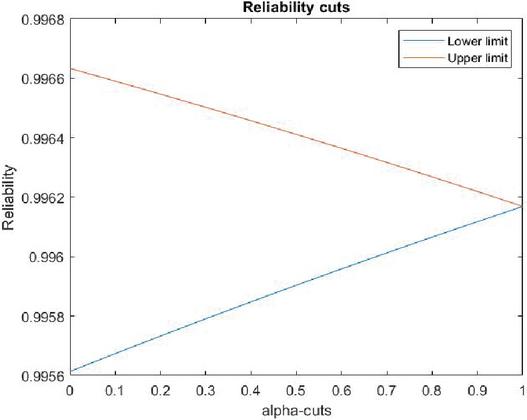
Figure 7 The fuzzy reliability under the power distortion function, when , , and .
When , we obtain real system reliability, which is estimated as 0.9962. We observed that the fuzzy reliability ranges from 0.9956 to 0.9966. Consequently, the difference between the proposed method and the existing reliability method ranges from a minimum of -0.0006 to a maximum of 0.0004. Therefore, the fuzzy reliability method provides a more informative and realistic range of possible values, offering greater detail and a more robust assessment than a single-point estimate.
8 Comparison of Results and Discussions
In previous sections, we have estimated stress-strength reliability under various distortion functions with fuzzy parameters. In this section, we are comparing the difference obtained in [8] and the difference of reliability using the distortion function when the parameter is taken as fuzzy and without the distortion function.
Case (i). System reliability under power distortion function. When we consider the power distortion function with fuzzy parameter with and . The difference is plotted in figure 2. When we take p as the real number p=31 in the result obtained in [8], the difference in reliability is obtained as 0.2794.
It can be observed that Figure 2 gives more information about the difference. Also note that when , the difference is the same as the difference obtained in [8].
Case (ii). System reliability under piecewise type II distortion function. When we consider the piecewise type II distortion function with fuzzy parameter with and . The difference is plotted in Figure 3. When we take p as the real number in the result obtained in [8], the difference in reliability is obtained as 0.5920.
It can be observed that Figure 3 gives more information about the difference. Also note that when , the difference is the same as the difference obtained in [8].
9 Conclusions
A significant drawback of existing methods in the literature is that they do not consider data uncertainty or fuzziness when estimating system reliability. To obtain a more realistic estimation, it is necessary to incorporate the uncertainty present in real-world scenarios. In this work, we address this limitation by incorporating both a distortion function and data fuzziness into the stress-strength model, resulting in a more practical and realistic approach. System reliability is estimated using a suitable distortion function with fuzzy parameters. Specifically, we employ power, dual power, and piecewise type II distortion functions to integrate the impact of external factors and uncertainty into the original distribution. Additionally, we obtain a system reliability estimate under a dynamic stress-strength model using a power distortion function with a fuzzy parameter. Several numerical examples are computed to illustrate our approach to fuzzy system reliability estimation. The advantage of the proposed method is discussed using an illustrative example with simulated data, with reference to estimating the reliability of reinforced cement concrete roofs. Furthermore, the difference between the estimated reliability (incorporating fuzziness and a distortion function) and ordinary reliability is studied. It is noted that reliability experiences significant growth after incorporating fuzziness and a distortion function. A limitation of this work is the use of the exponential distribution, which may not be suitable for all real-world data. Consequently, the results discussed here can be extended to more general forms of distributions, such as the shifted exponential and Weibull distributions. Furthermore, the results of this study can be extended to other forms of distributions, such as the exponentiated Weibull distribution.
References
[1] Z. W. Birnbaum. (1956, January). On a use of the Mann-Whitney statistic. In Proceedings of the Third Berkeley Symposium on Mathematical Statistics and Probability, Volume 1: Contributions to the Theory of Statistics (Vol. 3, pp. 13–18). University of California Press.
[2] Z. W. Birnbaum, and R. C. McCarty. (1958). A Distribution-Free Upper Confidence Bound for , Based on Independent Samples of X and Y. The Annals of Mathematical Statistics, 558–562.
[3] K. Y. Cai, C. Y. Wen, and M. L. Zhang. (1993). Fuzzy states as a basis for a theory of fuzzy reliability. Microelectronics Reliability, 33(15), 2253–2263.
[4] F Domma, and S. Giordano. (2012). A stress–strength model with dependent variables to measure household financial fragility. Statistical Methods and Applications, 21(3), 375–389.
[5] O. Gaidai, J. Sun, and F. Wang. (2024). Energy harvester reliability study by Gaidai reliability method. Climate resilience and sustainability, 3(1), e64.
[6] Y. Lin, and S. H. Cox. (2005). Securitization of mortality risks in life annuities. Journal of risk and Insurance, 72(2), 227–252.
[7] C. Luo, S. P. Zhu, B. Keshtegar, W. Macek, R. Branco, and D. Meng. (2024). Active Kriging-based conjugate first-order reliability method for highly efficient structural reliability analysis using resample strategy. Computer Methods in Applied Mechanics and Engineering, 423, 116863.
[8] Z. Pakdaman, and J. Ahmadi. (2018). Some Results on the Stress–Strength Reliability under the Distortion Functions. International Journal of Reliability, Quality and Safety Engineering, 25(06), 1850028.
[9] Y. Shi, J. Behrensdorf, J. Zhou, Y. Hu, M. Broggi, and M. Beer. (2024). Network reliability analysis through survival signature and machine learning techniques. Reliability Engineering and System Safety, 242, 109806.
[10] N. D. Singpurwalla, and J. M. Booker. (2004). Membership functions and probability measures of fuzzy sets. Journal of the American statistical association, 99(467), 867–877.
[11] G. Srinivasa Rao, M. Aslam, and O. H. Arif. (2017). Estimation of reliability in multicomponent stress–strength based on two parameter exponentiated Weibull Distribution. Communications in Statistics-Theory and Methods, 46(15), 7495–7502.
[12] S. M. Taheri, and R. Zarei. (2011). Bayesian system reliability assessment under the vague environment. Applied Soft Computing, 11(2), 1614–1622.
[13] S. S. Wang. (2000). A class of distortion operators for pricing financial and insurance risks. Journal of risk and insurance, 15–36.
[14] H. C. Wu. (2004). Bayesian system reliability assessment under fuzzy environments. Reliability Engineering and System Safety, 83(3), 277–286.
[15] A. Xu, B. Wang, D. Zhu, J. Pang, and X. Lian. (2024). Bayesian reliability assessment of permanent magnet brake under small sample size. IEEE Transactions on Reliability, 74(1), 2107–2117.
[16] E. Yazgan, S. Gürler, M. Esemen, and B. Sevinc. (2022). Fuzzy stress‐strength reliability for weighted exponential distribution. Quality and Reliability Engineering International, 38(1), 550–559.
[17] L. A. Zadeh. Fuzzy Sets. Inform. Control 8, 1965.
[18] L. A. Zadeh. (1971). Similarity relations and fuzzy orderings. Information sciences, 3(2), 177–200.
[19] L. A. Zadeh. (1968). Probability measures of fuzzy events. Journal of mathematical analysis and applications, 23(2), 421–427.
[20] J. Zhang, X. Ma, and Y. Zhao. (2017). A stress-strength time-varying correlation interference model for structural reliability analysis using copulas. IEEE Transactions on Reliability, 66(2), 351–365.
[21] H. J. Zimmermann. (2011). Fuzzy set theory—and its applications. Springer Science and Business Media.
Biographies

K. Sruthi completed her master’s degree in Mathematics from Government Brennen College, Thalassery, and is currently pursuing a Doctor of Philosophy (Ph.D.) in Mathematics at the National Institute of Technology, Calicut. She is presently working as an Assistant Professor of Mathematics at Government Polytechnic College, Kannur. Additionally, she has published research papers in esteemed journals.

M. Kumar is presently working as an Associate Professor in the Department of Mathematics, NIT Calicut. He received his Ph.D. in applied statistics from IIT Bombay, India. His research interests are reliability estimation and test plans, acceptance sampling plans, fuzzy reliability, and statistical inferences in epidemiology disease models.
Journal of Reliability and Statistical Studies, Vol. 19, Issue 1 (2026), 43–64
doi: 10.13052/jrss0974-8024.1913
© 2025 River Publishers