A Data-mining Based System for Identifying the Injury Severity in Road Accidents
Manisha Verma1,*, Bharti Sharma1 and C. Naveen Kumar2
1Department of Computer Application, Dehradun Institute of Technology, Mussoorie Diversion Road, Makkawala, 248009, Dehradun, Uttarakhand, India
2Department of Civil Engineering, VNR Vignana Jyothi Institute of Technology, Pragathi Nagar, Nizampet, 500090, Hyderabad, Telangana, India
E-mail: mankiishaverma@gmail.com; head.bca@dituniversity.edu.in; doccnk@gmail.com
*Corresponding Author
Received 08 April 2025; Accepted 31 August 2025
Abstract
Road accidents have been among the leading reasons for injury and death globally; this study aims to develop a set of rules that Indian road traffic and safety agencies can specifically utilize to find out the potential reasons leading to accident severity. In this study we used R software to establish classification models -Multi-Layer Perceptron (MLP), Naive Bayes, decision trees, and logistic regression that can accurately predict the severity of injuries. By adopting 2585 road accident records in India from 2013 to 2018, our analysis reveals that the overall accuracy of logistic regression 87.47%, decision tree 91.21%, and MLP 86.05% in predicting injury severity However, Naive Bayes model demonstrated lower accuracy at 75.57% compared to the other algorithms. Finally, to identify the significant factors influencing accident severity, we have further explored the rules by the decision tree algorithm, and based on the findings, highlighted rules and focus areas to reduce the accident severity
Keywords: Road accident, data mining, prediction, modelling.
1 Introduction
In recent times, road traffic accidents have become one of the most serious global threats, significantly contributing to daily reports of deaths, injuries, and casualties on roads and causing heavy socioeconomic losses. According to the “World Health Organization (WHO),” road traffic accidents are estimated to cause about 1.3 million deaths and 20-50 million non-fatal injuries annually. In order to decrease the rate and severity of traffic crashes, more attention should be paid to this serious matter (Taamneh et al., 2017).
Nonetheless, road safety data tend to be extensive, complex, and multidimensional, making it challenging to derive meaningful insights from them. To obtain valuable insights from these large data sets, numerous data mining methods have been utilized, especially in recent times. The classification method is among the most commonly employed techniques, primarily aimed at creating a model for categorization that can predict the severity of a “new” traffic accident. Notably, this model was built with a training dataset comprising data points where the intensity of an event was previously understood. Moreover, the characteristics of the chosen data greatly influence the accuracy of the classification model.
Due to this reality, it is almost impossible to claim that a specific categorization model is essential for any given type of problem. Additionally, these classification techniques are believed to be classified into three groups: rule-based, mathematical, and probabilistic classifiers. Several studies made efforts to evaluate various classifiers prior to choosing which one to implement.
We analyzed the effectiveness of different classification models in assessing the severity of injuries in the event of “new” traffic accidents in India (e.g., moderate, minor, severe, and fatal) based on 2585 road accident data records collected from different cities over a six-year period from 2013 to 2018. we proposed a set of strategies that Indian traffic management and control organizations to identify the primary determinants of collision severity.
2 Literature Review
According to data extracted from Ministry of Road Transport and Highways (MORTH) GOI, more than 100 distinct factors that contribute to road accident severity as a function in an extensive analysis. (Delen et al., 2006; Taamneh et al., 2017; Megnidio-Tchoukouegno and Adedeji, 2023; Moslem et al., 2024).
Earlier studies have examined injury severity using diverse analytical framework including statistical modelling , spatial and temporal analyses and data mining methods. Authors (Newgard et al., 2002; Kashani & Mohaymany, 2011; Taamneh et al., 2017) primarily concentrated on examining the severity of traffic accidents.
Tree-based approaches Chang and Wang (2006) used classification as well as Regression Trees (CART) to study relationship among injury severity, driver attributes, crash characteristics , and environmental variables without assuming a pre specified functional form. Their findings highlighted vehicle type as a key factor and suggested that two-wheeler riders faced higher injury risk than other vehicle users. Chan and Chein (2013) used a similar approach and reported 74% accuracy using 16 attributes. Kashani et al. (2014) applied CART to motorcycle passenger injury severity .
Bayesian Network (BN) approaches. Mujalli and de Ona (2011) demonstrated variable reduction technique feeding into BN models for traffic injury severity, showing that well chosen variable subsets could retain predictive performance Wu et al. (2023) modeled crash severity using BN and identified impact configuration , airbag deployment , number of vehicle involved, rollover, speeding violation and gross vehicle weight as influential
Decision trees and other classifiers Abellan et al. (2013) derived interpretable rules from rural Spain crashdata (Granad, 2003–2009), obtaining 70 salient rules overall, Kwon et al. (2015) compared decision trees and Naive Bayes using California Highway Patrol data across 25 attributes and benchmarked against binary logistic regression ; they found interdependencies among high ranking risk attributes and used incremental gains analysis. Zhu (2021) proposed an imbalanced data mining framework (resampling + gradient boosting + marginal effect analysis) for two wheeler crash factor identification.
The literature shows that numerous variables driver, vehicle, roadway, environment-affect injury severity and that different data mining techniques surface different subsets of influential factors depending on data context. Cross study generalizability is limited because datasets arise from different countries, vehicle fleets, and data collection protocols, This motivates the present study’s India specific comparative modelling and rule extraction effort.
3 Research Methodology
The purpose of this study is to evaluate the comparative effectiveness of four classification methods Logistic Regression, Decision Tree, Naive Bayes, and Multi-layer Perceptron (MLP) – in estimating the severity of injuries in road traffic accidents across different Indian cities during the years 2013 to 2018, and determine the key predictors.
The methodological pipeline comprises: (1) data collection; (2) pre-processing and variable selection; (3) model development; (4) model evaluation via three strategies (train set, 4-fold cross validation, class balance resampling cross validation); (5) knowledge extraction through decision rule analysis.
3.1 Dataset Descriptions
The dataset contains 2,585 road accidents spanning a six-year period (2013 to 2018). Each record initially included 40 variables captured at the time of crash. They were further segregated into 3 distinct categories: road-related, driver-related, and crash-related attributes. Injury severity labels were mapped to four ordered categories : Minor(57%), Moderate (31%), Severe (8%), Fatal (4%). Severe and fatal crashes form a relatively small fraction of all records, creating a class imbalance problem that informed our resampling step.
3.2 Data Pre-processing
We defined injury severity the target variable . All remaining variables served as candidate predictors, preprocessing steps include.
1. Noise and reliability screening: Removed records with missing or clearly erroneous severity labels.
2. Drop Non predictive identifiers: Case description text; victim name; case number; other personally identifying information.
3. Handle rare/unfamiliar severity codes: Mapped to closest valid category or removed if ambiguous .
4. Consolidate high cardinality categorical fields: Grouped infrequent categories (e.g., detailed crash reasons) into broader bins suitable for classification
5. Check Data type harmonization: Converted numeric vs categorical types as needed invariance: Dropped near constant predictors.
Table 1 Final list of selected attributes for model building with their descriptions and categories
| Category | Attributes | Data Type | Description |
| Road | Lighting condition | Nominal | Road lighting at time of crash |
| Road condition | Nominal | Surface condition(wet, dry, greasy, sandy etc) | |
| Lanes | Numeric | Number of lanes | |
| Speed Limit | Numeric | Speed limit(Km/h) | |
| Driver | Gender | Nominal | Gender of driver |
| Age | Numeric | Age of driver | |
| Nationality | Nominal | Driver Nationality | |
| Seat belt | Nominal | Seat belt used (Yes/No) | |
| Injury Level | Nominal | Injury level recorded (Minor/Moderate/Severe/Fatal). | |
| Casualty status | Nominal | Whether injury occurred to driver, passenger or pedestrian. | |
| Accident | Day | Nominal | Day crash occured |
| Time | Nominal | Time | |
| Year | Numeric | Crash year | |
| Accident type | Nominal | Collision type(right angle, rear end, side wipe etc) | |
| Reason | Nominal | Reported contributing factor |
3.3 Model Building
We created a predictive model utilizing the R programming language and four classification algorithms – Naïve Bayes, Logistic Regression, Decision Tree, and Multi-layer Perceptron (MLP) – to evaluate accident severity. The effectiveness of these models was tested through three different approaches. Initially, each algorithm was trained on the dataset to determine its capability in classifying accident severity. To achieve a more comprehensive evaluation, we implemented 4-fold cross-validation, where the dataset was randomly split into four equal parts. In each cycle, one part was used for testing while the other three served as training data. This cross-validation method provided a more dependable and generalizable evaluation of the model’s predictive performance. The third approach involved resampling the training sets to enhance model robustness and improve the handling of imbalanced data.
3.3.1 Logistic regression
The logistic regression model in effect, is a statistical model, extensively adopted for classifying and regressing data. Typically, it is used to predict an event that is represented through a linear combination of both independent and word predictor variables (also referred as the log-odd probability) (Wright, 1995). Odds or odds-ratio has been defined as .
referring to success probability, represented through the equation below:
| (1) |
referred to as logit function.
Probability of an event may be understood as:
| (2) |
in which, may be understood as the intercept, while as a predicator variable’s coefficient.
3.3.2 Decision tree
A decision tree helps in ‘classifying’ and ‘predicting’ datasets. As its name suggests, it’s a tree-like structure, in which the non-leaf nodes refer to an attribute, while the branches refer to the result of a test on a very specific attribute. Finally, the terminal nodes are referred to as a class. In road accidents, these terminal nodes allude to the ‘severity’ aspect of an accident per se. Further, it may be noted that in a ‘decision-tree’ algorithm, data is generally segregated based on an attribute till the time, whole of the partitioned data has pure data (Safavian and Landgrebe, 1991). This data partition may be understood as a set containing multiple observations belonging to the same class. On the other hand, an impure data partition encompasses data of ‘mixed class’. Notably, the algorithm rigorously runs till the point when there’s no impure data partition. The main benefit of the decision tree includes disintegration of complicated decision-making processes compiled into simplified decisions.
3.3.3 Naïve Bayes
Rooted in Bayes’ theorem, Naïve Bayes is a popular machine learning technique employed for classification tasks. The probability of an occurrence can be articulated by utilizing prior knowledge about a situation that could relate to events (Zhang, 2004). The efficiency of performance for a specific node across each class can be attributed to its reliance distribution, which subsequently defines its “local dependence” (Zhang, 2004). We aimed to apply the Naïve Bayes method to build a classifier with a specified collection of training points that had been labeled by class beforehand. In this context, xi denotes a value for attribute Xi, with c being the value of C, and E is depicted as a tuple of values for the attributes (x1, x2, …, xn). In our research, a classifier functions as a mapping that designates a class label to an example, while C denotes the severity of an accident.
According to the Bayes rule, which is based on probability, the likelihood that class c will be among the following examples: E = (x1, x2 …, xn)
| (3) | |
| (4) |
E is classified as the class C = + if and only if
| (5) |
Where is referred to as a Bayesian classifier.
The resulting classifier may be represented by
| (6) |
The function is called as Naïve Bayesian classifier.
3.3.4 Multi-layer perceptron (MLP)
The three layers of the MLP neural network structure – which is a component of machine learning – are input, output, and hidden. Following a sequential connection between these levels, feed-forward data transfer is carried out. We decided to use four hidden layer MLPs to identify mishaps. According to Haykin (1998), the learning process for MLP was carried out by adjusting the weight at the perceptron post-data processing with the amount of error in the output compared to the expected result. This was done using the backpropagation method. Remarkably, e_k (n)=d_k (n)-y_k (n) allows one to understand the degree of error in an output node k in the nth data point, where y is the value produced by the perceptron and d is the desired value.
The node weight is adjusted by correction of minimize error in the entire output, given by:
| (7) |
Using gradient descent, the change in each weight is given by
| (8) |
where yk refers to the output of earlier neuron, and represents the learning rate, used to check that the weight is converged to response, whereby this process of weight is continued up to the last layer to minimize error, and meet targeted value. In this study’s case we have a rectified linear unit (RELU) for the activation function, post which, we perform MLP neural network analysis for accident severity detection problem.
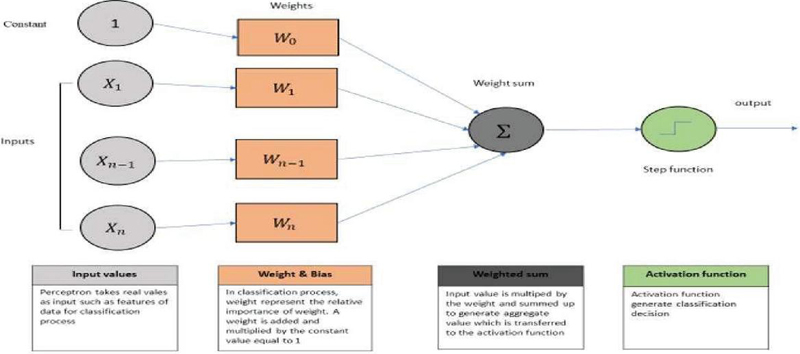
Figure 1 Network architecture of Multi-layer Perceptron.
Knowledge Extraction
To comprehensively identify the primary attributes that directly affect road traffic accident severity, we extracted the rules spawned by the decision tree. They extracted this rule utilizing the whole dataset as a whole training set for each of the algorithms. After that, we organized the rules into four categories based on an accident’s severity. For each class, we only present instructions, which consist of the minimum number of misclassified occurrences, as representing the full spectrum of these instructions is not a viable option. In the subsequent section, we describe the various rules and the information related to methodologies.
4 Model Outcomes and Discussion
A total of 2585 road accident records across different Indian cities over six years (i.e., 2013 to 2018) were used for the analysis. We also used 16 different independent variables and class variables of injury severity to build a classification model for predicting the degree of injury severity in particular road accidents. Our main objective was to identify the most significant variable contributing to road accidents. Road accidents account for huge losses to society and result in numerous deaths, and it is a public health issue of grave concern globally.
Of the estimated 119 million lives lost yearly due to traffic accidents, according to the World Health Organization (WHO, 2023), 20 to 50 million others suffer from serious injuries.
Since these crashes are the leading cause of death for individuals aged 5 to 29, it’s necessary to take action to avoid them.
The issue is particularly poor in India. In 2022, there were 461,312 accidents on the road, which resulted in 168,491 fatalities and injured 443,366 individuals, as per the Ministry of Road Transport and Highways (MORTH, 2023). Despite the fact that just 1% of all traffic fatal accidents globally occur in India, it accounts for nearly 11% of the world’s vehicles. Reasons such as inadequate road conditions, high numbers of vehicles on the roads, disobeying traffic laws, and human error such as speeding, alcohol intoxication, and distracted driving contribute to such high figures (Singh and Mishra, 2021). Nations all over the globe have employed advanced technology to lower traffic accidents. During the process, we utilized the R software to construct the classification model. We trained four classification models to the data: logistic regression, decision tree, Naive Bayes, and MLP. Moreover, in order to have the best performance by the model, it is crucial to determine the set of hyper-parameters at which the model works best. Therefore, we found the hyperparameter and used it for additional analysis. Table 2 shows the list of chosen hyperparameter settings of all of the models. We then explored each of the models’ performance at predicting road traffic accident severity, if only in 3 different strategies. Initially, we applied the entire dataset to the training process. Secondly, we approximated the accuracy of all models based on the 4-folds cross-validation. Thirdly, we resampled the entire dataset in order to eliminate the bias brought about due to the imbalanced accident severity distribution in the dataset and resulting in a more balanced accident severity distribution. The effectiveness of its processing in the prediction process was then assessed using 4-fold cross-validation. Furthermore, we used the rule-generated approach from the decision tree model to investigate the main contributing factors.
Table 2 Model parameters: configuration of all the selected algorithms
| Models | Parameters |
| Logistic Regression | Function = “glm”, family=binomial(link=”logit”), type=”response” |
| Decision Tree | minsplit = 40, minbucket = 13, cp = 0.02, maxdepth = 5 |
| Naïve Bayes | function = “naiveBayes”, prior = NULL, type = “raw”, usekernel=TRUE, fL = 2, adjust = 3. |
| MLP | activation = “relu”, optimizer = “adam”, epochs =100, loss = “binary_entropy”, threshold = “0.11”, batch_size=28, validation_split = 0.2. |
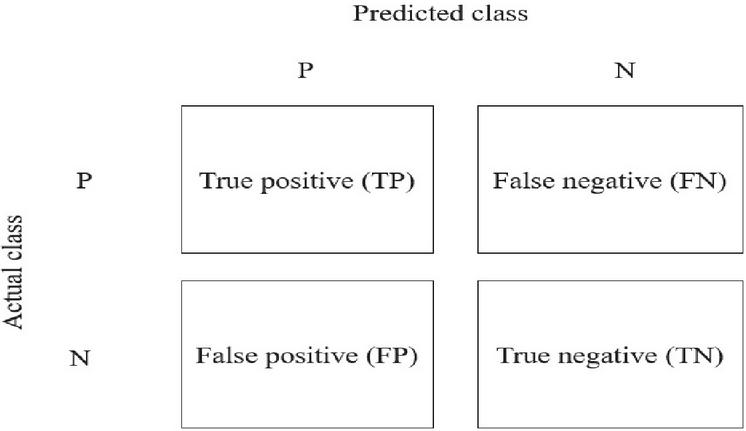
Figure 2 Confusion matrix.
4.1 Model Accuracy
The confusion matrix, which refers to both true and wrong instances of each predicted class, was used to gauge how well the classification model performed. True Positive, True Negative, False Positive, and False Negative are the four distinct cells that highlight the trade-off between the predicted and actual value. Figure 2 shows the 2x2 confusion matrix for a binary classification model, which consists of two positive and negative classes, respectively. It is explained as follows:
Positive examples that the model classifies as such are called True Positives (TP).
False Positives are cases that are negative and that the model classifies as such (FP).
In certain cases, the model may classify positive data as negative, a phenomenon known as TN
False Negative (FN): the model may occasionally classify negative data as positive.
Furthermore, we evaluated the measures used to calculate the classification model’s performance from the confusion matrix constructed by the model. Notably, the most utilized performance index includes the accuracy rate that effectively highlights the percent of correctly classified cases, and is measured as follows:
| (9) |
The Receiver Operating Characteristic (ROC) curve, True Positive Rate (TPR), and False Positive Rate (FPR) are commonly utilized performance metrics for assessing the effectiveness of the classification model for every class. Importantly, in our case, TPR (or recall) is characterized as the ratio of instances identified as positive out of all cases within the positive class. Additionally, it is worth noting that the weighted average of all the recall values, denoted by, can be utilized to assess the overall accuracy of the classification model.
| (10) |
False positive rate, also known as ‘specificity,’ has been defined as the ratio of instances that were initially categorized as positive class, but were effectively associated with the ‘other class’, especially among instances that did not belong to the positive class. The ROC curve, which illustrates the trade-off between true positive and false positive values, is finally recognized to be a plot of the true positive and false positive rate at various threshold values.
| (11) |
Table 3 Logistic regression prediction result
| Rightly | Incorrectly | Processing | |||||
| Injury | Classified | Classified | Accuracy | Time | |||
| Model | Sample | Type | Cases | Cases | (Recall) | AUCs | (Sec.) |
| Logistic Regression | Using Training set | Minor | 1803 | 150 | 92.32% | 0.955 | 0.15 |
| Moderate | 799 | 190 | 80.79% | 0.889 | |||
| Severe | 166 | 44 | 79.05% | 0.732 | |||
| Death | 86 | 25 | 77.48% | 0.774 | |||
| Overall | 2854 | 409 | 87.47% | 0.910 | |||
| Cross-validation (4-Fold) | Minor | 1579 | 188 | 89.36% | 0.864 | 0.20 | |
| Moderate | 781 | 192 | 80.27% | 0.875 | |||
| Severe | 143 | 46 | 75.66% | 0.658 | |||
| Death | 74 | 54 | 57.81% | 0.892 | |||
| Overall | 2577 | 480 | 84.30% | 0.852 | |||
| Resampled training set | Minor | 1850 | 101 | 94.82% | 0.954 | 0.21 | |
| Moderate | 840 | 138 | 85.89% | 0.880 | |||
| Severe | 168 | 56 | 75.00% | 0.781 | |||
| Death | 128 | 14 | 90.14% | 0.990 | |||
| Overall | 2986 | 309 | 90.62% | 0.919 |
Table 3 shows the results of the prediction process for the logistic regression algorithm. We used three approaches to analyze data and build our prediction model. Specifically, our analysis was based on the overall data set that was essentially used as our train set. Moreover, our analysis comprised a 4-fold cross-validation method grounded on the resampling of the training dataset. Notably, we divided crash severity into four distinct classes that included minor, moderate, severe, and death. Logistic regression model classification accuracy grounded on the train dataset for the minor, moderate, severe, and death cases was 92.32%, 80.79%, 79.05%, and 77.48% respectively.
The prediction accuracy of our logistic regression model on the training dataset was around 87.47%. Using 4-fold cross-validation, the overall prediction accuracy was around 84.30%; however, the prediction accuracy for the mild, moderate, severe, and fatal cases was 89.36%, 80.27%, 75.66%, and 57.81%, respectively. This might be mostly due to an imbalance in the data, which affects the overall effectiveness of the classification model. To mitigate this imbalance and enhance the model’s functionality, we resampled our data. Crucially, following data resampling, the model’s prediction accuracy for the mild, moderate, severe, and fatal instances was 94.82%, 85.89%, 75.00%, and 90.14%, respectively. The logistic regression model’s overall prediction accuracy was 90.62%. It is evident from the data that the overall performance of the classification model was significantly enhanced after the resampling process.
Table 4 Decision Tree prediction result
| Rightly | Incorrectly | Processing | |||||
| Injury | Classified | Classified | Accuracy | Time | |||
| Model | Sample | Type | Cases | Cases | (Recall) | AUCs | (Sec.) |
| Decision Tree | Using Training set | Minor | 1900 | 90 | 95.48% | 0.974 | 0.28 |
| Moderate | 888 | 138 | 86.55% | 0.923 | |||
| Severe | 176 | 56 | 75.86% | 0.809 | |||
| Death | 128 | 14 | 90.14% | 0.990 | |||
| Overall | 3092 | 298 | 91.21% | 0.924 | |||
| Cross-validation (4-Fold) | Minor | 1870 | 125 | 93.73% | 0.976 | 0.29 | |
| Moderate | 888 | 148 | 85.71% | 0.932 | |||
| Severe | 166 | 56 | 74.77% | 0.774 | |||
| Death | 123 | 14 | 89.78% | 0.955 | |||
| Overall | 3047 | 343 | 89.88% | 0.909 | |||
| Minor | 1880 | 105 | 94.71% | 0.971 | 0.36 | ||
| Resampled training set | Moderate | 902 | 133 | 87.15% | 0.931 | ||
| Severe | 178 | 56 | 76.07% | 0.816 | |||
| Death | 113 | 23 | 83.09% | 0.948 | |||
| Overall | 3073 | 317 | 90.65% | 0.917 |
The results of the Decision Tree algorithm’s prediction procedure are displayed in Table 4.
The Decision Tree model’s overall prediction accuracy was around 91.21%, while its classification accuracy for mild, moderate, severe, and fatal cases on the train dataset was 95.48%, 86.55%, 75.86%, and 90.14%, in turn. While the prediction accuracy for the mild, moderate, severe, and fatal cases was 93.73%, 85.71%, 74.77%, and 89.78%, respectively, the 4-fold cross-validation prediction accuracy was around 89.88%. The model predicted mild, moderate, severe, and fatal cases with 94.71%, 87.15%, 76.07%, and 83.09% accuracy, respectively, after data resampling. The logistic regression model’s total prediction accuracy was 90.65%. Thus, from our analysis, the overall performance of the classification model was significantly enhanced after the resampling process.
| Rightly | Incorrectly | Processing | |||||
| Injury | Classified | Classified | Accuracy | Time | |||
| Model | Sample | Type | Cases | Cases | (Recall) | AUCs | (Sec.) |
| MLP | Using Training set | Minor | 1770 | 90 | 95.16% | 0.910 | 252.55 |
| Moderate | 678 | 245 | 73.46% | 0.831 | |||
| Severe | 176 | 72 | 70.97% | 0.865 | |||
| Death | 96 | 34 | 73.85% | 0.907 | |||
| Overall | 2720 | 441 | 86.05% | 0.878 | |||
| Cross-validation (4-Fold) | Minor | 1640 | 98 | 94.36% | 0.851 | 302.69 | |
| Moderate | 702 | 344 | 67.11% | 0.941 | |||
| Severe | 156 | 86 | 64.46% | 0.844 | |||
| Death | 96 | 39 | 71.11% | 0.941 | |||
| Overall | 2594 | 567 | 82.06% | 0.894 | |||
| Resampled training set | Minor | 1801 | 72 | 96.16% | 0.917 | 306.59 | |
| Moderate | 701 | 196 | 78.15% | 0.807 | |||
| Severe | 192 | 69 | 73.56% | 0.910 | |||
| Death | 101 | 29 | 77.69% | 0.907 | |||
| Overall | 2795 | 366 | 88.42% | 0.885 |
Table 5 shows the outcomes of the prediction process carried out by the MLP algorithm. The MLP model’s classification accuracy on the training dataset was 95.16% for mild cases, 73.46% for moderate cases, 70.97% for severe cases, and 73.85% for fatal cases. The MLP model’s prediction accuracy, based on the training dataset, was around 86.05%. The prediction accuracy for mild, moderate, severe, and fatal cases was 94.36%, 67.11%, 64.46%, and 71.11%, respectively, whereas the prediction accuracy using the 4-fold cross-validation was around 82.06%. The prediction accuracy of the model for mild, moderate, severe, and fatal cases was 96.16%, 78.15%, 73.56%, and 77.69%, respectively, after data resampling. The total prediction accuracy of the MLP model was 88.42%. From this analysis, the overall performance of the classification model was significantly enhanced after the resampling process.
Table 6 Naïve Bayes prediction result
| Rightly | Incorrectly | Processing | |||||
| Injury | Classified | Classified | Accuracy | Time | |||
| Model | Sample | Type | Cases | Cases | (Recall) | AUCs | (Sec.) |
| Naïve Baye’s | Using Training set | Minor | 1440 | 205 | 87.54% | 0.805 | 0.03 |
| Moderate | 595 | 405 | 59.50% | 0.900 | |||
| Severe | 166 | 79 | 67.76% | 0.854 | |||
| Death | 69 | 45 | 60.53% | 0.795 | |||
| Overall | 2270 | 734 | 75.57% | 0.839 | |||
| Cross-validation (4-Fold) | Minor | 1502 | 185 | 89.03% | 0.826 | 0.02 | |
| Moderate | 605 | 375 | 61.73% | 0.882 | |||
| Severe | 167 | 76 | 68.72% | 0.847 | |||
| Death | 55 | 39 | 58.51% | 0.656 | |||
| Overall | 2329 | 675 | 77.53% | 0.803 | |||
| Resampled training set | Minor | 1550 | 166 | 90.33% | 0.840 | 0.06 | |
| Moderate | 630 | 328 | 65.76% | 0.862 | |||
| Severe | 167 | 53 | 75.91% | 0.767 | |||
| Death | 71 | 39 | 64.55% | 0.767 | |||
| Overall | 2418 | 586 | 80.49% | 0.809 |
Table 6 shows the outcomes of the Naive Bayes algorithm’s prediction process. The classification accuracy of the Naive Bayes model on the training dataset was 87.54% for mild, 59.50% for moderate, 67.76% for severe, and 60.53% for fatal cases. The overall prediction accuracy of the decision tree classifier on the training dataset was around 75.57%. According to the 4-fold cross-validation, the prediction accuracy was around 77.53% overall, with 89.03%, 61.73%, and 61.73% for mild, moderate, severe, and fatal cases, respectively. 68.72%, and 58.51%, respectively.
The prediction accuracy of the selected classification model was 90.33%, 65.76%, 75.91%, and 64.55%, respectively, when the training dataset was resampled for mild, moderate, severe, and fatal cases. In contrast, the logistic regression model’s overall prediction accuracy was 80.49%. It is clear from this data that the resampling procedure greatly improved the classification model’s overall performance. It takes a bit longer to build the MLP classification model than their chosen model. Specifically, it requires around 300 seconds, while decision trees, logistic regression, and Naive Bayes take 0.18, 0.30, and 0.04 seconds, respectively. The prediction accuracy of the logistic regression classifier, decision tree classifier, and MLP classifier in predicting the degree of injuries resulting from a traffic collision using 4-fold cross-validation is nearly same, as shown in Figure 3. However, for the Naive Bayes algorithm case, accuracy was observed less. In contrast, the overall prediction accuracy of all the select classification models was increased after the resampling of the training dataset.
All of the chosen models’ prediction accuracy was evaluated under various conditions using the Receiver Operating Characteristics (ROC) curve. “The discriminative ability of a test is quantified by the area under the ROC curve (AUC).” A totally random test with an AUC of 0.5 is considered a respectable result in this instance, but a test with an AUC of 1.00 is considered the perfect test. Figure 4 shows each class’s ROC curve under different conditions (i.e., utilising a training dataset, cross-validation, and cross-validation with data resampling) for each classifier. The ROC curve in the first case, which involves using the training sampler, shows a better outcome than the second, as the graphic illustrates. However, there is a greater chance of overfitting situations when testing and validating a classification model with the same condition, which would limit the model’s applicability to the used data set. Additionally, by resampling that data, the figure shows that the ROC Curve is superior for mild and moderate instances compared to severe and fatal cases. The logic for this may be explained by the fact that, at just 10% of the data, the number of instances for the death and serious classes is lower than that of other classes. The ROC curves demonstrated that high accuracy may be achieved at a reasonable cost, particularly in severe and fatal instances. Herein, in our case, the Decision tree seems to better perform in comparison to all the other classification algorithms. The logistic regression algorithm on the other hand, seems to be relatively better in terms of accuracy as compared to MLP algorithms across all the conditions.
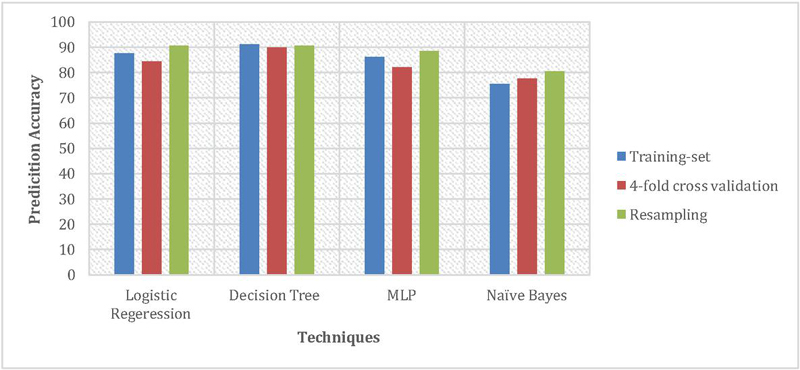
Figure 3 Overall prediction accuracy of various model using different techniques.
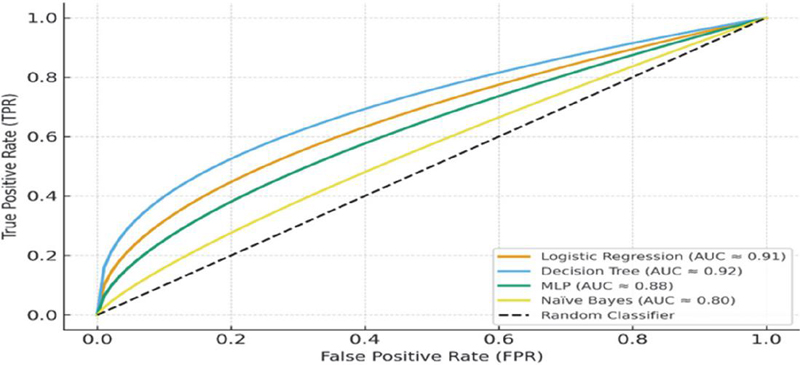
Figure 4 ROC Curves for classification Models.
4.2 Decision Rules Extraction
Though it is restricted to India, our study mainly advances our understanding of traffic accidents. Our research might be useful in developing new strategies to improve road safety, particularly when choosing appropriate measures and allocating funds. The decision tree’s preferred output is displayed in Table 7, where 10, 20, 94, and 145 rules are produced for mild, moderate, severe, and fatal instances, respectively. The most important parameters identified in this investigation are clearly displayed in Table 7. Conversely, Figures 5 through 6 illustrate how each input variable appears in the mild, moderate, severe, and death class regulations.
Table 7 Key decision rules and influential parameters identified by the decision tree model
| Number of | |||
| Severity | Rules | Major Contributing | |
| Class | Extracted | Factors | Decision Rules Summary |
| Minor | 10 | Year, Age, Gender, Road Condition | Minor accidents are often associated with good lighting, dry roads, and drivers aged above 30 years with proper seat belt usage. |
| Moderate | 20 | Speed Limit, Accident Type, Driver Age | Moderate injury cases generally involve side-swipe or rear-end collisions within urban zones, often under moderate speed conditions. |
| Severe | 94 | Collision Type, Seat Belt, Causality Status | Severe injuries commonly result from head-on or right-angle collisions, with non-usage of seat belts being a major contributor. |
| Fatal | 145 | Driver Age (19–30 yrs), Gender, Year, Causality Status | Fatal accidents are primarily observed among male drivers aged 19–30 years, particularly during night hours and high-speed conditions. |

Figure 5 Distribution of Death case severity accident.
Figure 5 shows data relating to the year of an accident, the victim’s age, gender, causality status, and types of collision, which are main splitters in the classification tree. From our analysis, these factors are significant in identifying the severity of injuries in road traffic accidents. People aged between 19 to 30 years are the most susceptible; this is likely logical, given that this age group does, by and large, lack ‘driving’ experience, owing to which they indulge in speed driving. Thus, necessary action needs to be taken to teach this age group on issues pointing to road safety. Interestingly, the year of the accident is a significant variable. Figure 9 illustrated a clear trend in reducing road accidents over time, which may be credited to the new regulation for BSVI Figure 10 shows that drivers are more prone to accidents than pedestrians and passengers. Figure 11 exhibits that men are more frequently involved in road accidents, unlike their counterparts, across all categories of casualty status. However, as shown by the figure, there is a significant dip in the number of road accidents for both men and women within the study period. Figure 12 displays the frequency of road accidents for various collision types. The maximum amount of road accidents mainly happened at the right angles, whereas, based on vehicle type, pedestrian type vehicle was found highest in accident, and then followed by sideswipe, and rear-end collisions. Recognizing the significant attributes that are promptly connected to the injury severity will assist Indian authorities allocate the resources to improve road safety efficiently.
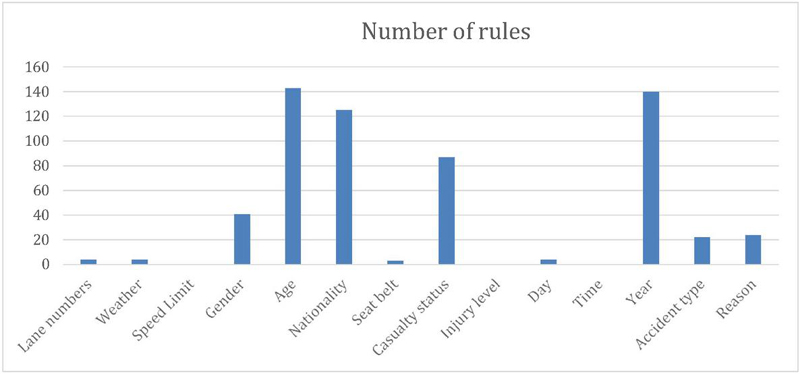
Figure 6 Distribution of Severe case severity accident.
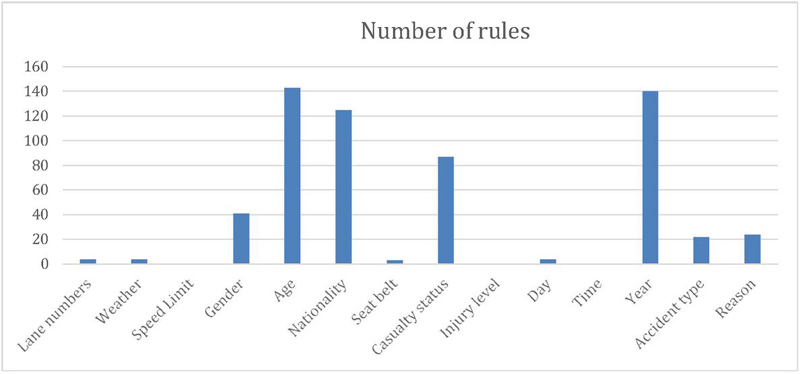
Figure 7 Distribution of moderate case severity accident.

Figure 8 Distribution of minor case severity accident.
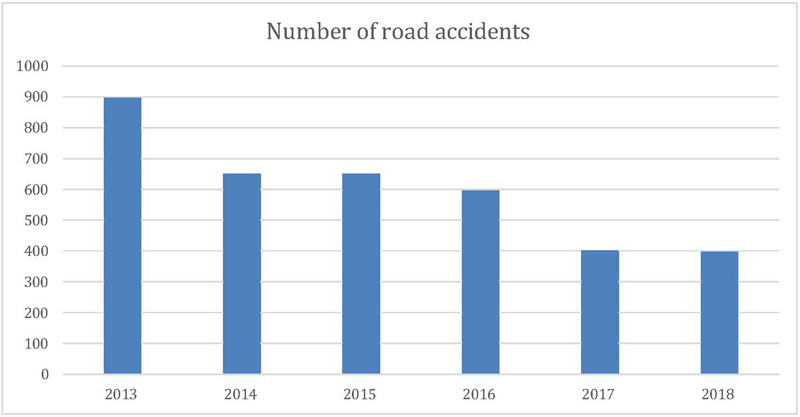
Figure 9 Number of road accidents over 6-year.
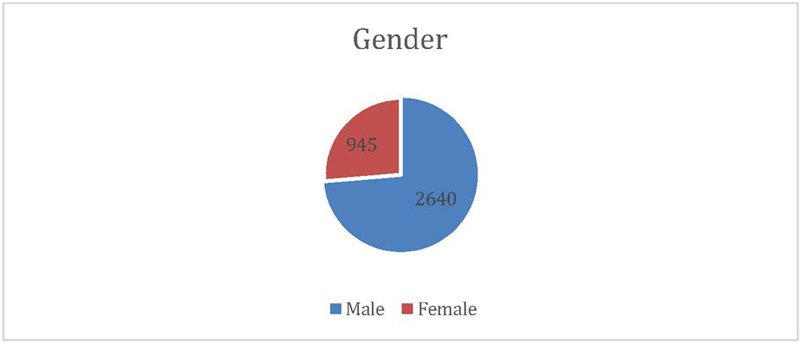
Figure 10 Casualty status vs road accident number.

Figure 11 Gender type vs road accidents number.
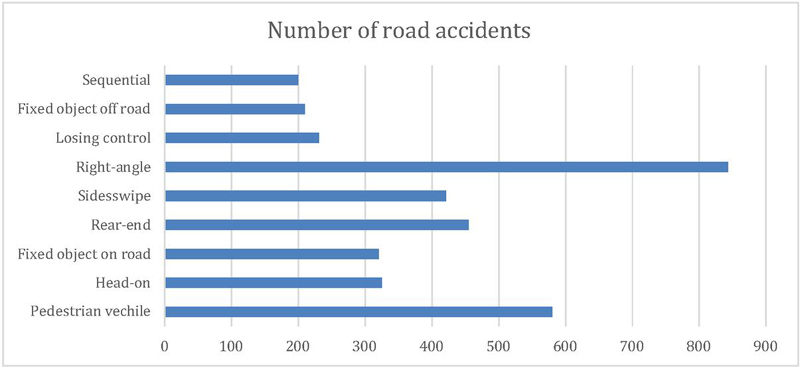
Figure 12 Collision type vs road accidents number.
5 Conclusion
This study demonstrates how well data mining classifiers predict the severity of traffic injuries in India. Among the models performance, decision tree and logistic regression showed strong and comparable performance in cross validation with accuracies of approximately 85–90%. These models somewhat better than the Multilayer Perceptron (MLP) (82% in cross validation, 88% after resampling) and better than Naïve Bayes (78%).
When considering the balance between interpretability and performance, while MLPs excel at capturing intricate, nonlinear patterns, Decision Trees deliver comparable accuracy with the added benefit of generating straightforward, understandable rules. This characteristic makes them particularly valuable for policy development and public safety measures, such as targeting specific age demographics or high-risk crash categories. Analyzing the pruned Decision Tree trained on the complete dataset revealed that variables like Year, Driver Age, Driver Gender, Casualty Status, and Crash Type were significant indicators of more severe outcomes. Young drivers, particularly those aged 19–30, were disproportionately involved in severe incidents, indicating a need for focused road safety education for this group. Furthermore, a decrease in crash numbers in recent years might be associated with policy initiatives like the implementation of Bharat Stage VI (BSVI) emission and vehicle standards, although such conclusions should be approached with caution due to possible reporting inconsistencies. Overall, this research illustrates that integrating predictive modeling with data-driven insights can support evidence-based strategies to enhance road safety in India. Models such as Logistic Regression and Decision Trees not only achieve high accuracy but also offer practical interpretations, especially when combined with methods that address class imbalance. These insights can guide targeted enforcement, educational initiatives, and infrastructure enhancements to lessen the impact of traffic-related injuries and fatalities.
References
[1] J. Abellán, G. López, and J. De Oña, “Analysis of traffic accident severity using decision rules via decision trees,” Expert Systems with Applications, vol. 40, no. 15, pp. 6047–6054, 2013.
[2] L. Y. Chang and J. T. Chien, “Analysis of driver injury severity in truck-involved accidents using a non-parametric classification tree model,” Safety Science, vol. 51, no. 1, pp. 17–22, 2013.
[3] L. Y. Chang and H. W. Wang, “Analysis of traffic injury severity: An application of non-parametric classification tree techniques,” Accident Analysis & Prevention, vol. 38, no. 5, pp. 1019–1027, 2006.
[4] D. Delen, R. Sharda, and M. Bessonov, “Identifying significant predictors of injury severity in traffic accidents using a series of artificial neural networks,” Accident Analysis & Prevention, vol. 38, no. 3, pp. 434–444, 2006.
[5] S. Haykin, Neural Networks: A Comprehensive Foundation, Upper Saddle River, NJ: Prentice Hall PTR, 1998.
[6] A. T. Kashani and A. S. Mohaymany, “Analysis of the traffic injury severity on two-lane, two-way rural roads based on classification tree models,” Safety Science, vol. 49, no. 10, pp. 1314–1320, 2011.
[7] A. T. Kashani, R. Rabieyan, and M. M. Besharati, “A data mining approach to investigate the factors influencing the crash severity of motorcycle pillion passengers,” Journal of Safety Research, vol. 51, pp. 93–98, 2014.
[8] S. Kumar and D. Toshniwal, “A data mining framework to analyze road accident data,” Journal of Big Data, vol. 2, no. 1, pp. 1–18, 2015.
[9] O. H. Kwon, W. Rhee, and Y. Yoon, “Application of classification algorithms for analysis of road safety risk factor dependencies,” Accident Analysis & Prevention, vol. 75, pp. 1–15, 2015.
[10] F. L. Mannering, V. Shankar, and C. R. Bhat, “Unobserved heterogeneity and the statistical analysis of highway accident data,” Analytic Methods in Accident Research, vol. 11, pp. 1–16, 2016.
[11] M. Megnidio-Tchoukouegno and J. A. Adedeji, “Machine learning for road traffic accident improvement and environmental resource management in the transportation sector,” Sustainability, vol. 15, no. 3, p. 2014, 2023.
[12] S. Moslem et al., “A novel spherical decision-making model for measuring the separateness of preferences for drivers’ behavior factors associated with road traffic accidents,” Expert Systems with Applications, vol. 238, p. 122318, 2024.
[13] R. O. Mujalli and J. De Oña, “A method for simplifying the analysis of traffic accidents injury severity on two-lane highways using Bayesian networks,” Journal of Safety Research, vol. 42, no. 5, pp. 317–326, 2011.
[14] C. D. Newgard, R. J. Lewis, and B. T. Jolly, “Use of out-of-hospital variables to predict severity of injury in pediatric patients involved in motor vehicle crashes,” Annals of Emergency Medicine, vol. 39, no. 5, pp. 481–491, 2002.
[15] S. R. Safavian and D. Landgrebe, “A survey of decision tree classifier methodology,” IEEE Transactions on Systems, Man, and Cybernetics, vol. 21, no. 3, pp. 660–674, 1991.
[16] M. Taamneh, S. Alkheder, and S. Taamneh, “Data-mining techniques for traffic accident modeling and prediction in the United Arab Emirates,” Journal of Transportation Safety & Security, vol. 9, no. 2, pp. 146–166, 2017.
[17] World Health Organization, The Global Status on Road Safety, 2018, ISBN: 9789241565684. [Online]. Available: https://www.who.int/publications/i/item/9789241565684.
[18] J. Wu, S. Rasouli, J. Zhao, Y. Qian, and L. Cheng, “Large truck fatal crash severity segmentation and analysis incorporating all parties involved: A Bayesian network approach,” Travel Behaviour and Society, vol. 30, pp. 135–147, 2023.
[19] H. Zhang, “The optimality of naive Bayes,” Aa, vol. 1, no. 2, pp. 3–, 2004.
[20] S. Zhu, “Analysis of the severity of vehicle-bicycle crashes with data mining techniques,” Journal of Safety Research, vol. 76, pp. 218–227, 2021.
[21] A. N. Tripathi and B. Sharma, “Evaluation of a probabilistic framework for traffic volume forecasting using deep learning and traditional models,” International Journal of Experimental Research and Review, vol. 45, pp. 237–250, Nov. 2024.
Biographies

Manisha Verma is a Research Scholar in DIT University. She is having 15 years of teaching and training experience in Business Analytics, Data Science, and Information Technology. She specializes in tools such as Python, R, Tableau, Power BI, and RapidMiner, and has guided numerous student projects and internships. She holds an M.Tech in Computer Science, is currently pursuing Ph.D. in Computer Science Engineering from DIT University. Her research includes publications on machine learning models for accident prediction, market basket analysis, and web application security. She is passionate about mentoring students, integrating practical tools.

Bharti Sharma earned a PhD in Computer Science and Engineering from Uttarakhand Technical University, Dehradun. She is serving the DIT University Dehradun, as the Associate Professor and HoD – CA department. She has 21 years of rich experience in academics and research. Her research work is mainly associated with Natural Language Processing (NLP), Intelligent Transportation Systems (ITS), Big Data Analytics, Machine Learning and respective application domains. In her research work, her team is mainly engaged in the development of intelligent computational models using Machine Learning methods to solve various challenging problems related to transportation and other relevant areas. She has credited her authorship in various quality publications in International Journals, Conferences and Book Chapters. Presently, she is also serving as Editor in many Research Books. She has also served as the Keynote Speaker, Technical and Program chair committee member in many international conferences. Also, she is an active reviewer in various reputed international journals and conferences. She also has a rich experience in conducting Faculty Development Program (FDP) and workshops at National level.

C. Naveen Kumar is an experienced highway design engineer and academic with over 16 years in transportation consultancy and teaching. He is a CRRI Certified Road Safety Professional and has completed the Road Safety Professional Course from the Institute of Transportation Engineers (ITE), Florida, USA. Currently serving as an Associate Professor at VNR VJIET, Hyderabad, he teaches and guides projects in road safety, traffic management, and transportation engineering at both undergraduate and postgraduate levels. Dr. Kumar has worked extensively as a Traffic and Transportation Expert cum Road Safety Consultant on major national and international infrastructure projects funded by NHAI, ADB, and state governments, covering more than 3,600 km of highways in India, the UAE, and Jordan. His expertise includes road safety audits, accident data analysis, intersection design, black spot mitigation, and smart city projects. He is proficient in Civil 3D, VISSIM, StormCAD, R, and Python for advanced design and simulation applications.
Journal of Reliability and Statistical Studies, Vol. 18, Issue 2 (2025), 419–446.
doi: 10.13052/jrss0974-8024.1827
© 2025 River Publishers