A Piecewise Smooth Approach to Modeling Innovation Adoption Under Time-Varying External Influences
Khushboo Garg1, Mohammed Shahid Irshad2,*, Ompal Singh1 and Rajiv Chopra3
1Department of Operational Research, Faculty of Mathematical Sciences, University of Delhi, Delhi-110007, India
2Anil Surendra Modi School of Commerce, SVKM’s NMIMS deemed to be University, Mumbai-400056, India
3Delhi College of Arts and Commerce, New Moti Bagh, Netaji Nagar, New Delhi, Delhi 110023, India
E-mail: gargkhushboo45@gmail.com; mohammedshahid.irshad@gmail.com; drompalsingh1@gmail.com; rajivchopra@dcac.du.ac.in
*Corresponding Author
Received 04 June 2025; Accepted 02 December 2025
Abstract
Innovation diffusion modeling plays a crucial role in understanding how new technologies, products, or ideas spread through a population over time. Classical approaches such as the Bass model assume smooth and continuous adoption patterns, which often fail to capture abrupt changes caused by market dynamics, technological disruptions, or policy interventions. This study develops a piecewise smooth diffusion framework that extends the Bass innovation diffusion model to incorporate random shifts across different time intervals. The framework introduces modulation functions that allow both gradual transitions and abrupt perturbations in adoption rates, thereby reflecting the non-linear dynamics of real-world diffusion. Stability analysis is conducted to examine the robustness of the system. The model is applied to historical datasets on cassette sales, compact discs, and physical video records. Empirical evaluation demonstrates that the piecewise approach provides superior fitting accuracy compared with standard Bass formulations, while also reducing parameter estimation errors. The findings highlight the value of modeling random shifts in diffusion processes, offering new insights for understanding technology substitution and for designing adaptive marketing and policy strategies.
Keywords: Adoption rates, bass model, innovation diffusion process, piecewise smooth function.
1 Introduction
Innovation diffusion, the process by which new products and technologies spread within a population, has long been studied as a cornerstone of marketing science and innovation research. Classical theories emphasize a gradual, cumulative adoption pattern, where innovators and early adopters initiate a trajectory that ultimately reaches the majority of the market (Rogers, 2010). The Bass model (Bass, 1969) formalized this idea mathematically, generating the well-known S-shaped adoption curve that has since been widely applied across industries ranging from consumer goods to high technology.
Yet, real-world adoption rarely unfolds as a smooth, monotonic process. The phenomenon of “rise, fall …and rise again” is observed in numerous industries, reflecting growth phases punctuated by periods of decline, stagnation, or resurgence. Sales trajectories of durable goods, consumer electronics, and cultural products often reveal multiple waves of adoption, corresponding to successive cohorts of consumers, technological substitutions, or external disruptions. For example, Golder and Tellis (2004) demonstrated that only a minority of product categories conform strictly to the classical S-curve, with many instead following cycle–recycle or scalloped shapes. Similarly, Chandrasekaran and Tellis (2007) documented complex, multi-peak patterns in the life cycles of consumer technologies, underscoring the limitations of models that assume fixed, smooth adoption dynamics.
These deviations arise from a wide array of influences. Internal drivers such as psychological readiness, organizational resources, perceived usefulness, and innovativeness remain crucial generally for determining the underlying pace of adoption (Agarwal et al., 2018; Rahman & Thill, 2023). However, external factors including policy interventions, economic shocks, regulatory reforms, social disruptions, mass media exposure and marketing strategies accelerate, decelerate, or reverse adoption trajectories. Empirical models and case studies confirm that external shocks or interventions frequently explain the “bumps” or “waves” in real-world diffusion patterns (Mahajan & Muller, 1990; Peres, Muller, & Mahajan, 2010). For instance, Coccia (2020) highlights how institutional reforms and democratization shape innovation diffusion across nations. In the context of green technologies, regulatory pressure and subsidies significantly affect adoption rates, as shown in environmental policy studies (e.g., Li & Rao, 2023; Anand et al., 2025). More recently, electric vehicle adoption has surged in markets where governments introduced incentives and infrastructure investment (Pti, 2024), while industries such as gaming experienced abrupt declines in physical product sales during the COVID-19 pandemic due to supply chain disruptions (Sony, 2024). These cases illustrate that adoption dynamics are deeply embedded in – and frequently perturbed by – external environments.
Traditional diffusion extensions have attempted to capture such effects by explicitly linking adoption to decision variables like advertising, pricing, and promotion. These adjustments are effective levers for shaping product adoption but their effectiveness depends on consumer attitudes, market context, and the quality of information provided (Darke & Chung, 2005; Zhao et al., 2021; Niu et al., 2024). Further, these approaches only address “explainable variations” under managerial control – data dependent and remain limited in capturing abrupt and random adoption shifts. In contrast, unanticipated and exogenous changes – ranging from macroeconomic crises to geopolitical events – remain difficult to incorporate into conventional models. Addressing this gap requires a framework that can dynamically adjust adoption intensity as external conditions evolve.
The present study contributes to this need by proposing an extended diffusion model that incorporates a modulation function to account for external influences on adoption. By allowing adoption parameters to vary over time – whether gradually or abruptly – the model captures turning points, multi-peak cycles, and non-monotonic behaviours in product life cycles (PLCs). Both constant and continuous piecewise functional forms are implemented to distribute adoption momentum smoothly across phases. This extension not only enhances descriptive accuracy but also provides managers and policymakers with a more realistic tool to anticipate shifts in market dynamics. The specific objectives of this paper are as follows:
• To develop a piecewise smooth innovation diffusion model that systematically incorporates random shifts due to factors.
• To empirically validate the model using historical datasets on cassette sales, compact discs, and physical video records.
• To compare model performance with classical Bass and related extensions, evaluating improvements in accuracy and parameter stability.
• To derive managerial and policy implications for forecasting characterized by uncertainty.
The remainder of the paper is organized as follows: Section 2 reviews the literature on innovation diffusion and piecewise modeling approaches. Section 3 presents the modeling framework and stability analysis. Section 4 provides empirical illustrations. Section 5 discusses results, implications, and future extensions whereas conclusion is framed in Section 6.
2 Literature Review
The study of innovation diffusion originates from the seminal work of Rogers (2010), who conceptualized how innovations spread among populations. Building on this foundation, Bass (1969) introduced the Bass Innovation Diffusion Model (IDM), which explains adoption as a function of innovation (external influence) and imitation (internal influence). While the Bass model has become one of the most widely applied tools for forecasting adoption trajectories, several limitations restrict its applicability.
First, the assumption of population homogeneity oversimplifies real-world diffusion, where adoption often unfolds through clustered or network-driven interactions rather than uniform mixing (Bemmaor & Lee, 2002; Fibich & Golan, 2023; Jha et al., 2008). Second, the assumption of static market potential fails to account for demographic shifts, technological advances, or policy interventions that alter the size of the addressable market over time (Wang et al., 2017; Zhang et al., 2020). Third, the model is less suited for services or repeat-purchase contexts involving cycles of adoption, dis-adoption, and re-adoption (Saeed et al., 2020; Øverby et al., 2022). Fourth, it excludes the influence of marketing and external shocks – such as advertising, pricing, online reviews, or macroeconomic conditions – that are increasingly central to adoption dynamics (Zhang et al., 2020; Cosguner et al., 2022). Finally, parameter estimation remains a persistent challenge, as reliable estimates of market potential and adoption coefficients are often unstable when data are limited, truncated, or perturbed by shocks (Kim et al., 2015; Massiani, 2015; Liang, 2021). Among these limitations, parameter instability and the exclusion of external drivers are particularly critical, underscoring the need for extended models that better capture the complexity and dynamism of modern innovation environments.
Several extensions and adaptations of the Bass innovation diffusion model have been developed to incorporate external drivers such as advertising, price, government incentives, and distribution, enhancing the model’s ability to capture real-world adoption dynamics. Nonlinear and Generalized Bass models introduce these external influences as time-varying parameters, allowing for a more realistic representation of marketing campaigns, pricing changes, and policy interventions. Research demonstrates that the cumulative effect of such drivers is critical for achieving full adoption and reaching the maturity stage of a product’s lifecycle (Kumar et al., 2020; Oliinyk et al., 2018; Bass et al., 1994). Policy-driven models, especially in high-investment or regulated sectors, show that government incentives and subsidies can accelerate adoption and stabilize adoption patterns, as seen in cross-country diffusion studies of renewable energy technologies (Guidolin et al., 2010). Similarly, marketing mix extensions that integrate advertising, price, distribution channels, and information flows – including word-of-mouth, online reviews, and search trends – have been shown to improve forecast accuracy and better reflect real-world adoption dynamics (Ramírez-Solís et al., 2022; Takahashi et al., 2024).
To capture non-linearities in diffusion, researchers have also introduced shock functions and change-point approaches. Min-Hi (2006) modeled abrupt changes in adoption rates by incorporating shocks affecting market potential, though assuming constant intensity for tractability. Guseo, Dalla Valle, and Guidolin (2007) applied exponential shock functions in the context of world oil depletion, demonstrating the adaptability of diffusion models beyond marketing. Kapur et al. (2007) introduced change-point models, where structural breaks modify model parameters across time intervals, and such approaches have since been applied in reliability engineering, software, and social media analytics (Huang et al., 2011; Irshad et al., 2019). Building on this line, Schweidel and Fader (2009) proposed a two-state adoption model transitioning from initial exponential purchases to an Erlang-2 distribution, improving sales forecasts, while Yu and Tseng (2015) developed a fuzzy piecewise logistic growth model that identifies significant change-points and provides confidence intervals for predictions. Parallel work in reliability engineering, such as the load-sharing and bathtub-shaped fault removal models by Gurov and Utkin (2012, 2014) and Peng, Liu, and Wang (2016), further illustrates the utility of piecewise functions to model complex, real-world systems. Further, stochastic and piecewise approaches have been extended to capture consumer behavior and technological substitution, accommodating external shocks like policy changes or competitor actions (Niu, 2006; Kapur et al., 2019; Panwar et al., 2019).
The reviewed literature demonstrates significant progress in extending the Bass model through marketing variables, shock functions, and change-point modeling, as well as through parallels drawn from reliability theory. However, existing approaches are often tailored to specific contexts and lack generalizability and produce statistically unstable estimates due to complex parameterizations. This study addresses these gaps by proposing a piecewise smooth innovation diffusion model that systematically incorporates random shifts due to internal and external factors. The framework unifies concepts from diffusion modeling and reliability engineering, while explicitly accommodating PLC deviations. Stability analysis ensures robustness, and empirical validation on multiple music technology datasets (cassette, compact disc, and video formats) demonstrates both practical applicability and statistical improvements over traditional Bass-based approaches.
3 Modelling Framework
Notation
| Total market size | |
| Innovation effect (external influence i.e., mass media) | |
| Imitation effect (internal influence i.e., word-of-mouth) | |
| The cumulative number of adopters by time t | |
| Modulation function reflecting time varying external conditions. | |
| Cumulative modulation function representing the integrated effect of over time. | |
| Piecewise adoption intensity parameter for the i-th interval | |
| Change points / boundaries of piecewise intervals | |
| T | Total time horizon |
| Heaviside (step) function |
3.1 Modelling Framework
Bass model (1969) is broadly utilized to forecast adoption of high technological products among the consumers. The model is based on the assumption that the total number of adopters by any time is proportional to the total number of non-adopters left in the population. Further, the conversion rate from the non-adopters to adopters is assumed to be a pressure function based on the theory of innovators and imitators (Lee, Trimi and Kim, 2013). The corresponding differential equation is given by:
| (1) |
The coefficient of innovation p reflects the probability of adoption due to external influences such as mass media or public campaigns, while the coefficient of imitation q captures adoption driven by internal social contagion (word-of-mouth). As clarified by Mahajan, Muller & Bass (1990) and Van den Bulte & Stremersch (2004), p is associated with external drivers that act independently of prior adopters, whereas q depends on the proportion of existing adopters and hence represents internal influence. Therefore, p and q are not counts of adopters or non-adopters, but parameters that regulate the flow of adoption from the potential adopter pool .
The standard Bass diffusion model assumes a constant environment, with adoption dynamics fully characterized by the innovation and coefficients. However, real-world diffusion processes are often subject to sudden environmental shifts – for example, policy interventions, technological disruptions, or supply-side shocks – that invalidate the constant-environment assumption. In such cases, adoption dynamics evolve in regime-dependent ways. Accordingly, the coefficients of innovation and imitation are defined as time-varying functions modulated by , a function that encapsulates the temporal influence of environmental factors on the diffusion dynamics. Hence, coefficients of innovation and imitation takes the form:
| (2) |
where for .
Using Equation (2), Equation (1) can be transformed into:
| (3) |
where is the cumulative adoption fraction and encodes environmental perturbations. To explicitly capture these structural breaks, is modelled as a piecewise modulation function that scales the adoption intensity over time. Instead of treating shocks as random noise they are represented as structural changes in adoption regimes. Formally, the time horizon is partitioned into sub-intervals where and . Within each regime, follows a parametric form (e.g., exponential decay, uniform constant stress), while across regimes it may shift discontinuously at change points . This construction parallels classical change-point models in econometrics (Bai & Perron, 2003), ensuring theoretical legitimacy.
| (4) |
Solving the Equation (3) with initial conditions , a generalized form for the cumulative number of adopters at any time t under regime specific changes can be obtained as follows:
| (5) |
To preserve analytical tractability and avoid discontinuities in the diffusion trajectory, the cumulative modulation function is constructed as a piecewise smooth function. This ensures that regime shifts are accommodated while maintaining global continuity of the adoption curve. Formally,
| (6) |
Since the adoption dynamics are influenced by regime-dependent environmental shifts, the cumulative modulation function can be formulated as a piecewise function. Each regime is represented by a generalized Heaviside (step) function:
| (7) |
Within this framework, the cumulative modulation function can be expressed as a sum over all sub-intervals , such that
| (8) |
Or
| (9) |
where defines the adoption intensity within the i-th regime, and the Heaviside functions ensure that shifts between regimes occur precisely at the change points . This construction allows the model to capture both gradual and abrupt variations in adoption dynamics induced by environmental factors.
Therefore, the final expression for the cumulative adoption of innovation is written as:
| (10) |
where p and q are the baseline innovation and imitation coefficients, respectively. This formulation preserves the piecewise structure of environmental influences while providing a mathematically tractable expression suitable for both analytical and numerical evaluation, enabling precise modeling of multi-peak, non-monotonic adoption patterns.
3.2 Parameter Bounds and Normalization Assumptions
In modeling adoption with piecewise extensions of the Bass framework, it is necessary to impose natural bounds on the parameters and modulation function to ensure interpretability and statistical stability.
The modulation function , which redistributes adoption intensity across phases, is constrained to lie within the normalized range . This ensures that behaves as a probability-like weight rather than an uncontrolled scaling factor. Mapping each segment to a fraction of progress , or equivalently representing as a probability density function (e.g., exponential kernel), guarantees that the contribution of each segment is bounded and interpretable.
Allowing to exceed unity or vary arbitrarily introduces redundancy: multiple combinations of can replicate the same adoption curve. This redundancy leads to strong parameter correlations, inflated confidence intervals, and unstable estimates. By bounding , unnecessary degrees of freedom are removed, overfitting to random fluctuations is prevented, and statistically efficient estimates of the diffusion parameters are obtained. The coefficients p and q are restricted to be strictly positive . Here, captures the innovation effect (spontaneous adoption due to advertising, external push, or curiosity), while q captures the imitation effect (social contagion and word-of-mouth). When multiplied by , both innovation and imitation intensities vary across time segments, allowing the model to flexibly accommodate real-world shocks and rejuvenations. Negative or unbounded values would contradict the behavioural interpretation and destabilize the adoption process. The market size parameter is assumed to be finite and strictly positive . This prevents unbounded growth and ensures that cumulative adoption is limited by realistic demand conditions.
3.3 Different Forms of w(t)
For illustration of the working formula (10), two exclusive scenarios have been modeled below:
Model 1: Constant Piecewise Modulation Function
A constant piecewise modulation function is defined as a function that takes constant values over specified intervals of time. It assumes that the modulation effect remains constant within specified intervals but changes abruptly at the boundaries of these intervals. This type of function is particularly useful for modeling scenarios where external influences remain stable for certain periods before abruptly changing. For Example: A government introduces periodic incentives/subsidies or a product experiences demand surges during regulatory or seasonal shocks or Marketing Campaigns – A company runs distinct marketing campaigns during specific periods. The constant modulation function is given by:
| (11) |
Firstly, assume there occur one turning or change point between the time horizon of the diffusion process, during which the adoption rate either increases or decreases. In such environment, the total adoption of the innovation by time t is given by:
| (12) |
Suppose, there occur multiple break points ‘’ during which the adoption rate changes at time points respectively. The cumulative adoption of an innovation at time t is given by:
| (13) |
Model 2: Continuous Piecewise Modulation Function
A continuous piecewise smooth modulation function is defined as a function that is continuous within specified intervals but may have different functional forms across these intervals. By being piecewise continuous, it allows for different growth or decay rates in different intervals of time, reflecting changes in external conditions or interventions. This type of function is suitable for modeling scenarios where external conditions change gradually over time. Hence, it is assumed that the modulation function follows an exponential distribution i.e., . Of late, this distribution has found to be suitable to model the economic or technological shocks inhibit in the underlying process.
Firstly, assume there occur only one turning point during which the adoption rate changes due to external environment. Then, the cumulative adoption function takes the form:
| (14) |
Further, for the case when there occur more than one change points, let’s say, the adoption rate changes ‘n’ times during the diffusion process at time points respectively. Then, the cumulative adoption function takes the form:
| (15) |
The above models has been discussed in the numerical illustration i.e., Section 4. In next sub section, stability analysis of the proposed approach has been done.
3.4 Stability Analysis
The stability analysis helps identify conditions under which adoption begins or stalls and provides guidance on strategies to influence these conditions effectively. Understanding these dynamics allows marketers, policymakers, and businesses to tailor their approaches to promote or sustain the adoption of new products and technologies.
To find the equilibrium points, the rate of change is set to be zero:
| (16) |
This results in potential equilibrium points at and when . To analyse the stability of these equilibrium points, linearization around each equilibrium point is performed:
| (17) |
The general approach to linearization involves computing the derivative of the right-hand side of the differential equation with respect to :
| (18) |
Evaluating at Equilibrium Points:
1. At :
The stability condition depends on the sign of :
∘ If , then , indicating that is unstable.
The system is likely to move away from zero adoption. This could be due to strong social influences (high q) compared to the intrinsic value of the innovation (lower p). Initial adopters quickly influence others, leading to a rapid increase in adoption.
∘ If , then , indicating that is stable.
Initial adoption is slow or non-existent, potentially due to high initial costs, lack of awareness, or insufficient intrinsic value. There is less likelihood of adoption spreading purely by imitation.
2. At :
∘ Since and are typically positive, , indicating that is stable. This stability suggests that once the product reaches saturation, the market will not easily revert to a non-adoption state, indicating strong product retention and sustained market presence..
This detailed stability analysis shows that the equilibrium points and have different stability characteristics depending on the parameters and , with physically reasonable nonnegative , and positive , is typically unstable (so adoption will start) and is globally attractive (the market saturates).
4 Numerical Illustration
To validate the model on real-world data, historical datasets from the US recorded music industry – covering sales volumes across different formats – were utilized. These datasets span complete product life cycles, capturing the full trajectory of adoption and diffusion. Through the history of music industry, two most useful music record formats before non-physical format (download music) can be acknowledged. These were: Cassettes, Compact Disc. After that, there came video concept of music; the sales of video formats in comparison of audio were not much high but requires a special place in the evolution of music industry. The data of these recorded music sales have been fetched from RIAA (U.S. Music Revenue Database – RIAA, 2023). The first dataset (DS-1) corresponds to the cassette sales (in million units), second database (DS-2) corresponds to the compact disk database and the third dataset (DS-3) corresponds to the sales of physical music records of music videos (in million units). The respective PLCs of these datasets give an idea for how long the respective technology remains relevant through the continued use of it. Hence these datasets are selected. It is important to note that while the Bass model was originally developed for durable goods, prior literature has successfully applied it to music formats (Boswijk & Franses, 2005; Guseo & Guidolin, 2015).
The number of change points was determined using a balance between model fit and parsimony. However, in order to prevent overfitting and preserve interpretability, the maximum number of change points are restricted to two for DS-2 and 3, and three for DS-1. This choice is consistent with the observed changes in the adoption curve and corresponds to meaningful regime shifts. Models with additional breakpoints were considered, but those models only yield marginal improvements in fit at the cost of increased complexity. The final specification thus balances parsimony with explanatory power.
4.1 Parameter Estimation
The parameters of the proposed models were estimated using non-linear least squares fitting on three datasets: cassette sales, compact disc sales, and music video sales. The parameters are reported in Tables 1–3.
Table 1 Parameter estimates of cassette dataset
| Parameter | ||||||||||||
| Cassette | ||||||||||||
| Model 1 | Estimate | 6316.617 | 0.003 | 3.188 | – | – | – | – | 5.095 | 15.066 | 26.59 | |
| Std. Error | 32.262 | 0.002 | 0.271 | – | – | – | – | 0.887 | 0.593 | 1.115 | ||
| 95% C.I. | L.B. | 6250.729 | 6.9E-05 | 2.635 | – | – | – | – | 3.283 | 13.854 | 24.312 | |
| U.B. | 6382.505 | 0.006 | 3.742 | – | – | – | – | 6.906 | 16.278 | 28.868 | ||
| Model 2 | Estimate | 6202.395 | 0.040 | 17.376 | 0.026 | 0.017 | 0.020 | 0.033 | 12.771 | 20.951 | 25.461 | |
| Std. Error | 6.571 | 0.016 | 4.070 | 0.008 | 0.004 | 0.005 | 0.009 | 0.625 | 0.163 | 0.226 | ||
| 95% C.I. | L.B. | 6188.889 | 0.006 | 9.011 | 0.009 | 0.008 | 0.010 | 0.016 | 11.486 | 20.615 | 24.997 | |
| U.B. | 6215.902 | 0.073 | 25.742 | 0.043 | 0.026 | 0.030 | 0.051 | 14.056 | 21.287 | 25.925 | ||
4.1.1 Cassettes
Model 1 (Uniform, piecewise smooth function) identified three change points at approximately periods 5.1, 15.1, and 26.6. The estimated market potential was , with a very low baseline innovation-driven adoption intensity () and a moderate baseline imitation intensity . This specification does not include regime-specific parameters, implying that adoption evolves in a relatively uniform manner across phases. While parsimonious, this model smooths over sharper transitions and captures only the broad outline of the adoption curve.
Model 2 (Exponential, piecewise smooth function) imposed breakpoints later in the series, at around periods 12.8, 21.0, and 25.5. The market potential was slightly lower , but the dynamics were much stronger, with a higher baseline innovation parameter and a very large baseline imitation effect Importantly, this model estimated regime-specific adjustment parameters , reflecting different exponential growth dynamics across phases. For instance, growth accelerated sharply in the early and late stages, with a temporary slowdown in the middle stages. This richer structure provides a closer alignment with the Bass diffusion framework, in which adoption accelerates through social contagion before levelling off. The actual and predicted values of both the models are encapsulated in Figure 1. It is clear from the graph that Model 2 aligns closely to the actual dataset.
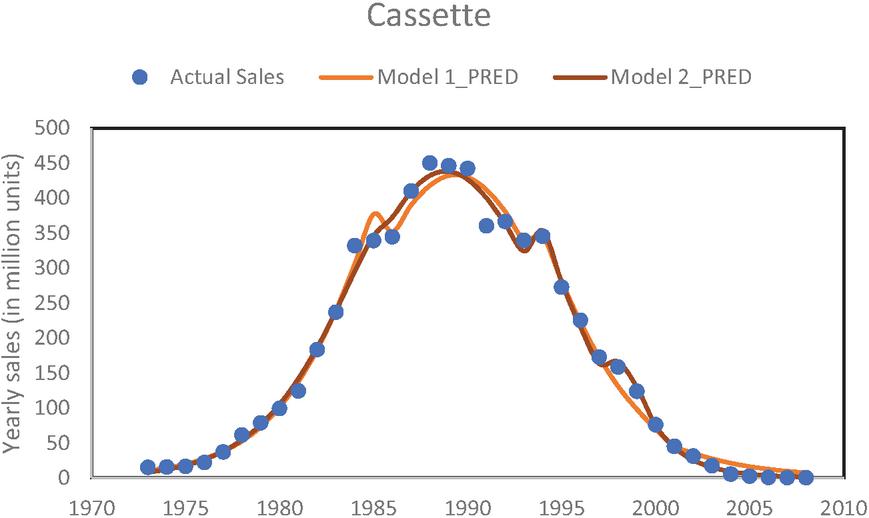
Figure 1 Goodness of fit curve for DS-1.
4.1.2 Compact disc
Model 1 estimated a market potential of , with a baseline innovation parameter and a relatively modest baseline imitation parameter . Breakpoints were identified at 10.6 and 24.8, dividing the sales trajectory into three phases of adoption. The standard errors for the parameters were small, and the 95% confidence intervals were fairly narrow, for example, the market potential lies between 14,792–15,008. This indicates that the estimates are statistically reliable, though the model imposes uniform dynamics across regimes and does not capture phase-specific accelerations.
Model 2 yielded a slightly higher market potential of . The baseline innovation parameter was lower , but the baseline imitation effect was considerably stronger (), suggesting that adoption was more heavily driven by peer influence. Breakpoints were identified earlier, at 15.4 and 21.0, pointing to sharper regime shifts compared to Model 1. In addition, regime-specific exponential adjustments were estimated, reflecting a period of rapid initial acceleration followed by steadier growth. Standard errors were very small, and the 95% confidence intervals were extremely tight (e.g., m between 15,039–15,117), confirming the precision of the estimates. The actual and predicted values of both the models are encapsulated in Figure 2. It is clear from the graph that Model 2 aligns closely to the actual values.
Table 2 Parameter estimates of CD dataset
| Parameter | |||||||||||
| Compact Disk | |||||||||||
| Model 1 | Estimate | 14900.13 | 0.017 | 3.509 | – | – | – | 10.639 | 24.831 | ||
| Std. Error | 53.249 | 0.005 | 0.149 | – | – | – | 0.719 | 0.642 | |||
| 95% C.I. | L.B. | 14792.029 | 0.008 | 3.206 | – | – | – | 9.179 | 23.528 | ||
| U.B. | 15008.231 | 0.027 | 3.812 | – | – | – | 12.099 | 26.134 | |||
| Model 2 | Estimate | 15078.443 | 0.008 | 9.793 | 0.071 | 0.026 | 0.025 | 15.446 | 20.988 | ||
| Std. Error | 19.062 | 0.002 | 0.160 | 0.006 | 0.001 | 0.001 | 0.502 | 0.498 | |||
| 95% C.I. | L.B. | 15039.615 | 0.004 | 9.467 | 0.059 | 0.025 | 0.024 | 14.422 | 19.974 | ||
| U.B. | 15117.271 | 0.012 | 10.119 | 0.084 | 0.028 | 0.026 | 16.469 | 22.002 | |||
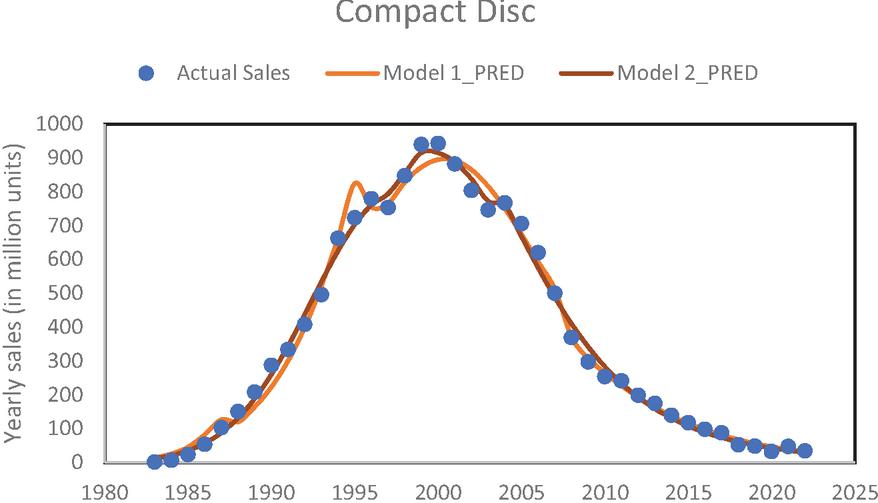
Figure 2 Goodness of fit curve for DS-2.
4.1.3 Video records
Model 1 estimated a market potential of , with a potential innovation intensity of and a modest baseline imitation effect . Breakpoints were located at 15 and 24.4. The standard errors are very small (e.g., SE 1.375 for m), and the 95% confidence intervals are narrow (e.g., m between 400.1–405.7), indicating precise estimates. This model suggests a relatively smooth and gradual diffusion process, with moderate innovation and limited peer-driven effects.
Model 2 estimated a higher market potential , along with a substantially larger innovation potential and a much stronger imitation intensity . Regime-specific exponential adjustments were included, indicating heterogeneous adoption dynamics across phases, with a particularly sharp acceleration captured in the final regime. Breakpoints were identified earlier, at 11.3 and 15.3, reflecting more abrupt shifts in adoption speed than Model 1. Standard errors are somewhat larger, particularly for q (SE 5.002), and the 95% confidence intervals are wider (e.g., m between 388.8–447.9), reflecting greater variability in parameter estimates.
The actual and predicted values of both the models are encapsulated in Figure 3. It is clear from the graph that Model 2 aligns closely to the actual dataset.
Table 3 Parameter estimates of physical video dataset
| Parameter | |||||||||||
| Video Records | |||||||||||
| Model 1 | Estimate | 402.919 | 0.208 | 2.69 | – | – | – | 15.017 | 24.393 | ||
| Std. Error | 1.375 | 0.009 | 0.128 | – | – | – | 0.339 | 0.525 | |||
| 95% C.I. | L.B. | 400.111 | 0.19 | 2.428 | – | – | – | 14.324 | 23.321 | ||
| U.B. | 405.726 | 0.226 | 2.952 | – | – | – | 15.71 | 25.464 | |||
| Model 2 | Estimate | 418.336 | 0.722 | 17.325 | 0.014 | 0.010 | 0.103 | 11.323 | 15.252 | ||
| Std. Error | 14.393 | 0.257 | 5.002 | 0.005 | 0.004 | 0.046 | 0.416 | 0.161 | |||
| 95% C.I. | L.B. | 388.805 | 0.196 | 7.062 | 0.004 | 0.002 | 0.008 | 10.470 | 14.922 | ||
| U.B. | 447.867 | 1.249 | 27.587 | 0.025 | 0.018 | 0.198 | 12.176 | 15.582 | |||
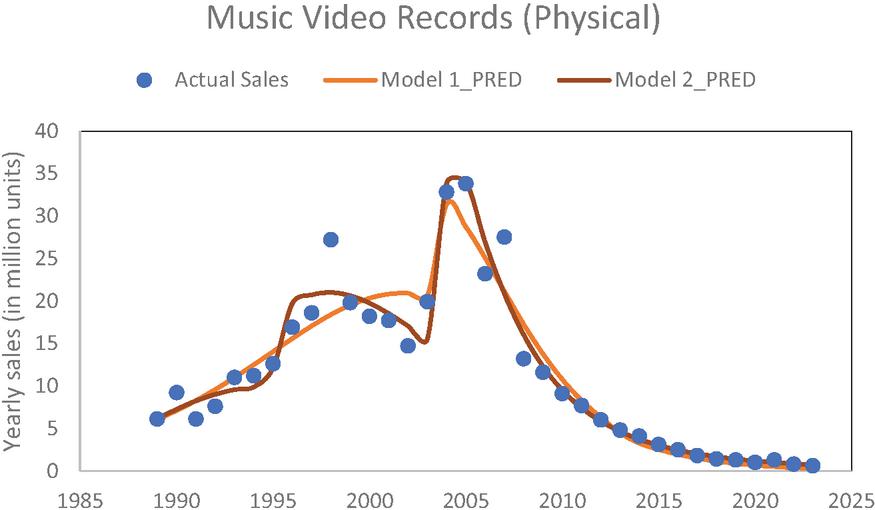
Figure 3 Goodness of Fit curve for DS-3.
4.2 Model Comparison
The performance of the proposed piecewise smooth models was compared against the change point model which has application in both marketing & reliability contexts (Kapur et al. 2007) and traditional Bass diffusion model across the three datasets (Cassette, Compact Disc, and Video Records). Model fit was evaluated using four metrics: coefficient of determination (R2), mean squared error (MSE), Akaike Information Criterion (AIC), and Bayesian Information Criterion (BIC). R2 measures explained variance, MSE reflects average squared error, while AIC and BIC assess model fit penalized for complexity – lower values indicate better models. Also, this residual analysis has been done on the non-cumulative predicted values of sales datasets.
• DS-1 (Table 4): The traditional Bass model performs weakest, with the lowest R2, highest error, and least favourable information criteria, indicating its limited ability to capture structural shifts in adoption trajectories. The change-point model of Kapur et al. (2007) offers improved fit over Bass. However, its AIC and BIC values remain relatively high, suggesting that the improvement in explanatory power comes at the cost of additional complexity. Both proposed piecewise smooth models outperform the benchmarks. Model 2, however, demonstrates the best overall performance.
• DS-2 (Table 5): The proposed piecewise smooth models again outperform the benchmarks. Model 1 achieves a comparable fit but with higher MSE, although it produces more favourable AIC/BIC values than Bass and Kapur. Model 2 is the most robust performer, with the best overall explanatory power, the lowest error, and the most favourable AIC/BIC values.
• DS-3 (Table 6): While the overall explanatory power was lower compared to the other datasets, Model 2 remained the strongest performer, followed by Model 1 with the Kapur et al. (2007) model trailing significantly. The AIC and BIC values also consistently favoured Model 2.
Across all datasets, the proposed piecewise smooth models consistently outperformed the traditional Bass diffusion model and the change-point framework of Kapur et al. (2007). While the Bass model failed to capture turning points in adoption dynamics, the change-point model provided moderate improvement but at the cost of higher complexity and less favourable information criteria. By contrast, exponential-based modulation with regime-specific adjustments (Proposed Model 2) offered the best balance of fit, predictive accuracy, and parsimony, demonstrating that smooth modulation of diffusion parameters is more effective than imposing abrupt structural breaks. This confirms that allowing for regime-specific exponential adjustments provides a more accurate and theoretically consistent representation of product adoption dynamics than either uniform piecewise models or the classical Bass specification.
Table 4 Model performances on cassette dataset (DS-1)
| n. | AIC | BIC | ||
| Proposed Model 1 | 0.9891 | 265.1827 | 212.90 | 222.40 |
| Proposed Model 2 | 0.9935 | 156.5951 | 201.93 | 217.77 |
| Kapur et al. (2007) | 0.9910 | 218.0155 | 217.84 | 236.85 |
| Bass (1969) | 0.9772 | 554.9676 | 233.48 | 238.23 |
Table 5 Model performances on compact disc dataset (DS-2)
| n. | AIC | BIC | ||
| Proposed Model 1 | 0.9895 | 1034.1059 | 287.65 | 296.1 |
| Proposed Model 2 | 0.9946 | 526.3918 | 266.64 | 280.15 |
| Kapur et al. (2007) | 0.9906 | 918.2454 | 290.90 | 306.10 |
| Bass (1969) | 0.9801 | 1967.4216 | 309.38 | 314.45 |
Table 6 Model performances on video records dataset (DS-3)
| n. | AIC | BIC | ||
| Proposed Model 1 | 0.9175 | 7.1787 | 81.50 | 88.26 |
| Proposed Model 2 | 0.9467 | 4.6379 | 72.03 | 85.54 |
| Kapur et al. (2007) | 0.9331 | 5.8043 | 83.00 | 98.20 |
| Bass (1969) | 0.7878 | 18.4136 | 117.18 | 122.25 |
5 Discussion
Real-world diffusion processes is shaped by a dynamic marketing environment, where internal factors (such as pricing, promotions, and distribution) and external factors (such as policy changes, technological disruptions, or competitive launches) alter the pace of adoption in unpredictable ways. To address this, the present study developed an extended diffusion framework that incorporates a modulation function , allowing the adoption rate to vary across phases. By testing both constant and continuous piecewise functions, the model offers greater flexibility and accuracy in representing real-world scenarios where abrupt shifts or gradual transitions are observed.
Empirical results from U.S. music record sales support this framework. As shown in Figure 4, the adoption rate initially mirrors the Bass model, but subsequently deviates, with distinct jumps that the classical model fails to capture. For cassettes, sharp increases occurred around 1992 and 1997; for compact discs, adoption accelerated in 1995 and again in 2002; and for music videos, sales declined in 1992 before rebounding in 2002. These turning points align with known market events and demonstrate that the continuous exponential piecewise function is especially effective in capturing complex adoption dynamics. Unlike the standard model, which smooths over such irregularities, the proposed framework highlights the importance of modeling adoption as a sequence of phase-specific processes influenced by external factors.
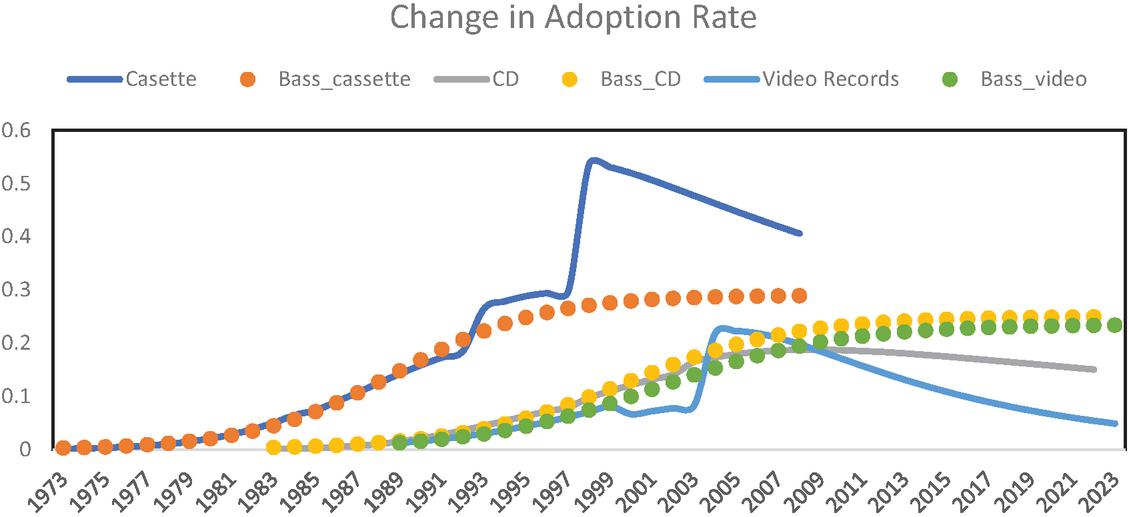
Figure 4 Impact of piecewise function on adoption rate.
Beyond theoretical contributions, the findings have practical implications for managers and policymakers. The piecewise framework shows that adoption trajectories are rarely smooth, and that abrupt accelerations or declines are often triggered by external shocks (policy incentives, technological disruptions, promotions, product design, supply chain failures). By identifying these change points, managers can better align strategy with market dynamics. Table 7 summarizes the key managerial insights derived from the model and its practical applications.
Table 7 Managerial implications of the piecewise diffusion model
| Model Insight | Managerial Implication | Practical Strategy |
| Adoption curves exhibit abrupt changes rather than smooth S-shapes. | Firms must anticipate non-linear adoption dynamics. | Develop contingency plans for sudden slowdowns (boost promotions) or surges (scale supply/distribution). |
| Piecewise phases represent distinct adoption stages. | Marketing should be tailored to each phase. | Early: awareness campaigns; Mid: peer-to-peer referral and bundling; Late: rebranding, upgrades, or targeting niche users. |
| Modulation governs adoption intensity across time. | Resource allocation should synchronize with peak adoption phases. | Adjust ad spend, inventory, and distribution dynamically with predicted adoption surges. |
| External shocks (policy, competition, economic crises) strongly influence adoption. | Firms must integrate environmental scanning into strategic planning. | Track regulations, competitor moves, and macroeconomic conditions to anticipate shifts. |
Future research should focus on refining the piecewise functions and exploring alternative forms for . Additionally, investigating the model’s applicability to other industries and incorporating real-time data could further enhance its accuracy and relevance. Further studies could also explore the integration of additional external factors, such as social media influence and economic indicators, to provide a more comprehensive understanding of the adoption process.
6 Conclusion
This study presented a piecewise smooth extension of the Bass diffusion model to capture random shifts in adoption trajectories. By integrating a modulation function, the framework accommodates both abrupt and gradual changes in market dynamics, offering a more realistic depiction of innovation diffusion. Applied to the music record industry, the model consistently identified turning points and replacement cycles, outperforming standard formulations in both fit and stability. These results underscore the importance of accounting for environmental fluctuations in diffusion studies and provide a foundation for more adaptive forecasting tools.
Acknowledgments
None.
Funding
The author(s) received no financial support for the research, authorship, and/or publication of this article.
Disclosure Statement
Declarations of interest: none
References
Agarwal, A., Giraud-Carrier, F. C., & Li, Y. (2018). A mediation model of green supply chain management adoption: the role of internal impetus. International journal of production economics, 205, 342–358.
Anand, A., Garg, K., & Singh, O. (2025). Transition time based modelling for sustainable innovation adoption. Sustainable Futures, 9, 100759.
Bai, J., & Perron, P. (2003). Computation and analysis of multiple structural change models. Journal of applied econometrics, 18(1), 1–22.
Bass, F. M., Krishnan, T. V., & Jain, D. C. (1994). Why the Bass Model Fits without Decision Variables. Marketing Science, 13(3), 203–223. http://www.jstor.org/stable/183674.
Bass, F.M. (1969) ‘A new product growth for model consumer durables’, Management Science, Vol. 15, No. 5, pp. 215–227.
Bemmaor, A. C., & Lee, J. (2002). The impact of heterogeneity and ill-conditioning on diffusion model parameter estimates. Marketing Science, 21(2), 209–220.
Boswijk, H. P., & Franses, P. H. (2005). On the econometrics of the Bass diffusion model. Journal of Business & Economic Statistics, 23(3), 255–268. https://doi.org/10.1198/073500104000000604.
Chandrasekaran, D., & Tellis, G. J. (2008). Global takeoff of new products: culture, wealth, or vanishing differences?. Marketing Science, 27(5), 844–860.
Coccia, M. (2020). How does institutional change of democratization affect the origin and diffusion of technological innovation across countries?. Journal of Economic and Social Thought, 7(2), 60–91.
Cosguner, K., & Seetharaman, P. (2022). Dynamic Pricing for New Products Using a Utility-Based Generalization of the Bass Diffusion Model. Manag. Sci., 68, 1904–1922. https://doi.org/10.1287/mnsc.2021.4257.
Darke, P. R., & Chung, C. M. (2005). Effects of pricing and promotion on consumer perceptions: it depends on how you frame it. Journal of retailing, 81(1), 35–47.
Fibich, G., & Golan, A. (2023). Diffusion of new products with heterogeneous consumers. Mathematics of Operations Research, 48(1), 257–287.
Golder, P. N., & Tellis, G. J. (2004). Growing, growing, gone: Cascades, diffusion, and turning points in the product life cycle. Marketing Science, 23(2), 207–218.
Guidolin, M., & Mortarino, C. (2010). Cross-country diffusion of photovoltaic systems: Modelling choices and forecasts for national adoption patterns. Technological Forecasting and Social Change, 77, 279–296. https://doi.org/10.1016/J.TECHFORE.2009.07.003.
Gurov, S. V., & Utkin, L. V. (2012). Load-share reliability models with the piecewise constant load. International Journal of Reliability and Safety, 6(4), 338. https://doi.org/10.1504/IJRS.2012.049599.
Gurov, S. V., & Utkin, L. V. (2014). A continuous extension of a load-share reliability model based on a condition of the residual lifetime conservation. European J. of Industrial Engineering, 8(3), 349. https://doi.org/10.1504/EJIE.2014.060995.
Guseo, R., & Guidolin, M. (2015). Heterogeneity in diffusion of innovations modelling: A few fundamental types. Technological Forecasting and Social Change, 90, 514–524. https://doi.org/10.1016/j.techfore.2014.02.023.
Guseo, R., Dalla Valle, A., & Guidolin, M. (2007). World Oil Depletion Models: Price effects compared with strategic or technological interventions. Technological Forecasting and Social Change, 74(4), 452–469. https://doi.org/10.1016/j.techfore.2006.01.004.
Huang, C. Y., & Lyu, M. R. (2011). Estimation and analysis of some generalized multiple change-point software reliability models. IEEE Transactions on reliability, 60(2), 498–514.
Irshad, M. S., Anand, A., & Bisht, M. (2019). Modelling popularity dynamics based on YouTube viewers and subscribers. International Journal of Mathematical, Engineering and Management Sciences, 4(6), 1508.
Jha, P. C., Gupta, A., & Kapur, P. K. (2008). Bass model revisited. Journal of Statistics and Management Systems, 11(3), 413-437.
Kapur, P. K., Panwar, S., & Singh, O. (2019). Modeling two-dimensional technology diffusion process under dynamic adoption rate. Journal of Modelling in Management, 14(3), 717–737. https://doi.org/10.1108/JM2-06-2018-0088.
Kapur, P. K., Singh, V. B., Anand, S. and Yadavalli, V. S. S. (2007). An innovation diffusion model incorporating change in the adoption rate. Management Dynamics: Journal of the Southern African Institute for Management Scientists, 16,1:34–41.
Kim, T., & Hong, J. (2015). Bass model with integration constant and its applications on initial demand and left-truncated data. Technological Forecasting and Social Change, 95, 120–134. https://doi.org/10.1016/J.TECHFORE.2015.02.009.
Kumar, R., Sharma, A., & Agnihotri, K. (2020). Bifurcation behaviour of a nonlinear innovation diffusion model with external influences. International Journal of Dynamical Systems and Differential Equations. https://doi.org/10.1504/ijdsde.2020.10031334.
Lee, S., Trimi, S., & Kim, C. (2013). Innovation and imitation effects’ dynamics in technology adoption. Industrial Management & Data Systems, 113(6), 772–799. https://doi.org/10.1108/IMDS-02-2013-0065.
Li, L., & Rao, M. (2023). The impact of government intervention on innovation efficiency of green technology – a threshold effect analysis based on environmental taxation and government subsidies. Frontiers in Energy Research, 11, 1197158.
Liang, L. (2021). Novel Optimization-Based Parameter Estimation Method for the Bass Diffusion Model. SAGE Open, 11. https://doi.org/10.1177/21582440211026954.
Mahajan, V., Muller, E., & Bass, F. M. (1990). New product diffusion models in marketing: A review and directions for research. Journal of marketing, 54(1), 1–26.
Massiani, J., & Gohs, A. (2015). The Choice of Bass Model Coefficients to Forecast Diffusion for Innovative Products: An Empirical Investigation for New Automotive Technologies. Department of Economics. https://doi.org/10.2139/ssrn.2903850.
Min-Hi, H. (2006). Modeling Diffusion Process Under Abrupt Changes of External Factors. Journal of the Korean Operations Research and Management Science Society, 31(2), 15–26.
Niu, S.-C. (2006). A Piecewise-Diffusion Model of New-Product Demands. Operations Research, 54(4), 678–695. https://doi.org/10.1287/opre.1060.0287.
Niu, J., Jin, S., Chen, G., & Geng, X. (2024). How Can Price Promotions Make Consumers More Interested? An Empirical Study from a Chinese Supermarket. Sustainability. https://doi.org/10.3390/su16062512.
Oliinyk, V., Kozmenko, O., Wiebe, I., & Kozmenko, S. (2018). Optimal Control over the Process of Innovative Product Diffusion: The Case of Sony Corporation. Economics & Sociology. https://doi.org/10.14254/2071-789X.2018/11-3/16.
Øverby, H., Audestad, J., & Szalkowski, G. (2022). Compartmental market models in the digital economy – extension of the Bass model to complex economic systems. Telecommunications Policy. https://doi.org/10.1016/j.telpol.2022.102441.
Panwar, S., Kapur, P. K., & Singh, O. (2019). Modeling Technological Substitution by Incorporating Dynamic Adoption Rate. International Journal of Innovation and Technology Management, 16(01), 1950010. https://doi.org/10.1142/S021987701950010X.
Peng, C., Liu, G., & Wang, L. (2016). Piecewise modelling and parameter estimation of repairable system failure rate. SpringerPlus, 5(1), 1477. https://doi.org/10.1186/s40064-016-3122-4.
Peres, R., Muller, E., & Mahajan, V. (2010). Innovation diffusion and new product growth models: A critical review and research directions. International journal of research in marketing, 27(2), 91–106.
Pti. (2024, January 22). EVs development, adoption to play major role in India’s transition to low carbon economy: DPIIT Secy. The Economic Times.
Rahman, M. M., & Thill, J. C. (2023). What drives people’s willingness to adopt autonomous vehicles? A review of internal and external factors. Sustainability, 15(15), 11541.
Ramírez-Solís, E., & Rodriguez-Marin, M. (2022). Diffusion Model for Mexican SMEs to Support the Success of Innovation. Sustainability. https://doi.org/10.3390/su141610305.
Rogers, E.M. (2010) Diffusion of Innovations. 4th Edition, Simon and Schuster, New York.
Saeed, K., & Xu, J. (2020). Understanding diffusion of information systems-based services: evidence from mobile banking services. Internet Res., 30, 1281–1304. https://doi.org/10.1108/intr-01-2019-0008.
Schweidel, D. A., & Fader, P. S. (2009). Dynamic changepoints revisited: An evolving process model of new product sales. International Journal of Research in Marketing, 26(2), 119–124. https://doi.org/10.1016/j.ijresmar.2008.12.005.
Sony game and network services: net sales & operating income FY 2012-2023. (2024, May 14). Statista. https://www.statista.com/statistics/323452/sony-net-sales-and-operating-income-game-network-services/.
Takahashi, C., De Figueiredo, J., & Scornavacca, E. (2024). Investigating the diffusion of innovation: A comprehensive study of successive diffusion processes through analysis of search trends, patent records, and academic publications. Technological Forecasting and Social Change. https://doi.org/10.1016/j.techfore.2023.122991.
U.S. Music Revenue Database – RIAA. (2023, July 12). RIAA. https://www.riaa.com/u-s-sales-database/.
Van den Bulte, C., & Stremersch, S. (2004). Social contagion and income heterogeneity in new product diffusion: A meta-analytic test. Marketing Science, 23(4), 530–544.
Wang, Y., Pei, L., & Wang, Z. (2017). The NLS-based Grey Bass Model for Simulating New Product Diffusion. International Journal of Market Research, 59, 655–669. https://doi.org/10.2501/IJMR-2017-045.
Yu, J. R., & Tseng, F.-M. (2016). Fuzzy Piecewise Logistic Growth Model for Innovation Diffusion: A Case Study of the TV Industry. International Journal of Fuzzy Systems, 18(3), 511–522. https://doi.org/10.1007/s40815-015-0066-8.
Zhang, C., Tian, Y., & Fan, L. (2020). Improving the Bass model’s predictive power through online reviews, search traffic and macroeconomic data. Annals of Operations Research, 295, 881–922. https://doi.org/10.1007/s10479-020-03716-3.
Zhao, H., Yao, X., Liu, Z., & Yang, Q. (2021). Impact of pricing and product information on consumer buying behavior with customer satisfaction in a mediating role. Frontiers in psychology, 12, 720151.
Biographies

Khushboo Garg is a doctoral researcher in Operational Research at the University of Delhi and a UGC NET JRF awardee in Management. Her research focuses on innovation diffusion modeling, marketing analytics, and quantitative approaches in business decision-making. She has presented her work at several international conferences and is actively involved in ongoing academic research and collaborative projects.

Mohammed Shahid Irshad is an Assistant Professor at NMIMS, Mumbai, India and holds a Ph.D. in Operational Research from the University of Delhi. His research focuses on mathematical modeling, social media analytics, and the application of machine learning techniques in diffusion dynamics. He has published in several SCOPUS and SCI-indexed journals and presented at international conferences. His work integrates data-driven decision-making with computational tools, and he has also worked with government agencies as a data consultant.

Ompal Singh is a Professor of Operational Research at Department of Operational Research, University of Delhi, India. His research areas are: Operations Research, Software Reliability, Optimization Techniques, and Applied Mathematical Modelling. He has total 150 plus publications including journal articles/books/book chapters/conference articles. He is actively involved in organizing workshops and international conferences in his department.

Rajiv Chopra is Principal and Professor at Delhi College of Arts & Commerce, University of Delhi, with a Ph.D. in Management and Finance. A scholar and author of numerous national and international publications and books, he specializes in management, finance, and digital economic transformation. His academic career spans three decades across teaching, research, and leadership.
Journal of Reliability and Statistical Studies, Vol. 19, Issue 1 (2026), 119–148
doi: 10.13052/jrss0974-8024.1916
© 2026 River Publishers