Cesarean Delivery-Emergency or Elective in India: Evidence from NFHS-V
Brijesh P. Singh1, Tanya Singh2,* and Alok Kumar Singh3
1Department of Statistics, Institute of Science, Banaras Hindu University, Varanasi, Uttar Pradesh, 221005, India
2Department of Statistics, St. John’s College, Agra, Uttar Pradesh, 282002, India
3Department of Statistics, RBS College, Agra, Uttar Pradesh, 282002, India
E-mail: brijesh@bhu.ac.in; tanya.singh11@bhu.ac.in; alok.austats@gmail.com
*Corresponding Author
Received 08 June 2025; Accepted 14 January 2026
Abstract
The number of caesarean deliveries worldwide has been rising, which raises concerns about whether choosing this operation is suitable. Using both bivariate and multivariate logistic regression techniques, the current study aims to investigate the factors that influence the preference for caesarean delivery in India in order to ascertain whether the procedure is elective or emergency. It also looks at the relationship between the risk of caesarean delivery and women’s pre-pregnancy obesity, height, delivery complications, preferred place of antenatal care visit as well as place of delivery, desired child, and sociodemographic variables. Results show that the risk of undergoing Cesarean section in the private sector is about four times higher than that in the public sector. The younger and educated women are more likely to prefer Cesarean delivery as compared to their counterparts. It’s likely that this medical treatment is being abused for financial gain in the private sector or that women are choosing to forego labour discomfort on purpose.
Keywords: Cesarean delivery, private hospitals, ANC visit, pregnancy complications, desired children.
1 Introduction
In clinical practice, when vaginal birth is not feasible (emergency CD) or when doctors believe that vaginal delivery would be more dangerous for both mother and child (planned CD), a caesarean delivery is introduced as a life-saving treatment for both mother and baby. One of the most important measures of emergency obstetric treatment is the proportion of Caesarean deliveries (CD) to all births. Low-income environments use it less, whereas middle- and high-income environments use it heavily or even excessively (Althabe and Belizan, 2006 and Belizan et al., 1999). Concerns concerning the suitability of case selection for the treatment and expanding access to obstetric and gynaecological care are also raised by the global rise in CD rates (Mishra and Ramanathan, 2002). During the first delivery, there are more caesarean deliveries than vaginal deliveries. In its updated guidelines (WHO, 1985), the World Health Organisation (WHO) declared that “there is no justification for a caesarean delivery rate to exceed 10–15 percent in any region” and that the rate of caesarean births in any population group should be between 5% and 15%. A percentage of less than 5% indicates that many women lack access to surgical obstetric treatment; a rate of more than 15%, however, suggests that the surgery is overused for purposes other than life-saving (WHO, 1985). It is proposed that there is no further benefit to mothers or newborns when rates surpass this threshold. However, the rate of caesarean deliveries in many rich and developing nations today substantially surpasses the WHO-recommended acceptable limits, suggesting that this intervention is not necessary. In many nations worldwide, the number of babies born via caesarean section has steadily increased during the last few decades. In affluent nations, especially the United States, where the rate of caesarean deliveries rose from 4.5 percent in 1965 to 31.8 percent in 2007, caesarean deliveries are the most common surgical operation among women. Although not as much as in the US, there has been a rise in caesarean deliveries in developing countries like Brazil, China, and India.
The high incidence of CD does not necessarily translate into improved maternal health and pregnancy outcomes, and its sharp rise worldwide has become a major public health problem. Once a high-mortality event that led to significant maternal and newborn mortality, birth is now a normal physiological process of the human body. To stop issues like CD during labour, medical technologies and public health initiatives were created. The CD rate has sharply increased as a result of greater CD safety brought about by the advancement of medical technologies. However, to protect both the mother and the unborn child, surgical intervention should be performed during pregnancy if there is obstetric danger (Mishra et al., 2002). As a result, it is acceptable in specific medical issues; nonetheless, the intervention should not be utilised frequently and is only necessary in high-risk groups (Bruekens, 2001). The global epidemic of obstetrical procedures may have detrimental effects on women’s and their children’s health, and morbidity and mortality from needless interventions is a serious problem. Only when it is necessary to improve the mother’s and the child’s health and raise the possibility of positive results should a caesarean section be carried out. A caesarean section is warranted in cases of cephalopelvic disproportion and contracted pelvis, soft-parts dystocia, inadequate uterine forces, antepartum haemorrhage, maternal distress, including heart issues, poor obstetric history, and a history of intrauterine foetal death, among other conditions (Porreco et al., 1996; Wilkinson et al., 1998 and Poma et al., 1998).
Caesarean births have further negative effects on women’s health. Therefore, a caesarean delivery should only be performed when the risks associated with the procedure are outweighed by the dangers associated with obstetrics. In addition to indicating greater availability to obstetrical and gynaecological care, the rise in caesarean deliveries worldwide raises concerns regarding whether choosing a caesarean delivery is the best course of action for giving birth. Particularly in high- or middle-income nations, the number of caesarean deliveries has increased dramatically in recent years (Puentes-Rosas et al., 2004). The rate of caesarean deliveries is influenced by a variety of factors, including sociodemographic, institutional, and medical ones. The infant’s size at birth, prior caesarean deliveries, breech presentation, growing maternal age, and obstetric complications (preterm delivery, low birth weight, prenatal death, etc.) are the most important institutional factors (Keeler and Brodie, 1993; Lyter, 1986; Braveman et al., 1995; DiMatteo et al., 1996; Schimmel et al., 1996; Woolbright, 1996; Crane et al., 1997 and Perez-Escamilla et al., 1996). Sociodemographic characteristics include mother education, maternal desire, and high-income social class (Ash and Okah, 1997; Mossialos et al., 2005). The popularity of caesarean sections among a certain segment of the population may also be explained by women’s fear of the physiological effects of a typical delivery and the fact that they are less painful and take less time (Pai, 2000). According to Misra et al. (2002), women in India are more likely to have a caesarean section if they wish to give birth on an auspicious day.
Because of doctor and patient concerns about the pregnancy outcomes of older women, previous research suggests that advanced maternal age may be an independent risk factor for caesarean birth (Gordon et al., 1991; Taffel, 1994; Irwin et al., 1996 and Mc Closky, 1988). Generally speaking, the doctor’s interest influences the CD selection in addition to medical considerations. The practice style and clinical attitude of the surgeon, as well as the delivery location – private or public – are physician characteristics that influence the prevalence of CD, according to a number of social scientists.
In the case of developing nations such as India, the reasons for the escalating CD flow are still obscure. With a rise in institutional births and greater access to gynecological and obstetric care, there is a rising trend of cesarean delivery in India. The findings of various National Family Health Surveys (NFHS) show that the rate of birth by Caesarean section has increased significantly, especially in urban areas of India, from 5.7% in 1991–92 to 34.0% in 2019–21 (Table 6.2). A population-based cross-sectional study in Madras concluded that the high rate of caesarean section births in the private sector is alarming and may implicate private sector care as the primary contributor to the high population CD rates (Sreevidya et al., 2003). The rising incidence of cesarean delivery in India compels researchers to investigate its correlations. As a result of the lack of accurate data, the increase in cesarean sections over time and in particular in certain locations remains unexplained. Concern is expressed regarding the high cesarean rates in certain regions of India, but the current facts about these areas have yet to be investigated. In recent years in many countries of the world it is often argued that with the rise of private medical practice, obstetricians increasingly prefer medical births over normal births. The reasons for the increasing demand for caesarean delivery are a topic of debate among social scientists and medical sociologists in both developed and developing nations. Previous research has demonstrated that the occurrence of cesarean births is influenced by numerous background variables, including age, parity, socioeconomic status, and place of residence. In the majority of previous studies, the effects of these factors on cesarean births are estimated, but it is necessary to determine the current significance of these factors.
2 Data and Methodology
2.1 An Overview of Data and Sample Design
The data for the analysis is taken from the National Family Health Survey (NFHS-V, 2019–21). The sample size for the present analysis is 23,018, and when only institutional delivery is considered, it reduces to 20,674. In the NFHS-V, mothers were asked whether they had cesarean deliveries during the five years preceding the survey. For the current analysis, only women who had c-section deliveries for their last birth have been considered. Since we considered the births that occurred during the past five years, it gives a current scenario of the female maternity experience.
2.2 Outcome Variable
The primary outcome of interest is delivery by caesarean section, which is assessed using a “yes” or “no” binary response in the National Family Health Survey (2019–21).
2.3 Independent Variables
Studies have shown that a number of factors play a significant role in deciding the type of delivery, whether normal or by cesarean. Maternal ages, residential status, body mass index of females, pregnancy complications, place of delivery, desired child, and other socio-economic factors are considered possible factors leading to cesarean delivery. A set of independent variables that are included in our study are shown in Table 1, along with their types and ranges.
Table 1 An overview of the main variables used in the analysis of caesarean deliveries
| Variable | Type | Codes/Range |
| Age | Categorical | 15–20* |
| 20–25 | ||
| 25–30 | ||
| 30–35 | ||
| 35 and above | ||
| Education | Categorical | No Education* |
| Primary | ||
| Secondary | ||
| Higher | ||
| Religion | Categorical | Hindu |
| Muslim | ||
| Others* | ||
| Caste | Categorical | SC/ST* |
| OBC | ||
| Others | ||
| Social Status | Categorical | Low* |
| Middle | ||
| High | ||
| Residence | Categorical | Rural* |
| Urban | ||
| Region | Categorical | Central* |
| North | ||
| West | ||
| East | ||
| Northeast | ||
| South | ||
| Mass-Media Exposure | Categorical | No* |
| Yes | ||
| BMI (Body Mass Index) | Categorical | BMIU (underweight 18.5) |
| BMIN* (18.5–25.0) | ||
| BMIO (Overweight 25.0) | ||
| Height | Categorical | Height 1∗ (152.4 cm) |
| Height 2 (152.4–165.1 cm) | ||
| Height 3 (165.1 cm) | ||
| Eligible women in Household | Categorical | 1 |
| 2 | ||
| 3 and more* | ||
| Desired Child | Categorical | 0 |
| 1 | ||
| 2 | ||
| 3 | ||
| 4 and more* | ||
| Place of ANC visit | Categorical | No visit* |
| Visit in Public Hospital | ||
| Visit in Private Hospital | ||
| Pregnancy Complications | Categorical | No* |
| Yes | ||
| (Yes include if any of these problem have occur during pregnancy: Bleeding, Convulsions, Prolonged Labour) | ||
| Place of Delivery | Categorical | Public Hospital* |
| Private Hospital |
2.4 Statistical Analysis
Both bivariate and multivariate techniques have been employed to assess the impact of various correlates, such as various socio-economic characteristics, on the dependent variable during cesarean delivery. The most appropriate multivariate technique, such as logistic regression, has been used. In this study, For women who had a caesarean delivery, the dependent variable is marked as 1, while for mothers who had a normal delivery, it is coded as 0.
A set of variables has been chosen from NFHS data sets for India in order to comprehend the risk factors, socioeconomic factors, and institutional aspects related to C-section births. The type of delivery-related difficulties, including prolonged labour, heavy bleeding, and seizures, is also listed in the survey.
Table 2 Percent of cesarean delivery in rural and urban area of India
| Cesarean Delivery | |||
| (in percentage) | |||
| NFHS | Urban | Rural | Total |
| NFHS-I (1992–93) | 5.7 | 1.6 | 2.5 |
| NFHS-II (1998–99) | 14.7 | 4.9 | 7.1 |
| NFHS-III (2005–06) | 16.8 | 5.6 | 8.5 |
| NFHS-IV (2015–16) | 29.2 | 16.4 | 20.1 |
| NFHS-V (2019–21) | 34.0 | 22.0 | 24.8 |
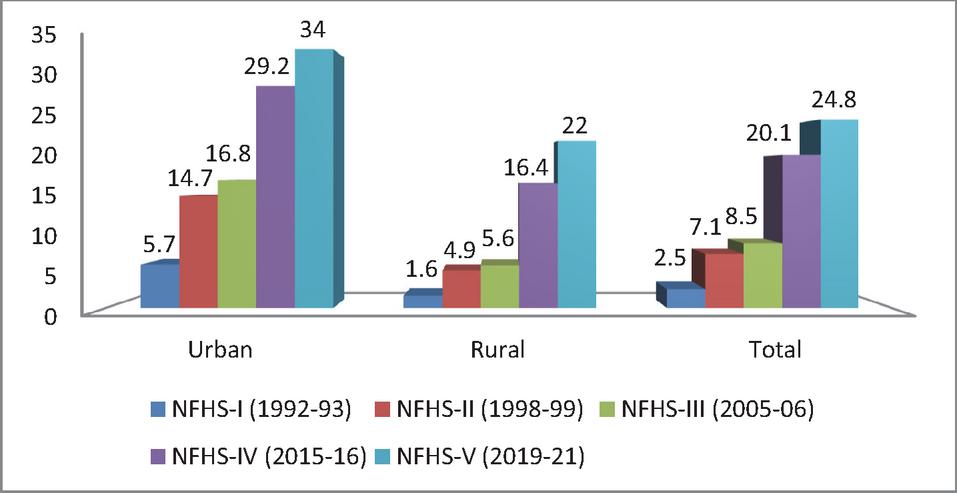
Figure 1 Percent distribution of cesarean delivery in rural and urban area of India.
3 Results
Table 2 and Figure 1 present the percentage of births by cesarean section for rural and urban areas of India in different NFHSs. Table 2 reflects that the percentage of births by cesarean section is much higher in urban areas than in rural areas. There is a significant increase in the percentage of births by cesarean section in India. In NFHS-I, only 2.5% of births in India were by C-section; this increased to 7.1% in NFHS-II and 8.5% in NFHS-III, followed by 20.1% in NFHS-IV and 24.8% in NFHS-V. It is interesting to see that there is a huge difference in C-section rates between rural and urban areas in India. In NFHS-I, the caesarean section birth was only 1.6% in rural areas, while the urban rate was 5.7%, and in NFHS-V, the percentage of cesarean section births in rural India is 22.0% against the urban rate of 34.0%, which is much higher than the WHO recommended threshold level.
The percentage distribution of CD in India by the woman’s age and the birth order of her last kid is explained in Table 3. It demonstrates that the prevalence of CD is highest in first-order births for each age group and declines as one moves towards higher-order births. It is approximately 28.9% for first-order births and drops to 25.3% for second-order births. According to Table 3, women in higher age groups in India have a higher prevalence of CD than women in lower age groups. Conversely, if we focus on birth order, the first order birth’s frequency for CD is lower in females of lower age groups than in females of higher age groups, and the trend is similar for the remaining birth orders.
Table 3 India’s caesarean delivery percentage distribution by female age and last child’s birth order
| Birth Order of Last Child | |||||
| Age of Female | 1 | 2 | 3 | 4+ | Total |
| 15–20 | 15.2 | 14.9 | 0.0 | 0.0 | 15.0 |
| 20–25 | 21.9 | 16.8 | 10.0 | 5.4 | 19.1 |
| 25–30 | 34.2 | 23.4 | 11.9 | 4.5 | 22.6 |
| 30–35 | 44.3 | 33.4 | 17.4 | 5.9 | 25.1 |
| 35 | 57.0 | 44.7 | 26.1 | 7.1 | 25.4 |
| Total | 28.9 | 25.3 | 15.0 | 5.9 | 22.2 |
As with the parity progression, the percentage for the CD declines significantly, as shown in Table 4, which also provides information on the progression to the next birth based on the age of Indian females. In India, for whatever medical cause, the parity progression is observed to be lower in cases of caesarean delivery than in non-cesarean deliveries across all age categories.
Table 4 Progression to the next birth based on the Indian female’s age
| Progression | Age of Female | |||||||||||
| to Birth | 15–20 | 20–25 | 25–30 | 30–35 | 35 | Total | ||||||
| Order | NCD | CD | NCD | CD | NCD | CD | NCD | CD | NCD | CD | NCD | CD |
| 1–2 | 0.10 | 0.08 | 0.44 | 0.34 | 0.75 | 0.56 | 0.87 | 0.70 | 0.94 | 0.77 | 0.69 | 0.56 |
| 2–3 | 0.15 | 0.00 | 0.21 | 0.12 | 0.45 | 0.22 | 0.63 | 0.31 | 0.80 | 0.42 | 0.50 | 0.26 |
| 3–4 | 0.14 | 0.00 | 0.15 | 0.08 | 0.33 | 0.14 | 0.53 | 0.25 | 0.74 | 0.38 | 0.47 | 0.24 |
Table 5 shows the percent distribution of females according to the socio-demographic variables included in the study, along with the percent distribution of cesarean births according to the socio-demographic variables of females. It may be noted that most of the females are from the age group 20–30 years (27.9% from the age group 20–25 and 38.6% from 25–30). The percentage of females in the age group 30–35 years is 20.7, whereas the percentage of females belonging to the age groups 15–20 and 35 and above is 2.5% and 10.2%, respectively. Thus, we see that the majority of females considered here belong to the age group of 20–30 years. It is reflected in the table that approximately 19% of females are illiterate, and only 15.8% completed their education at a higher level. In the literate group of females, the highest percentages of females have completed their education up to the secondary level (52.8%). According to the table, 13% of the respondent’s partners are illiterate, and 12.1% have gone up to primary education. The majority of the respondent’s partners attain secondary education (57.1%), and only 17.8% of the respondent’s partners attain higher education. It may also be noted from the table that only 20.1% of females are working. Table 5 shows that 76.7% of women belong to the Hindu religion, and the sample consists of an equal percentage of Muslims and other religions (11.6%). Table 5 also lists the percentage of women according to different regions. Approximately equal percentages of SC/ST and OBC females are shown in Table 5, and only 17.4% of women belong to the general category.
Table 5 Different characteristics of population under consideration for the analysis
| Number of | Number of Female | |||
| Female | Utilizing Cesarean | |||
| N (%) | Section Delivery | |||
| Background Characteristics | 23,018 (100) | N (%) 5121 (22.2) | p-value | |
| Woman’s Age | ||||
| 15–20 | 576 (2.5) | 83 (14.4) | 0.000 | |
| 20–25 | 6431 (27.9) | 1238 (19.3) | ||
| 25–30 | 8891 (38.6) | 2005 (22.6) | ||
| 30–35 | 4776 (20.7) | 1199 (25.1) | ||
| =35 | 2344 (10.2) | 596 (25.4) | ||
| Woman’s Education | ||||
| No Education | 4439 (19.3) | 416 (9.4) | 0.000 | |
| Primary | 2783 (12.1) | 359 (12.9) | ||
| Secondary | 12,159 (52.8) | 2884 (23.7) | ||
| Higher | 3637 (15.8) | 1462 (40.4) | ||
| Husband’s Education | ||||
| No Education | 3001 (13.0) | 344 (11.5) | 0.000 | |
| Primary | 2776 (12.1) | 412 (14.8) | ||
| Secondary | 13,152 (57.1) | 2911 (22.1) | ||
| Higher | 4089 (17.8) | 1454 (35.6) | ||
| Occupation of Woman | ||||
| No | 18,387 (79.9) | 4107 (22.3) | 0.519 | |
| Yes | 4631 (20.1) | 1014 (21.9) | ||
| Religion | ||||
| Hindu | 17,666 (76.7) | 3927 (22.2) | 0.006 | |
| Muslim | 2679 (11.6) | 646 (24.1) | ||
| Others | 2673 (11.6) | 548 (20.5) | ||
| Caste | ||||
| SC/ST | 9631 (41.8) | 1583 (16.4) | 0.000 | |
| OBC | 9392 (40.8) | 2303 (24.5) | ||
| General | 3995 (17.4) | 1235 (30.9) | ||
| Social Status of Woman | ||||
| Low | 10,584 (46.0) | 1235 (11.7) | 0.000 | |
| Middle | 4706 (20.4) | 1173 (24.9) | ||
| High | 7728 (33.6) | 2713 (35.1) | ||
| Type of Residence | ||||
| Rural | 18,012 (78.3) | 3493 (19.4) | 0.000 | |
| Urban | 5006 (21.7) | 1628 (32.5) | ||
| Region | ||||
| North | 4189 (18.2) | 984 (23.5) | 0.000 | |
| Central | 6315 (27.4) | 916 (14.5) | ||
| West | 2124 (9.2) | 487 (22.9) | ||
| East | 4289 (18.6) | 758 (17.7) | ||
| Northeast | 2954 (12.8) | 536 (18.1) | ||
| South | 3147 (13.7) | 1440 (45.8) | ||
| Mass Media Exposure | ||||
| No | 5907 (25.7) | 637 (10.8) | 0.000 | |
| Yes | 17,111 (74.3) | 4484 (26.2) | ||
| Body Mass Index | ||||
| BMIU | 4346 (18.9) | 621 (14.3) | 0.000 | |
| BMIN | 14,211 (61.7) | 2795 (19.7) | ||
| BMIO | 4461 (19.4) | 1705 (38.2) | ||
| Height | ||||
| Height1 | 12,464 (54.1) | 2559 (20.5) | 0.000 | |
| Height2 | 10,159 (44.1) | 2441 (24.0) | ||
| Height3 | 395 (1.7) | 121 (30.6) | ||
| Sex of Household Head | ||||
| Male | 19,445 (84.5) | 4344 (22.3) | 0.433 | |
| Female | 3573 (15.5) | 777 (21.7) | ||
| Eligible Woman in Household | ||||
| 1 | 15,048 (65.4) | 3370 (22.4) | 0.001 | |
| 2 | 5286 (23.0) | 1226 (23.2) | ||
| =3 | 2684 (11.7) | 525 (19.6) | ||
| Desired Child | ||||
| 0 | 456 (2.0) | 92 (20.2) | 0.000 | |
| 1 | 1045 (4.5) | 397 (38.0) | ||
| 2 | 15,077 (65.5) | 3862 (25.6) | ||
| 3 | 4040 (17.6) | 568 (14.1) | ||
| 4+ | 2400 (10.4) | 202 (8.4) | ||
| Place of ANC Visit | ||||
| No Visit | 1501 (6.5) | 309 (20.6) | 0.000 | |
| Public Hospital | 19,133 (83.1) | 4092 (21.4) | ||
| Private Hospital | 2384 (10.4) | 720 (30.2) | ||
| Pregnancy Complication | ||||
| No | 6172 (26.8) | 1249 (20.2) | 0.000 | |
| Yes | 16,846 (73.2) | 3872 (23.0) | ||
| Place of Delivery | ||||
| Home Delivery | 2344 (10.2) | – | ||
| Institutional Delivery | Public Hospital | 15,283 (66.4) | 2442 (16.0) | 0.000 |
| Private Hospital | 5391 (23.4) | 2679 (49.7) |
It can be observed from the table that the percentage of females belonging to middle and high social status is 20.4% and 33.6%, respectively. It may also be noted from the table that out of the total females considered in the study, approximately 78% are from rural backgrounds, and the remaining 22% are from urban backgrounds. 27.4% of females belong to the central region of India, followed by the east (18.6%) and the north (18.2%). There were 74.3% of women who had mass media exposure, and the remaining 25.7% did not have any exposure to mass media. The maximum percentages of females are noted in the normal body mass index (61.7%), and the percentages of underweight and overweight females are approximately equal. Table 5 shows that the majority of women (54.1%) are of less than 152.4 cm height, 44.1% of women are of height between 152.4 and 165.1 cm, and only 1.7% of women are of height more than 165.1 cm. 84.5% of households are headed by males, and only 15.5% are headed by females. The percentage of households with one eligible female is found to be 65.4%, with two eligible females it is found to be 23.0% and with three or more eligible females it is found to be only 11.7%. Table 5 shows the maximum percentage of women (65.5%) whose desired child was two, and also shows the highest percentage of women who prefer public hospitals for antenatal care (83.1%), followed by the percentage of ANC visits to private hospitals (10.4%) and the percentage of no ANC visits (6.5%). Table 5 shows that approximately 73% of women have any type of pregnancy complications, and only 26.8% of women have no such complications during pregnancy. So far as place of delivery is concerned, very few deliveries take place at home (10.2% in all), and approximately 90% of female deliveries are institutional, of which 23.4% are in private institutions and 66.4% are in public institutions.
From Table 5, it is interesting to note that as the age at marriage increases, the percentage of giving the last delivery by cesarean is higher. The smallest percentage is noted for the age group below 20 years (14.4%). It is further noted that the percentage of cesarean section deliveries increases as the standard of living of females increases. A similar effect can be seen in the context of females’ education: 40.4% of females with higher education go for cesarean section delivery, followed by 23.7%, 12.9%, and 9.4% of secondary, primary, and no-educated females, respectively. A similar effect was seen for the husband’s education, that is, as the husband’s education increases, the percentage of cesarean births also increases. The result of the table also indicates that the working status of women is not associated with cesarean delivery. Religion and caste are both associated factors in determining the effect of C-section delivery. It may be noted that the percentage of cesarean deliveries is higher among females in urban areas (32.5%) than in rural areas (19.4%). The percentage of cesarean deliveries is higher for women who belong to the southern region (45.8%) and lowest for women who belong to the central region (14.5%). Table 5 reveals that 26.2% of women exposed to mass media deliver via cesarean section. Female body mass index correlates with a higher percentage of cesarean section births. 20.5%, 24.0%, and 30.6%, respectively, of women with heights of less than 152.4 cm, between 152.4 and 165.1 cm, and greater than 165.1 cm gave birth through cesarean section.
The sex of the household head is not found to be associated with cesarean delivery. In households with 1, 2, and 3 or more eligible women, the percentage of utilization of cesarean delivery is found to be 22.4%, 23.2%, and 19.6%, respectively. If couples wanted one and two children, their percentages of using cesarean delivery are found to be 38.0% and 25.6%, respectively, which is higher than women with a high desired number of children. If women visit for antenatal care in a private hospital, the percentage of using C-section delivery is 30.2%, followed by ANC visits in a public hospital (21.4%) and no ANC visits (20.6%), respectively. Among women with any type of pregnancy complication, 23.0% utilize cesarean delivery, and among women with no complications, 20.2% use C-section delivery. It may also be observed that the percentage of cesarean deliveries is higher in private hospitals (49.7%) as compared to public hospitals (16.0%). The Chi-square test and p-value reveal that all other predictors are significant except the working status of respondents and the sex of household heads.
Table 6 Unadjusted and adjusted logistic regression analysis to determine the association between respondents’ background characteristics and their last birth caesarean delivery
| Unadjusted Odds Ratio | Adjusted Odds Ratio | |||||
| Odds | 95% CI | Odds | 95% CI | |||
| Background Characteristics | Ratio | Lower | Upper | Ratio | Lower | Upper |
| Maternal Age | ||||||
| 15–20 | Ref | Ref | ||||
| 20–25 | 1.416∗∗ | 1.113 | 1.801 | 1.200 | 0.924 | 1.557 |
| 25–30 | 1.729∗∗∗ | 1.363 | 2.194 | 1.325∗ | 1.021 | 1.720 |
| 30–35 | 1.991∗∗∗ | 1.564 | 2.535 | 1.475∗∗ | 1.128 | 1.928 |
| =35 | 2.025∗∗∗ | 1.577 | 2.602 | 1.881∗∗∗ | 1.421 | 2.489 |
| Women’s Education | ||||||
| No Education | Ref | Ref | ||||
| Primary | 1.432∗∗∗ | 1.233 | 1.664 | 1.156 | 0.980 | 1.364 |
| Secondary | 3.007∗∗∗ | 2.696 | 3.354 | 1.672∗∗∗ | 1.459 | 1.916 |
| Higher | 6.500∗∗∗ | 5.761 | 7.335 | 1.891∗∗∗ | 1.604 | 2.228 |
| Husband’s Education | ||||||
| No Education | Ref | Ref | ||||
| Primary | 1.346∗∗∗ | 1.155 | 1.569 | 1.012 | 0.853 | 1.201 |
| Secondary | 2.195∗∗∗ | 1.948 | 2.474 | 0.995 | 0.860 | 1.151 |
| Higher | 4.262∗∗∗ | 3.745 | 4.850 | 1.001 | 0.845 | 1.187 |
| Religion | ||||||
| Hindu | 1.108∗ | 1.003 | 1.225 | 0.985 | 0.863 | 1.124 |
| Muslim | 1.232∗∗ | 1.083 | 1.402 | 1.366∗∗∗ | 1.156 | 1.615 |
| Others | Ref | Ref | ||||
| Caste | ||||||
| SC/ST | Ref | Ref | ||||
| OBC | 1.652∗∗∗ | 1.538 | 1.774 | 0.980 | 0.898 | 1.070 |
| Others | 2.275∗∗∗ | 2.087 | 2.479 | 1.198∗∗∗ | 1.077 | 1.332 |
| Social Status of Women | ||||||
| Low | Ref | Ref | ||||
| Middle | 2.513∗∗∗ | 2.300 | 2.747 | 1.407∗∗∗ | 1.269 | 1.560 |
| High | 4.095∗∗∗ | 3.797 | 4.416 | 1.387∗∗∗ | 1.241 | 1.549 |
| Type of Residence | ||||||
| Rural | Ref | Ref | ||||
| Urban | 2.003∗∗∗ | 1.868 | 2.148 | 0.989 | 0.906 | 1.079 |
| Region | ||||||
| Central | Ref | Ref | ||||
| North | 1.810∗∗∗ | 1.637 | 2.000 | 1.375∗∗∗ | 1.224 | 1.544 |
| West | 1.753∗∗∗ | 1.550 | 1.983 | 1.062 | 0.925 | 1.220 |
| East | 1.265∗∗∗ | 1.139 | 1.406 | 1.475∗∗∗ | 1.312 | 1.659 |
| Northeast | 1.307∗∗∗ | 1.162 | 1.469 | 1.770∗∗∗ | 1.531 | 2.047 |
| South | 4.972∗∗∗ | 4.503 | 5.490 | 3.258∗∗∗ | 2.906 | 3.653 |
| Mass-Media Exposure | ||||||
| No | Ref | Ref | ||||
| Yes | 2.938∗∗∗ | 2.688 | 3.211 | 1.243∗∗∗ | 1.118 | 1.383 |
| Body Mass Index | ||||||
| BMIU | 0.681∗∗∗ | 0.620 | 0.748 | 0.796∗∗∗ | 0.716 | 0.884 |
| BMIN | Ref | Ref | ||||
| BMIO | 2.527∗∗∗ | 2.348 | 2.719 | 1.696∗∗∗ | 1.560 | 1.845 |
| Height | ||||||
| Height1 | Ref | Ref | ||||
| Height2 | 1.224∗∗∗ | 1.150 | 1.304 | 0.845∗∗∗ | 0.784 | 0.909 |
| Height3 | 1.709∗∗∗ | 1.374 | 2.126 | 0.943 | 0.732 | 1.216 |
| Eligible women in household | ||||||
| 1 | 1.187∗∗∗ | 1.071 | 1.315 | 1.248∗∗∗ | 1.110 | 1.403 |
| 2 | 1.242∗∗∗ | 1.107 | 1.393 | 1.203∗∗ | 1.058 | 1.368 |
| 3+ | Ref | Ref | ||||
| Desired Children | ||||||
| 0 | 2.750∗∗∗ | 2.099 | 3.604 | 2.237∗∗∗ | 1.655 | 3.023 |
| 1 | 6.666∗∗∗ | 5.509 | 8.067 | 4.057∗∗∗ | 3.255 | 5.057 |
| 2 | 3.747∗∗∗ | 3.229 | 4.348 | 2.730∗∗∗ | 2.299 | 3.242 |
| 3 | 1.780∗∗∗ | 1.503 | 2.108 | 1.765∗∗∗ | 1.465 | 2.126 |
| 4+ | Ref | Ref | ||||
| Place of ANC Visit | ||||||
| No Visit | Ref | Ref | ||||
| Public Hospital | 1.049 | 0.922 | 1.195 | 1.150 | 0.991 | 1.334 |
| Private Hospital | 1.669∗∗∗ | 1.433 | 1.944 | 1.223∗ | 1.026 | 1.458 |
| Pregnancy Complications | ||||||
| No | Ref | Ref | ||||
| Yes | 1.176∗∗∗ | 1.095 | 1.264 | 1.179∗∗∗ | 1.087 | 1.279 |
| Place of Delivery | ||||||
| Public Hospital | Ref | Ref | ||||
| Private Hospital | 6.143∗∗∗ | 5.737 | 6.577 | 4.382∗∗∗ | 4.050 | 4.740 |
| Source: 2019–21 NFHS Level of Significance ∗p0.05, ∗∗p0.01 and ∗∗∗p0.001. | ||||||
Table 6 provides the results of unadjusted and adjusted logistic regression focusing on the last cesarean delivery. From Table 6, it is clear that there is a significant association between women’s current age and the cesarean delivery of their last birth. As the current age of women increases, the chances of cesarean delivery at the last birth increase. Women who are aged 20–25 are 1.42 (95% CI: 1.11–1.80) times more likely to give birth via C-section than women aged 15–20. However, for this age group, when we shift from unadjusted to adjusted odds ratio, the result is insignificant, but for all other age groups, the result is found to be significant for both unadjusted and adjusted odds ratios. The adjusted odds for women in the 25–30, 30-35, and 35 age groups are found to be 1.33 (95% CI: 1.02–1.72), 1.48 (95% CI: 1.13–1.93), and 1.88 (95% CI: 1.42–2.49), respectively, using the 15–20 age group as a reference. As we move from women with no formal education to those with more education and whose last birth was via caesarean section, we see a notable increase in the odds. Higher educated women are 6.50 (95% CI: 5.76–7.34) times more likely to give birth via caesarean section than uneducated women. However, when the result is controlled for all other explanatory variables, the adjusted odds remain significant and high for women with a higher level of education, although they are lower than the unadjusted odds ratio. The adjusted odds for the respondent’s education are 1.67 (95% CI: 1.46–1.92) and 1.89 (95% CI: 1.61–2.23) times greater for women with secondary and higher education, respectively, compared to the reference category of no education. The unadjusted odds for a husband’s education are found to be 1.35 (95% CI: 1.16–1.57), 2.20 (95% CI: 1.95–2.47), and 4.26 (95% CI: 3.75–4.85), respectively. However, when we shifted from an unadjusted odds ratio to an adjusted odds ratio, the result became insignificant. Using other religious groups as a comparison group, the unadjusted odds for Muslims and Hindus are found to be 1.23 (95% CI: 1.08–1.40) and 1.11 (95% CI: 1.00–1.23), respectively, and they are found to be statistically significant. When we shift from an unadjusted to an adjusted odds ratio, the result is no longer found to be statistically significant for Hindus, but for Muslims, the result is still found to be significant with odds of 1.37 (95% CI: 1.16–1.62). Other category women have a high likelihood of having their last child via cesarean section, when compared to SC/ST women, who serve as the reference group. The unadjusted odds ratio for others is 2.28 (95% CI: 2.09–2.48), and the adjusted odds are 1.20 (95% CI: 1.08–1.33), indicating that the incidence of C-section births among women from other castes is 2.28 (95% CI: 2.09–2.48) and 1.20 (95% CI: 1.08–1.33) times greater than among SC/ST women.
Another important consideration is women’s social standing. Examining the unadjusted and adjusted chances for the various wealth index categories, we discover that women with higher incomes are more likely than their counterparts to have had C-sections for prior births. The chance is 4.10 (95% CI: 3.80–4.42) times higher for women with a high wealth index than for those with a low wealth index. In a similar vein, the adjusted chances are 1.39 (95% CI: 1.24–1.55) times greater than the reference group, which is the poor wealth index. We find that women in urban areas are substantially more likely than those in rural regions to give birth by caesarean section, and the difference is highly significant when taking into account the explanatory variable of place of residence. The odds for urban women are 2.00 (95% CI: 1.87–2.15) times higher than those for rural women. When an adjusted odds ratio is substituted for an unadjusted odds ratio, the outcome is determined to be negligible. Women in the northern region have a 1.38 (95% CI: 1.22–1.54) chance of giving birth via C-section, whereas those in the southern region have a 3.26 (95% CI: 2.91–3.65) chance. Compared to women who are not exposed to the media, women who are exposed to the media are more likely to give birth via caesarean section. Those who are exposed to media had adjusted chances of 1.24 (95% CI: 1.12–1.38), which is substantially higher than those who are not. It was also discovered that a couple’s decision to have a C-section delivery was significantly predicted by their height and BMI. Using normal weight as the reference group, the adjusted odds for underweight and overweight were 0.80 (95% CI: 0.72–0.88) and 1.70 (95% CI: 1.56–1.85), respectively.
As eligible women in household increase chances of giving delivery by C-section decreases. The adjusted odds ratios for one and two eligible women were found to be 1.25 (95% CI: 1.11–1.40) and 1.20 (95% CI: 1.06–1.37), respectively. Women whose desired number of children was 0, 1, 2, or 3 are found to be 2.24 (95% CI: 1.66–3.02), 4.06 (95% CI: 3.26–5.06), 2.73 (95% CI: 2.30–3.24), and 1.77 (95% CI:1.47–2.13) times more likely to give birth via C-section, as compared to those whose desired number of children was 4 or more. This means that the chances of a C-section delivery are highest for women whose desired number of children is one. Place of Women visiting a private hospital for an ANC check-up are 1.22 (95% CI: 1.03–1.46) times more likely to use a C-section delivery than women who did not visit a hospital for an antenatal check-up. The unadjusted odds ratio for women who have any type of pregnancy complication is 1.18 (95% CI: 1.10–1.26) and adjusted odds are 1.18 (95% CI: 1.09–1.28) times higher as compared to women who have no pregnancy complications. Women who are giving birth in private hospitals have 6.14 (95% CI: 5.74–6.58) times higher odds to give birth through C-sections as compared to women who are giving birth in public hospitals. However, after controlling for all other explanatory variables, the adjusted odds are still found to be significant and higher for women who gave birth in a private hospital. This study demonstrates that a number of socio-demographic factors influence the performance of cesarean delivery. Although it is not possible to consider all potential factors in the study due to data limitations, a more thorough analysis is required to investigate the relationship between various factors and cesarean delivery performance.
4 Discussion and Conclusion
In the last two and a half decades, there has been an increasing trend of C-section births in India, with a remarkable increase after 2005. There is an increased rate of C-section deliveries in states with a marked demographic transition as well as high institutional births. It has been found that the number of cesarean sections is highest in the first order of births, then it continues to decline. The reason for this may be that with the increase in parity, women may develop the physical and psychological resilience to endure the agony of vaginal delivery. But inexperienced women may be completely unprepared to experience pain and may panic, which may prompt them to opt for a cesarean section sooner (Narzary et al., 2017). The higher likelihood of cesarean deliveries is associated with mothers aged more than 25 years (Ecker et al., 2001; Rydahl et al., 2019), women with higher education, Muslim religious women, non-SC/ST/OBC women, women belonging to the richest class, women residing in an urban place, women residing in south India (Mishra and Ramanathan, 2002), women having exposure to mass media, women with high BMI, women with less than 152.4 cm height, a smaller number of eligible women in households, women with a comparatively smaller desired number of children, women with ANC visits in private hospitals, women who have complications during pregnancy as well as deliver in private hospitals.
Pregnancy morbidity is typically the cause of the increased risk of caesarean delivery linked to advanced mother age. Although the absolute risks are determined to be minimal, increasing maternal age is linked to higher rates of obstetric difficulties and previous medical disorders (Timofeev et al., 2013). Notably, older women had a much higher overall risk of caesarean delivery (mostly due to evidence of a prior uterine scar). However, women who were 35.0 years of age or older also had a higher percentage of elective caesarean deliveries. The study cited above indicates that women’s socioeconomic standing and level of education are important factors that influence the prevalence of caesarean sections. According to earlier research, social standing and education had an impact on the probability that the last birth was a CD (Mishra et al., 2002). High-educated women might have more control over their own health care choices, including the choice to have a caesarean section. Wealthy and middle-class homes are more likely to have overweight or obese women, and the results show that these women are more likely to give birth by caesarean section than women from lower-income households (Srivastava et al., 2020).
The results show that private hospitals had a greater rate of C-section deliveries than public hospitals, which is consistent with other research (Das and Sahoo, 2019; Narzary et al., 2017). It would be foolish to assume right away that this is due to private health centres’ profit-driven mindset. In actuality, private maternity hospitals in India tend to be well-equipped, while public health facilities are usually underequipped. Therefore, the private health centre is visited by anyone who feels that there may be birth issues, wants to be safe, or has the financial means to pay for services. In the end, this raises the rate of caesarean sections in private hospitals. The mother’s health is not improved by non-medical caesarean sections. The number of caesarean sections performed for non-medical reasons may therefore be decreased with the help of an efficient information, education, and communication program.
Authors’ Contributions
All authors contributed equally to the development of the idea, analysis, writing and editing of the final version of the manuscript.
Funding
This research has not been financially supported by any organization or funding agency.
Availability of Data and Materials
Data are available on request from https://dhsprogram.com/Data/.
Declarations
Conflict of Interest
No potential conflict of interest was reported by the author(s).
Acknowledgements
We are thankful to the anonymous reviewers for their suggestion to improve the quality of the original manuscript.
References
Althabe, F., and Belizán, J. M. (2006). Caesarean section: the paradox. The Lancet, 368(9546), 1472–1473.
Belizán, J. M., Showalter, E., Castro, A., Bastian, H., Althabe, F., Barros, F. C., … and Griffin, A. (1999). Rates and implica tions of caesarean sections in Latin America: ecological study Commentary: all women should have a choice Commentary: increase in caesarean sections may reflect medical control not women’s choice Commentary: “health has become secondary to a sexually attractive body”. Bmj, 319(7222), 1397–1402.
Braveman, P., Egerter, S., Edmonston, F., and Verdon, M. (1995). Racial/ethnic differences in the likelihood of cesarean delivery, California. American Journal of Public Health, 85(5), 625–630.
Bruekens P (2001), Over-medicalization of maternal care in developing countries. In Brouwere VD and Lerberghe WV (ed.). Safe Motherhood Strategies: A Review of the Evidence. Antwerp: ITG Press.
Crane, S. S., Wojtowycz, M. A., Dye, T. D., Aubry, R. H., and Artal, R. (1997). Association between pre-pregnancy obesity and the risk of cesarean delivery. Obstetrics and Gynecology, 89(2), 213–216.
Das, S., and Sahoo, H. (2019). Caesarean section delivery in India: public and private dichotomy. Demography India, 48(1), 36–48.
DiMatteo, M. R., Morton, S. C., Lepper, H. S., Damush, T. M., Carney, M. F., Pearson, M., and Kahn, K. L. (1996). Cesarean childbirth and psychosocial outcomes: a meta-analysis. Health psychology, 15(4), 303.
Ecker, J. L., Chen, K. T., Cohen, A. P., Riley, L. E., and Lieberman, E. S. (2001). Increased risk of cesarean delivery with advancing maternal age: indications and associated factors in nulliparous women. American journal of obstetrics and gynecology, 185(4), 883–887.
Gordon D, Milberg J, Daling J, Hickok D (1991), Advanced Maternal Age as Risk Factor for cesarean delivery. Obstetrics and Gynaecology 77(4): 493–497.
Irwin D E, Savitz D A, Bowes W A, Andre K A (1996), Race, Age, and cesarean delivery in a Military Population. Obstetrics and Gynaecology 88: 530–533.
Keeler, E. B., and Brodie, M. (1993). Economic incentives in the choice between vaginal delivery and cesarean section. The Milbank Quarterly, 365–404.
Lyter, S. C. (1986). Cesarean childbirth: Bio-psycho-social effects. Rutgers The State University of New Jersey, School of Graduate Studies.
Mc. Closkey L (1988), The Risk of Cesarean Childbirth among Low Risk Prim Porous Women: Differences in three Practice Settings. Doctoral Dissertation Abstracts International 50:1310.
Mishra, U. S., and Ramanathan, M. (2002). Delivery-related complications and determinants of caesarean section rates in India. Health policy and planning, 17(1), 90–98.
Mossialos, E., Allin, S., Karras, K., and Davaki, K. (2005). An investigation of Caesarean sections in three Greek hospitals: the impact of financial incentives and convenience. The European Journal of Public Health, 15(3), 288–295.
Narzary, P. K., Tsawe, M., and Susuman, A. S. (2017). Correlates of caesarean section among delivery in health institutions in India. Journal of Asian and African Studies, 52(3), 314–323.
Pai, M. (2000). Unnecessary medical interventions: caesarean sections as a case study. Economic and Political Weekly, 2755–2761.
Perez-Escamilla R, Maulen-Radovan I, Dewey K G (1996), The Association between Cesarean Delivery and Breast-feeding Outcomes among Mexican Women. American Journal of Public Health 86: 832–836.
Poma, P. A. (1998). Effect of departmental policies on cesarean delivery rates: a community hospital experience. Obstetrics & Gynecology, 91(6), 1013–1018.
Porreco, R. P., and Thorp, J. A. (1996). The cesarean birth epidemic: trends, causes, and solutions. American journal of obstetrics and gynecology, 175(2), 369–374.
Puentes-Rosas E, Gomez-Dantes O, Garrido-Latorre F (2004), Cesarean Sections in Mexico: Tendencies, Levels and Related Factors. Salud Pública De México 46(1): 1–7.
Puentes-Rosas E, Gomez-Dantes O, Garrido-Latorre F (2004), Cesarean Sections in Mexico: Tendencies, Levels and Related Factors. Salud Pública De México 46(1): 1–7.
Rydahl, E., Declercq, E., Juhl, M., and Maimburg, R. D. (2019). Cesarean section on a rise – Does advanced maternal age explain the increase? A population register-based study. PloS one, 14(1), e0210655.
Schimmel, J., and Granstrom, A. (1996). Fire severity and vegetation response in the boreal Swedish forest. Ecology, 77(5), 1436–1450.
Sreevidya, S., and Sathiyasekaran, B. W. C. (2003). High caesarean rates in Madras (India): a population-based cross sectional study. BJOG: an international journal of obstetrics and gynaecology, 110(2), 106–111.
Srivastava, S., Chaurasia, H., Singh, K. J. K., and Chaudhary, P. (2020). Exploring the spatial patterns of cesarean section delivery in India: Evidence from National Family Health Survey-4. Clinical Epidemiology and Global Health, 8(2), 414–422.
Taffel S M (1994), Cesarean delivery in the United States. Vital and Health Statistics, 21(51): 1–24.
Timofeev, J., Reddy, U. M., Huang, C. C., Driggers, R. W., Landy, H. J., and Laughon, S. K. (2013). Obstetric complications, neonatal morbidity, and indications for cesarean delivery by maternal age. Obstetrics and gynecology, 122(6), 1184.
Wilkinson, A. (1998). Empowerment: theory and practice. Personnel review, 27(1), 40–56.
Woolbright, L. A. (1996). Why is the cesarean delivery rate so high in Alabama? An examination of risk factors, 1991–1993. Birth, 23(1), 20–25.
World Health Organisation (1985), Appropriate Technology for Birth. Lancet 2:436–7.
Biographies

Brijesh P. Singh is currently working as a Professor in the Department of Statistics, Institute of Science, Banaras Hindu University, Varanasi, India. He has obtained Ph.D. degree in Statistics from Banaras Hindu University, Varanasi and has more than 20 years’ experience of teaching and research in the area of Statistical Demography. He has published 205 research papers in the refereed journals and books of national and international repute. He edited 2 books containing research papers and 2 reference books. Under his guidance 8 students successfully awarded their Ph.D. degree and presently 4 students doing research work under his guidance. His research interests are in statistical modelling and analysis of demographic data specially fertility, mortality, reproductive health and domestic violence with its reason and consequences.

Tanya Singh is currently working as an Assistant Professor in the Department of Statistics, St. John’s College, Dr. Bhimrao Ambedkar University, Agra. She has more than 5 years of teaching and research exposure. She received her Bachelor’s degree in Science from Allahabad University in 2016, Master’s degree in Statistics from Allahabad University in 2018 and Doctorate degree in Statistics from Banaras Hindu University in 2023 respectively. Her research areas include Mathematical Demography, Inference, Distribution theory, Applied Statistics, etc. She has many publications in highly-respected journals.

Alok Kumar Singh is working as an Assistant Professor in Department of Statistics RBS College, Agra. He has more than seven years of teaching experience and 11 years of research exposure. He also worked as a Guest Faculty in Department of Statistics, University of Allahabad, Prayagraj, UP, India. His Research areas include Outliers, Spatial data, modelling and Inference, Applied Statistics, Distribution Theory, etc. He has research articles in SCOPUS, UGC-care indexed as well as peer reviewed journals with impact factors also edited 7 books. He is presently supervising two students for their research work. He has reviewed many research articles. Dr Singh received his Graduation and Post-graduation degrees in Statistics from University of Allahabad, Prayagarj, UP. He completed his Doctorate in Statistics from University of Allahabad, Prayagraj, UP. He qualified NET in Statistics. He is member of Royal Statistical Society, Bernoulli Society, Institute of mathematical Statistics and editorial member of many journals.
Journal of Reliability and Statistical Studies, Vol. 19, Issue 1 (2026), 149–172
doi: 10.13052/jrss0974-8024.1917
© 2026 River Publishers