A Factor Analysis Approach to Evaluate Batting and Bowling Performance in International Cricket Formats (Tests, ODIs, and T20Is)
Kuldeep Dahal and Sanjib Choudhury*
Department of Humanities and Basic Sciences (Mathematics), Indian Institute of Information Technology Senapati, Manipur, India
E-mail: kuldeep24030301@iiitmanipur.ac.in; sanjib@iiitmanipur.ac.in
*Corresponding Author
Received 29 June 2025; Accepted 08 November 2025
Abstract
Batting and bowling performances are crucial to evaluating the overall contribution of cricket players across all international formats. This study applies factor analysis to assess player performance in Test, ODI, and T20I formats. The dataset comprises 192 players from the 2021–2023 ICC World Test Championship (Test), 149 players from the 2023 ICC Cricket World Cup (ODI), and 193 players from the 2022 ICC T20 World Cup (T20I). The analysis reveals that in the limited-overs formats – ODIs and T20Is – batting performance tends to dominate, accounting for 45.66% and 46.77% of the variance, respectively, compared to bowling performance, which contributes 34.36% in ODIs and 35.61% in T20Is. However, the test format exhibited a near-equal distribution of variance with batting 40.61% and bowling 39.80% of the total variance.
Keywords: Factor analysis, Kaiser-Meyer-Olkin test, Bartlett’s test of Sphericity, rotated component matrix, eigenvalues, scree plot, communalities, cricket.
1 Introduction
Cricket is a bat and ball game played between two opposing teams of eleven players on a field of 20 metres length that is located in the middle of a field; the end is marked with a wicket comprising of three stumps and two bails. Cricket has developed to become the second most followed sports in the world, and the sport has a strong following in South Asia, Australia, parts of Africa and the Caribbean, as well as the United Kingdom, where it originated in the 16th century. International Cricket Council (ICC) is the governing body of the sport that operates in Dubai. Modern day cricket is played in three different forms: Test cricket which is the classic form of the game and can last up to five days; One-Day International (ODIs) which lasts no more than 50 overs on each side; and Twenty-Twenty International (T20Is), a short format which is 20 to the side and was introduced in 2007 but has rapidly become popular due to its fast nature of play. ICC has institutionalised world championships, the first of which was the ODI World Cup (first held in 1975), followed by the T20 World Cup (introduced in 2007) and the World Test Championship (launched in 2019) which offers a league format to Test cricket.
Both formats involve specific skills, tactical issues, and physical and mental capacities. Test cricket focuses on stamina, technical richness and an equal role of both the batting and the bowling, ODIs mix the construction of constant inning with speed, T20Is compensate forceful batting, quick judgment and effective bowling. These conflicting demands offer special challenges to players and provide much ground to the analysis of performances. Traditionally, long-established descriptive statistics including batting averages, strike rates, bowling economy rates, and wicket tally, have been of great importance in assessing the performance of players, and continue to play a central role in the game at present. However, contextual variables like the condition of the pitch, the outcome of the toss, the sequence of the match, as well as the team balance of batsmen, bowlers, and all-rounders, also determine the success in cricket.
Cricket performance analysis has taken a rapid forward in the recent decades with the transformation that has occurred in the traditional statistics to the sophisticated data-driven details. Preliminary research took a probabilistic approach: Kimber and Hansford [1] used a geometric distribution to describe batting dismissal, and Preston and Thomas [2] developed the best batting strategies to play ODIs. Team composition was mathematically modelled by Barr and Kantor [3], and Swartz et al. [4] conducted optimal batting orders with the use of probabilistic modelling. Bailey et al. [5] and Norman and Clarke [6] used dynamic programming to investigate ODI match dynamics and batting sequences, respectively. Van Staden [7] provided the techniques of graphic representation of batting and bowling effectiveness and Sharp et al. [8] used integer programming to select the T20 teams. Subsequently, Lemmer [9] and Amin et al. [10] used optimisation and data-envelopment analysis to measure the efficiency of players, and Dey et al. [11] suggested various decision-making models to be used by players in the Indian premier league. Such studies proved that quantitative modelling is valuable, and it can often answer very specific questions like batting order or bowler rankings.
The development of multivariate methods signaled the beginning of holistic evaluation. As Sharma [12] did to the Indian Premier League (IPL), one could use factor analysis and prove that latent constructs would be useful in reflecting both batting and bowling performance. Shah et al. [13] applied factor analysis to ODIs and T20Is to establish that batting and bowling are constant underlying factors regardless of the format. Outside the sphere of methods, factor analysis has a long history of use in finance (Valadkhani et al. [14]) or in methodological research (Shrestha [15]), which highlights its versatility. However, its use in the game of cricket is still minimal and Test cricket more so has been sidelined.
At the same time, the emergence of machine learning and data science has reshaped cricket analytics. Alaka et al. [16] suggested deep learning-based features extraction models, whereas Abbas and Haider [17] contrasted the Duckworth-Lewis-Stern algorithm with machine-learning appraoches. Ayub et al. [18] have designed CAMP, a performance measure that considers the context and the opposition and match scenarios. Mullick [19] analysed the long term ODI trends, while Sahoo et al. [20] employed Random Forest and LASSO regression to determine the performance indicators of T20. Vora [21] used data-based methods in identifying the most successful XI using the World Cup data, whereas Thilakarathne et al. [22] presented predictive modelling in the context of player outcomes. There is increased dependence on predictive frameworks, e.g., Chathurangi [23] on impact-based rankings and Raj and Kumar [24] on machine learning in cricket analytics. Although these approaches are powerful, many function as “black boxes,” offering limited interpretability. Consequently, coaches and selectors often struggle to derive transparent and actionable insights from their results.
Nevertheless, there are still huge gaps despite these developments. Early techniques were in many cases format-specific, and did not have a standard framework. Factor analysis has been used to offer interpretability but limited primarily to ODIs and T20s and Test cricket has not been explored fully. The machine learning techniques, although improving the predictive power, often lost their transparency, making them less pragmatic for decision making.
This paper fills in these gaps by performing a systematic application of factor analysis on all three formats, namely Tests, ODIs and T20Is, on both latest ICC tournament data: the World Test Championship (2021–2023), the ODI World Cup (2023) and the T20 World Cup (2022). The study uses a set of similar batting and bowling variables to obtain latent factors, which capture the performance and compare their effects across formats. The contributions are tripartite:
(1) generalizing factor analysis to all the international formats, including Tests;
(2) making it up to date with the latest tournament data; and
(3) making it interpretable in terms of assessing the balance between batting and bowling, as well as in terms of the implications it has on the player evaluation, team selection, and performance management.
2 Methodology and Data
2.1 Methodology
The following statistical and mathematical concepts were used to determine the validity and interpretability of the factor solution:
2.1.1 Factor analysis
Factor analysis is a statistical method used for the analysis of interrelationships among variables to determine a new set of fewer factors than the existing variables. Factor analysis is among the most popular methods for multivariate analysis (Hair et al. [25]). Factor analysis is aimed at getting the reduced set of uncorrelated latent variables through a set of linear combinations of the given variables to maximize the variance in these components.
2.1.2 Kaiser-Meyer-Olkin measure of sampling adequacy
KMO calculates the fraction of variance among the variables that could be common variance (potentially the result of underlying causes). The closer the value is to 1, the better the sample is for factor analysis; values greater than 0.6 are acceptable.
2.1.3 Bartlett’s test of sphericity
Bartlett’s test for Sphericity tests the null hypothesis
H: The variables are orthogonal, that is, the initial correlation matrix is an identity matrix, reflecting that the variables are not related and hence inappropriate for the detection of structure.
Against the alternative hypothesis,
H: The variables are not orthogonal, that is, the variables in the correlation matrix are correlated sufficiently enough that the correlation matrix departs considerably from the identity matrix.
The p-value, p 0.05, suggests that factor analysis would be feasible for the dataset.
2.1.4 Principal component analysis (PCA)
PCA is the method used for extracting the factors. Factor analysis is carried out through Principal Component Analysis (PCA) to determine the validity of the items and classify them into salient groups.
2.1.5 Eigenvalues
Eigenvalues represent the proportion of variance in the data that is accounted for by each factor. In the present study, only those factors with eigenvalues above 1 were deemed significant according to the Kaiser criterion.
2.1.6 Variance explained
It is the percentage of total variance in the data explained for each factor. It is utilized in order to calculate the contribution of the batting and bowling aspects towards the overall player performance.
2.1.7 Rotated component matrix
It is a table listing the factor loadings for each variable on each rotated factor. Varimax rotation, an orthogonal factor rotation procedure, eases interpretation by maximizing the variance of the squared loadings, reducing the number of variables having high loadings on any factor.
2.1.8 Factor loadings
It represents the correlation coefficients for the factor and the variables. Large loadings (usually 0.5) represent a large correlation between the factor and the variable.
2.1.9 Scree plot
A graphical depiction of eigenvalues that assists in the visual determination of the number of components to keep through the location of the “elbow” point in the graph.
2.1.10 Communalities
Communalities after extraction represent the amount of variance in each variable that can be explained by the retained factor. The communalities suggest the common variance in the dataset.
All statistical analyses were done with IBM SPSS version 30.
2.2 Data
This study presents a comprehensive factor analysis of player performance across all three international formats of cricket – Tests, One Day Internationals (ODIs), and Twenty20 Internationals (T20Is). The dataset was compiled from official match records available on ESPNcricinfo [26] and the ICC website [27]. The analysis focuses on three major tournaments: the 2021–2023 ICC World Test Championship cycle for Tests, the 2023 ICC Cricket World Cup for ODIs, and the 2022 ICC T20 World Cup for T20Is. A brief overview of these tournaments is provided below.
• ICC World Test Championship 2021–2023:
The International Cricket Council (ICC) runs the premier global competition for Test cricket, the World Test Championship (WTC). The 2021–2023 cycle was the second WTC, running from August 2021 through June 2023. Nine full-member countries played: Australia, India, England, South Africa, New Zealand, Pakistan, Sri Lanka, West Indies, and Bangladesh. Each country played six bilateral Test series, three home and three away, in league format. Points were earned for each win, and the two leading teams played the final.
The WTC Final was hosted on 7–11 June 2023 at London’s The Oval between India and Australia. The match was dominated by Australia, and the title as well. The event emphasized the classic and most rigorous form of the game, the emphasis on endurance, consistency, and technical skills, played in five-day matches.
• ICC Cricket World Cup 2023
The ICC Cricket World Cup is the official global championship for the One-Day Internationals (ODIs). It is administered by the ICC and is played every four years. In 2023, the 13th Cricket World Cup was hosted exclusively by India from 5 October to 19 November 2023. 10 teams played: India, Australia, England, New Zealand, Pakistan, South Africa, Sri Lanka, Bangladesh, Afghanistan, and the Netherlands.
The competition was played in the format of a single round-robin, in which each of the teams played against the other once. The top teams progressed to the semi-finals, then the final. On 19 November 2023, the Narendra Modi Stadium in Ahmedabad witnessed the final match between India and Australia. It was won by Australia, securing their sixth ODI World Cup crown. All the matches from the competition were covered in the present study in order to capture the complete performance of the players in the 50-over format.
• ICC Men’s T20 World Cup 2022
The ICC T20 World Cup is the international championship in the sport of Twenty20 International cricket. It was hosted in 2022 in Australia between 16 October and 13 November, with 16 teams participating in total. The competition was split into two stages: the First Round and the Super 12. In the First Round, there were 8 teams, while in the Super 12 stage, there were 12 teams – 8 directly qualified teams and 4 First Round winners. The teams involved were: Australia, India, England, Pakistan, New Zealand, South Africa, Sri Lanka, Bangladesh, Netherlands, Zimbabwe, Ireland, and Afghanistan. The final was played on 13 November 2022 at the Melbourne Cricket Ground, in which England beat Pakistan for their second T20 World Cup win. The competition revealed important insights into short-format, high-pressure performance. Only those players who played during the Super 12 stage were included for analysis in the present work as that phase was the most competitive part in the competition.
2.2.1 Data handling and preprocessing
As we have mentioned earlier, the current data was compiled based on official match reports on ESPNcricinfo and the ICC website, including three more recent international competitions: the ICC World Test Championship (2021–2023), ICC Men One-Day International World Cup (2023), and ICC Men Twenty20 World Cup (2022). Every member who played at least one match of these tournaments was included in the dataset. Naturally the individuals contributing only in one field were given a score of zero on the variables in-the other field. Therefore, a specialist batsman who did nothing with the ball or a specialist bowler who did not do anything with the bat were assigned zeroes in all the distance of the bowling metrics or all the distance of the batting metrics, respectively. All-rounders were allowed to keep all their batting and bowling statistics. The coding scheme ensured that all players were observed in the entire category of variables and hence the consistency in formats was maintained.
Since the performance indicators that were used in this study were measured on different scales (e.g., the maximum run scores, the strike rates in percentage, the economy rates in the number of runs per over), the variables were all given a z-score before factor analysis was used. This normalisation function has made all variables work on the same scale therefore making them comparable and hence none of the indicators interfering with the resultant factor structure.
2.2.2 The dataset used in this study consists of
| Format | Total Players |
| Test (WTC 2021–23) | 192 |
| ODI (WC 2023) | 149 |
| T20 (T20 WC 2022) | 193 |
2.2.3 Variable selection
Eight variables have been chosen in an attempt to assess the performance of players, in which five of them were associated with batting and three with bowling. The batting indicators included highest individual score (HS), batting average (Ave), the strike rate (SR), the total number of fours (4s) and the total number of sixes (6s). The bowling indicators include bowling average (Bowl Ave), economy rate (Econ) and bowling strike rate (Bowl SR). The choice was based on previous works in the field of cricket analytics, which have effectively implemented factor analysis on the basis of such pointers (Sharma [12]; Shah et al. [13]). Sharp et al. [8] and Lemmer [9] also used these eight-variable framework in their respective studies. The international cricket council (ICC) and ESPNcricinfo have also been used to widely report the measures hence making them reliable and comparable across formats.
The chosen indicators collectively capture a number of performance dimensions. Magnitude is expressed in terms of HS, total fours, total sixes, and wickets; efficiency is expressed in terms of strike rate, economy rate and bowling strike rate; consistency is measured in terms of batting and bowling averages. As a result, this balanced set provides a parsimonious but all-encompassing description of performance by the players. However, other measures, including dot-ball percentage, boundary percentage, and fielding measures, have been excluded due to their inability to be around in all formats and tournaments.
The batting and bowling statistics used in this study are described below.
2.2.4 Measures of batting statistics
1. Highest Score (HS) – The maximum runs scored by a batsman in a single inning during the tournament.
2. Batting Average (Ave) – Total runs divided by the number of times the batsman got out
3. Strike Rate (SR) – (Runs/Balls faced) 100
4. Number of 4s (4s) – Total number of boundaries (4 runs) hit by the batsman
5. Number of 6s (6s) – Total number of sixes (6 runs) hit by the batsman
2.2.5 Measures of bowling statistics
1. Bowling Average (Bowl Ave) – Runs conceded / Wickets taken
2. Economy Rate (Econ) – Runs conceded per over bowled
3. Bowling Strike Rate (Bowl SR) – Total number of balls bowled divided by the total number of wickets taken
3 Results and Interpretations
To analyse player performances in all cricket formats, in particular, the 2021–2023 World Test Championship for Tests, the 2023 ICC Men’s Cricket World Cup for ODIs, and the 2022 ICC Men’s T20 World Cup for T20, we used Principal Component Analysis (PCA). PCA is a robust dimension reduction technique that helps in the explanation of the validity of observed variables and interrelated variables into meaningful factor or cluster groups. To enhance the interpretability of the resulting factors and to maximize the number of distinct components, we applied an orthogonal varimax rotation. This rotation technique simplifies the factor structure by maximizing the variance of squared loadings, allowing each variable to load highly on a single factor while maintaining minimal loadings on other factors.
3.1 Kaiser-Meyer-Olkin (KMO) Measure of Sampling Adequacy and Bartlett’s Test of Sphericity
| Test | ODI | T20 | ||
| Kaiser-Meyer-Olkin Measure of Sampling Adequacy. | 0.804 | 0.777 | 0.835 | |
| Bartlett’s | Approx. ChiSquare | 1641.616 | 1209.907 | 1609.100 |
| Test of | df | 28 | 28 | 28 |
| Sphericity | Sig. (p) | 0.001 | 0.001 | 0.001 |
Interpretation of KMO and Bartlett’s test of Sphericity:
In the table, the KMO statistics are shown. The KMO values for all three formats- Test (0.804), ODI (0.777), and T20 (0.835) are well above the recommended threshold value of 0.6, indicating that the sampling is adequate and the data are suitable for factor analysis.
Further Bartlett’s test of Sphericity yielded highly significant results for all formats (p 0.001), which indicate the presence of sufficient correlations among variables. This result leads us to reject the null hypothesis that the correlation matrix is an identity matrix. (Refer to the above table.)
3.2 Scree Plot
3.2.1 World Test Championship (Test)
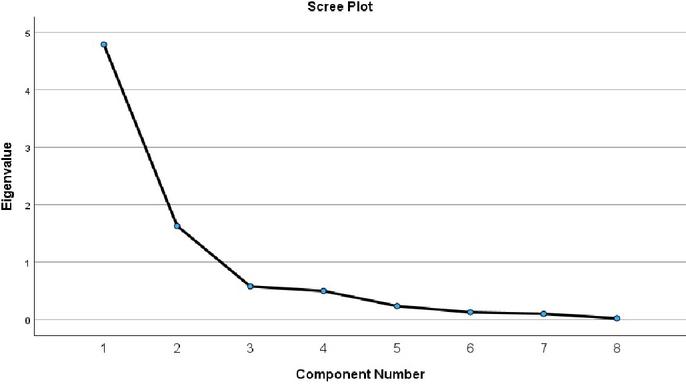
Figure 1
3.2.2 ICC Men’s Cricket World Cup (ODI)
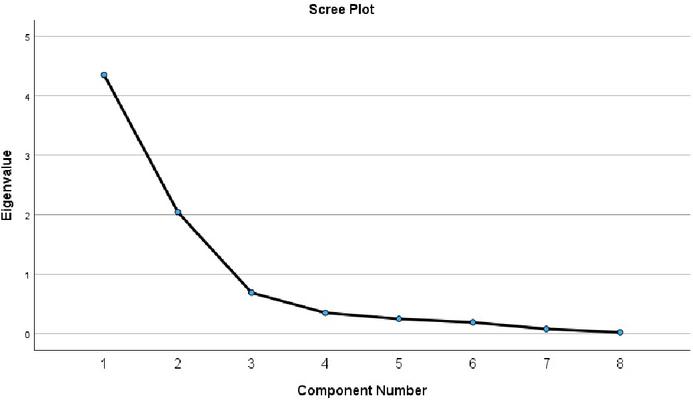
Figure 2
3.2.3 ICC Men’s T20 World Cup (T20I)
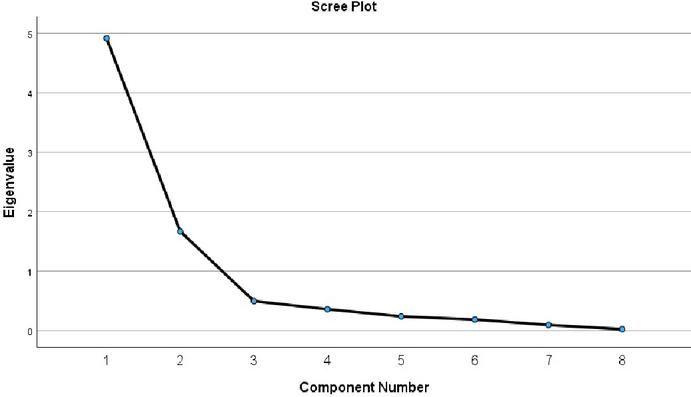
Figure 3
Scree Plot graphs are shown in Figure 1 for ICC World Test Championship (WTC) 2021–2023, Figure 2 for the ICC Men’s Cricket World Cup (2023), and Figure 3 for the ICC Men’s T20 World Cup (2022).
Interpretation of Scree Plot
As a part of the factor analysis, scree plots were generated for each format: Test, ODI, and T20s. To visually determine the appropriate number of factors to retain. In these graphs, eigenvalues are plotted against their corresponding component numbers along the X-axis in the order of extraction.
For all three formats, the scree plots reveal a distinct elbow after the second component, representing a sharp decline in eigenvalues. The scree plots for all three modes identified a clear elbow after the second component, representing a sharp drop in eigenvalues. Only the first two components in each format had eigenvalues greater than 1, representing the largest proportion of total variance. (Refer to Figures 1, 2, and 3).
This consistent pattern of all three formats supports the retention of these factors. These two retained components primarily represent batting and bowling performance, which are the key dimensions contributing to the variance in player performance data. Thus, the application of the scree test validated the selection of two factors aligning with both the eigenvalues and total variance
3.3 Rotated Component Matrix and Communalities After Extraction
3.3.1 (World Test Championship) Test
Table 1
| Rotated factor loadings and communalities | |||
| Communalities | |||
| Variables | Factor 1 | Factor 2 | after Extraction |
| The highest individual score of the batsman | 0.832 | -0.402 | 0.854 |
| Number of four(s) hit | 0.820 | -0.257 | 0.738 |
| Number of six(s) hit | 0.799 | 0.114 | 0.652 |
| Batting Average | 0.767 | -0.455 | 0.796 |
| Batting Strike Rate | 0.722 | -0.256 | 0.587 |
| Bowling Average | -0.183 | 0.960 | 0.955 |
| Bowling Strike Rate | -0.189 | 0.952 | 0.941 |
| Economy of the bowler | -0.259 | 0.918 | 0.910 |
| Extraction Method: Principal Component Analysis. Rotation Method: Varimax with Kaiser Normalization. | |||
3.3.2 (ICC Men’s Cricket World Cup) ODI
Table 2
| Rotated factor loadings and communalities | |||
| Communalities | |||
| Variables | Factor 1 | Factor 2 | after Extraction |
| The highest individual score of the batsman | 0.930 | -0.225 | 0.915 |
| Batting Average | 0.886 | -0.211 | 0.829 |
| Number of six(s) hit | 0.872 | -0.027 | 0.760 |
| Number of four(s) hit | 0.867 | -0.242 | 0.810 |
| Batting Strike Rate | 0.644 | -0.041 | 0.416 |
| Bowling Average | -0.115 | 0.971 | 0.956 |
| Bowling Strike Rate | -0.092 | 0.955 | 0.920 |
| Economy of the bowler | -0.240 | 0.860 | 0.797 |
| Extraction Method: Principal Component Analysis. Rotation Method: Varimax with Kaiser Normalization. | |||
3.3.3 (ICC Men’s T20 World Cup) T20I
Table 3
| Rotated factor loadings and communalities | |||
| Communalities | |||
| Variables | Factor 1 | Factor 2 | after Extraction |
| The highest individual score of the batsman | 0.927 | -0.243 | 0.918 |
| Batting Average | 0.846 | -0.218 | 0.763 |
| Number of six(s) hit | 0.837 | -0.123 | 0.716 |
| Number of four(s) hit | 0.845 | -0.258 | 0.780 |
| Batting Strike Rate | 0.765 | -0.238 | 0.642 |
| Bowling Average | -0.199 | 0.954 | 0.960 |
| Bowling Strike Rate | -0.230 | 0.948 | 0.951 |
| Economy of the bowler | -0.273 | 0.887 | 0.861 |
| Extraction Method: Principal Component Analysis. Rotation Method: Varimax with Kaiser Normalization. | |||
The factor loadings are given in Table 1 for ICC World Test Championship (WTC) 2021–2023, Table 2 for the ICC Men’s Cricket World Cup (2023), and Table 3 for the ICC Men’s T20 World Cup (2022).
Interpretation of Rotated Component Matrix and Communalities
The rotated component matrix identified two distinguishable factors in all three forms: Test, ODI, and T20 (refer to Tables 1, 2, & 3). In all three cases, the batting variables – such as highest individual score, batting average, strike rate, fours, and sixes – loaded strongly on Factor 1, with the typical loadings above 0.70. On the other hand, the bowling variables – such as bowling average, bowling strike rate, and economy rate – indicated high loadings on Factor 2, usually above 0.85.
In the Test format, the variables of the highest score (0.832), sixes (0.799), fours (0.820), and batting average (0.767), batting strike rate (0.722) showed heavy loadings under Factor 1, whereas bowling average (0.960), bowling strike rate (0.952), and bowling economy rate (0.918) showed heavy loadings under Factor 2 (refer to Table 1).
The ODI format followed a similar pattern where the variables batting average (0.886), batting strike rate (0.644), sixes (0.872), fours (0.867), highest score (0.930), loaded onto Factor 1, whereas bowling strike rate (0.955), bowling average (0.971) and economy of the bowler (0.860) were strongly associated with Factor 2 (refer to Table 2).
For the T20 format Factor 1 included, the highest score (0.927), batting average (0.846), batting strike rate (0.765) and the boundary variables, sixes (0.837) and fours (0.845), whereas Factor 2 was dominated by bowling average (0.954), bowling strike rate (0.948) and economy rate (0.887) (refer Table 3).
These consistent loading patterns across all three formats clearly indicate that Factor 1 represents “Batting Performance Factor” while Factor 2 represents “Bowling Performance Factor.”
The communality value corresponding to the first variable (the highest individual score of the batsman) for the World Test Championship (Test) (refer to Table 1) is 0.854, indicating that 85.4% of the common variance is associated with this variable. Similarly, 73.8%, 65.2%, 79.6%, 58.7%, 95.5%, 94.1%, and 91% of the common variance is associated with the following variables: number of fours hit, number of sixes hit, batting average, batting strike rate, bowling average, bowling strike rate, and economy of the bowler, respectively.
In the ODI format (Table 2), the communalities were Highest score (91.5%), bowling average (82.9%) Sixes (76%), Fours (81%), batting strike rate (41.6%), bowling average (95.6%), bowling strike rate (92%) and economy of the bowler (79.5%).
In the T20 format (Table 3), the communalities were similarly high: the highest individual score of the batsman (91.8%), batting average (76.3%), number of sixes hit (71.6%), number of fours hit (78%), batting strike rate (64.2%), bowling average (96%), bowling strike rate (95.1%), and economy of the bowler (86.1%).
This high communality values indicate that a significant proportion of variance in the selected variables is shared, holding up the validity and reliability of the extracted factors.
3.4 Eigenvalues and Total Variance Explained
3.4.1 (World Test Championship) Test
Table 4
| Extraction Sums of | Rotation Sums of | ||||||||
| Initial Eigenvalues | Squared Loadings | Squared Loadings | |||||||
| % of | Cumulative | % of | Cumulative | % of | Cumulative | ||||
| Component | Total | Variance | % | Total | Variance | % | Total | Variance | % |
| 1 | 4.798 | 59.979 | 59.979 | 4.798 | 59.979 | 59.979 | 3.249 | 40.613 | 40.613 |
| 2 | 1.635 | 20.433 | 80.413 | 1.635 | 20.433 | 80.413 | 3.184 | 39.799 | 80.413 |
| 3 | 0.579 | 7.235 | 87.648 | ||||||
| 4 | 0.499 | 6.239 | 93.887 | ||||||
| 5 | 0.237 | 2.961 | 96.848 | ||||||
| 6 | 0.129 | 1.608 | 98.457 | ||||||
| 7 | 0.101 | 1.261 | 99.717 | ||||||
| 8 | 0.023 | 0.283 | 100.000 | ||||||
| Extraction Method: Principal Component Analysis. | |||||||||
3.4.2 (ICC Men’s Cricket World Cup) ODI
Table 5
| Extraction Sums of | Rotation Sums of | ||||||||
| Initial Eigenvalues | Squared Loadings | Squared Loadings | |||||||
| % of | Cumulative | % of | Cumulative | % of | Cumulative | ||||
| Component | Total | Variance | % | Total | Variance | % | Total | Variance | % |
| 1 | 4.355 | 54.432 | 54.432 | 4.355 | 54.432 | 54.432 | 3.653 | 45.663 | 45.663 |
| 2 | 2.048 | 25.595 | 80.027 | 2.048 | 25.595 | 80.027 | 2.749 | 34.364 | 80.027 |
| 3 | 0.693 | 8.663 | 88.689 | ||||||
| 4 | 0.353 | 4.417 | 93.106 | ||||||
| 5 | 0.251 | 3.136 | 96.242 | ||||||
| 6 | 0.192 | 2.399 | 98.641 | ||||||
| 7 | 0.082 | 1.023 | 99.664 | ||||||
| 8 | 0.027 | 0.336 | 100.000 | ||||||
| Extraction Method: Principal Component Analysis. | |||||||||
3.4.3 (ICC Men’s T20 World Cup) T20I
Table 6
| Extraction Sums of | Rotation Sums of | ||||||||
| Initial Eigenvalues | Squared Loadings | Squared Loadings | |||||||
| % of | Cumulative | % of | Cumulative | % of | Cumulative | ||||
| Component | Total | Variance | % | Total | Variance | % | Total | Variance | % |
| 1 | 4.920 | 61.503 | 61.503 | 4.920 | 61.503 | 61.503 | 3.742 | 46.771 | 46.771 |
| 2 | 1.671 | 20.881 | 82.385 | 1.671 | 20.881 | 82.385 | 2.849 | 35.613 | 82.385 |
| 3 | 0.499 | 6.230 | 88.622 | ||||||
| 4 | 0.362 | 4.520 | 93.142 | ||||||
| 5 | 0.240 | 3.003 | 96.145 | ||||||
| 6 | 0.187 | 2.338 | 98.483 | ||||||
| 7 | 0.096 | 1.198 | 99.681 | ||||||
| 8 | 0.026 | 0.319 | 100.00 | ||||||
| Extraction Method: Principal Component Analysis. | |||||||||
Interpretation of Eigenvalues and total variance explained
Based on the Kaiser criterion (eigenvalue 1), two components were extracted in each of the three formats – Test, ODI, and T20. The rotated component solution, using Varimax rotation, explained a high percentage of the total variance in all three cases: 80.41% for the Test, 80.03% for ODI, and 82.39% for the T20. (refer to Tables 4–6).
In the T20 format, Factor 1 (Batting), contributed 46.77% toward the total variance, whereas Factor 2 (Bowling), contributed 35.61%. This distribution indicates the high-scoring, batting-centric nature of the T20 format, where variations in batting statistics are more prominent. (refer Table 6).
For the ODI format, Factor 1 (Batting) explained 45.66% of the total variance, while Factor 2 (Bowling) explained 34.36% of the total variance. All these values reflect a high variability in batting performance, albeit slightly more balanced than in the case of the T20 format. (refer to Table 5).
Unlike the T20 and ODI formats, the Test format showed that the variance between the two factors was relatively evenly distributed. Factor 1 (Batting) contributed 40.61%, and Factor 2 (Bowling) contributed 39.79% of the variance. The two factors shared almost an identical contribution, pointing towards the fact that, for longer-format cricket, both batting and bowling performances have almost equal impact on player performance. (refer to Table 4).
Thus, the rotated component analysis establishes that batting performance contributes more to total variance in the short formats (ODIs and T20Is), whereas the Test format reflects a balanced contribution from both batting and bowling performances.
4 Discussions
The factor analysis pulled out two clear hidden constructs across all formats: a Batting factor and a Bowling factor. These two factors( batting and bowling) had an impact on about 80% of the total variance showing that cricket performance can be summed up well along these two lines. But the share of batting and bowling changed across formats showing differences in how each format rewards performance.
In Test cricket, batting (contributes 40.6%) and bowling (contributes 39.8%) explained almost the same amount of variance. This balance shows the classic nature of the five-day game where both deep batting and strong bowling are key to win. The result hints that neither skill rules, instead long batting partnerships and the ability to take 20 wickets are crucial. This finding fits with Shah et al.’s [13] view, who stressed how important bowling is in limited-overs cricket, but goes further by showing that in Tests, batting is just as vital. For strategy, this points out the need for selectors to put equal effort into building tough batting and strong bowling combined teams in different conditions.
In ODIs, batting accounts for a bigger chunk of variance (45.7%) than bowling (34.4%). This indicates that batting power becomes more crucial in the 50-over game in today’s high-scoring matches. The outcome backs up Mullick [19], who discovered that batting has grown to have a stronger effect on ODI results. It also lines up with what Bailey et al. [5] found – that scoring stages shape how ODI games unfold. For those picking teams and training players, this highlights how vital it is to have a solid middle order and players who can finish well. While bowling still matters at the start and end of innings, it seems to take a back seat to batting when it comes to deciding who wins.
Batting had the biggest impact in T20 internationals. It accounted 46.8% of the total variance, while bowling accounted for 35.6%. This shows what T20 cricket is all about - big hits and aggressive batting. Sahoo et al. [20] back this up. They found that how fast batsmen score and how many boundaries they hit are the keys to winning in T20. Vora [21] agrees saying the best T20 teams build around hard-hitting openers and finishers. But bowling still matters a lot. Bowlers who don’t give away runs at the end and take wickets can change games. This fits with what Ayub et al. [18] said – to understand cricket, we need to look at both batting and bowling in context.
Together, the findings indicate a trend: batting reigns supreme in ODIs and even more so in T20s but balance prevails in Tests between bat and ball. This is an extension of the previous factor analysis works of Sharma [12] and Shah et al. [13] which only involved IPL and ODI/T20 format matches, by demonstrating that the structure is preserved across all three international formats. In contrast to machine learning methods (Alaka et al. [16]; Raj & Kumar [24]), in this study of a practical relevance analysis based on prediction, we offer the user an interpretable latent structure that can guide strategy. From a more practical point of view, it means that Test selectors should focus on ensuring that their squads are balanced; ODI teams need to ensure they have batting depth; T20 line-ups will want to pack their ranks with dynamite batters but not forget the bowlers who can nail down the final overs.
5 Conclusions
This study presents a comprehensive factor analysis–based evaluation of batting and bowling performance across all three international cricket formats – Tests, ODIs, and T20 – using data from the 2022 T20 World Cup, the ICC ODI World Cup 2023, and the World Test Championship 2021–23. By using factor analysis, a robust multivariate statistical technique, this study extends the previous works by Sharma [12] and Shah et al. [13], evaluating performance across all three formats to provide a unified and comparable framework for evaluating player performance across all formats of international cricket.
The findings demonstrate a consistent two–factor structure, with batting performance driving the dominant share of variance in limited-overs cricket, whereas bowling assumes nearly equal importance in the Test format. These insights quantitatively affirm the strategic differences between formats and highlight the relative role that each discipline plays in overall player contribution. The reliability of this structure was supported through the Kaiser-Meyer-Olkin (KMO) measure, Bartlett’s Test of Sphericity, eigenvalue tests, and scree plot analysis. The rotated component matrix clearly distinguished Factor 1 as representing batting performance and Factor 2 as representing bowling performance.
The findings are given as follows:
Table 7 Percentage variance explained by batting and bowling factors across formats
| Formats | Batting | Bowling |
| T20I | 46.77% | 35.61% |
| ODI | 45.66% | 34.36% |
| Test | 40.61% | 39.80% |
As shown in Table 7, the Test format demonstrates a more balanced contribution between batting and bowling performances, highlighting the equal importance of both skills for success in the longer format. In contrast, in the shorter formats – T20Is and ODIs – batting performance tends to be more dominant, reflecting the aggressive, high-scoring nature of limited-overs cricket.
Limitations and Future Work
This study has focused on batting and bowling performance variables analyzed through factor analysis. While the present analysis establishes a unified comparative framework, the study is limited by the use of only eight conventional performance indicators and the exclusion of fielding metrics and situational impacts such as match importance, pitch and weather effects, or player roles (specialists vs. all-rounders). Additionally, the dataset is tournament-specific, and performance across longer time horizons may reveal different contribution dynamics.
Future studies may benefit from the integration of advanced performance metrics such as dot-ball percentage, boundary percentage, bowling impact measures, and fielding performance indices. The adoption of hybrid approaches combining factor analysis with data envelopment analysis, clustering, or machine learning techniques may also enhance the robustness of player evaluation. Further, extending the framework to women’s cricket and franchise-based leagues could yield broader insights for selectors, coaches, and analysts.
Overall, this work reinforces the utility of multivariate statistical techniques in transforming cricket performance data into actionable intelligence and provides a foundation for deeper analytical models to support evidence-driven selection and strategy in modern cricket.
Data Availability Statement
See Appendix.
Appendix
ODI Datasheet
| Player | HS | Ave | SR | 4s | 6s | Bowl Avg | Econ | Bowl SR |
| V Kohli (IND) | 117 | 95.62 | 90.31 | 68 | 9 | 15 | 4.28 | 21 |
| RG Sharma (IND) | 131 | 54.27 | 125.94 | 66 | 31 | 7 | 8.4 | 5 |
| Q de Kock (SA) | 174 | 59.4 | 107.02 | 57 | 21 | 0 | 0 | 0 |
| R Ravindra (NZ) | 123 | 64.22 | 106.44 | 55 | 17 | 78.6 | 5.98 | 78.8 |
| DJ Mitchell (NZ) | 134 | 69 | 111.06 | 48 | 22 | 0 | 0 | 0 |
| DA Warner (AUS) | 163 | 48.63 | 108.29 | 50 | 24 | 0 | 0 | 0 |
| SS Iyer (IND) | 128 | 66.25 | 113.24 | 37 | 24 | 0 | 0 | 0 |
| KL Rahul (IND) | 102 | 75.33 | 90.76 | 38 | 9 | 0 | 0 | 0 |
| HE van der Dussen (SA) | 133 | 49.77 | 84.52 | 39 | 8 | 0 | 0 | 0 |
| MR Marsh (AUS) | 177 | 49 | 107.56 | 43 | 21 | 48 | 7.38 | 39 |
| AK Markram (SA) | 106 | 45.11 | 110.92 | 44 | 9 | 85 | 4.59 | 111 |
| DJ Malan (ENG) | 140 | 44.88 | 101 | 50 | 9 | 0 | 0 | 0 |
| GJ Maxwell (AUS) | 201 | 66.66 | 150.37 | 40 | 22 | 55 | 4.81 | 68.5 |
| Mohammad Rizwan (PAK) | 131 | 65.83 | 95.41 | 38 | 5 | 0 | 0 | 0 |
| Ibrahim Zadran (AFG) | 129 | 47 | 76.26 | 39 | 5 | 0 | 0 | 0 |
| S Samarawickrama (SL) | 108 | 53.28 | 102.19 | 36 | 4 | 0 | 0 | 0 |
| H Klaasen (SA) | 109 | 41.44 | 133.21 | 28 | 19 | 0 | 0 | 0 |
| DP Conway (NZ) | 152 | 41.33 | 101.63 | 54 | 4 | 0 | 0 | 0 |
| M Labuschagne (AUS) | 71 | 40.22 | 70.7 | 31 | 2 | 0 | 0 | 0 |
| DA Miller (SA) | 101 | 44.5 | 107.87 | 25 | 20 | 0 | 0 | 0 |
| Shubman Gill (IND) | 92 | 44.25 | 106.94 | 41 | 12 | 0 | 0 | 0 |
| Azmatullah Omarzai (AFG) | 97 | 70.6 | 97.78 | 26 | 13 | 38.57 | 7.1 | 32.57 |
| Abdullah Shafique (PAK) | 113 | 42 | 93.33 | 36 | 9 | 0 | 0 | 0 |
| P Nissanka (SL) | 77 | 41.5 | 89.48 | 44 | 3 | 0 | 0 | 0 |
| TM Head (AUS) | 137 | 54.83 | 127.51 | 37 | 13 | 50.5 | 4.8 | 63 |
| Mahmudullah (BAN) | 111 | 54.66 | 91.62 | 28 | 14 | 0 | 0 | 0 |
| Babar Azam (PAK) | 74 | 40 | 82.9 | 32 | 4 | 0 | 0 | 0 |
| Rahmat Shah (AFG) | 77 | 40 | 76.37 | 28 | 2 | 0 | 0 | 0 |
| Hashmatullah Shahidi (AFG) | 80 | 51.66 | 73.11 | 25 | 2 | 0 | 0 | 0 |
| BA Stokes (ENG) | 108 | 50.66 | 89.14 | 26 | 11 | 0 | 0 | 0 |
| SPD Smith (AUS) | 71 | 33.55 | 80.96 | 30 | 2 | 0 | 0 | 0 |
| SA Engelbrecht (NED) | 70 | 37.5 | 66.66 | 25 | 3 | 0 | 0 | 0 |
| BKG Mendis (SL) | 122 | 32.66 | 113.95 | 27 | 15 | 0 | 0 | 0 |
| KIC Asalanka (SL) | 108 | 36 | 85.2 | 19 | 11 | 0 | 0 | 0 |
| GD Phillips (NZ) | 71 | 40.71 | 111.76 | 22 | 14 | 38.83 | 5.82 | 40 |
| Litton Das (BAN) | 76 | 31.55 | 80.22 | 32 | 5 | 0 | 0 | 0 |
| Rahmanullah Gurbaz (AFG) | 80 | 31.11 | 98.93 | 31 | 9 | 0 | 0 | 0 |
| JE Root (ENG) | 82 | 30.66 | 88.46 | 21 | 2 | 67 | 6.59 | 61 |
| SA Edwards (NED) | 78 | 37 | 86.91 | 22 | 3 | 0 | 0 | 0 |
| KS Williamson (NZ) | 95 | 85.33 | 93.43 | 28 | 4 | 0 | 0 | 0 |
| Saud Shakeel (PAK) | 68 | 34.42 | 97.96 | 30 | 1 | 0 | 0 | 0 |
| Najmul Hossain Shanto (BAN) | 90 | 27.75 | 76.81 | 25 | 1 | 0 | 0 | 0 |
| Fakhar Zaman (PAK) | 126 | 73.33 | 122.9 | 14 | 18 | 0 | 0 | 0 |
| CN Ackermann (NED) | 69 | 24 | 82.12 | 27 | 0 | 46.8 | 4.94 | 56.8 |
| JM Bairstow (ENG) | 59 | 23.88 | 88.47 | 27 | 3 | 0 | 0 | 0 |
| WA Young (NZ) | 70 | 34.33 | 83.73 | 23 | 6 | 0 | 0 | 0 |
| Mushfiqur Rahim (BAN) | 66 | 25.25 | 79.21 | 14 | 4 | 0 | 0 | 0 |
| Mehidy Hasan Miraz (BAN) | 57 | 22.33 | 79.44 | 21 | 2 | 40.2 | 5.58 | 43.2 |
| Shakib Al Hasan (BAN) | 82 | 26.57 | 82.3 | 21 | 4 | 36.55 | 5.26 | 41.66 |
| HC Brook (ENG) | 66 | 28.16 | 112.66 | 20 | 5 | 0 | 0 | 0 |
| Towhid Hridoy (BAN) | 74 | 32.8 | 78.09 | 7 | 5 | 0 | 0 | 0 |
| AT Nidamanuru (NED) | 54 | 27.33 | 98.2 | 11 | 10 | 0 | 0 | 0 |
| Imam-ul-Haq (PAK) | 70 | 27 | 90 | 23 | 0 | 0 | 0 | 0 |
| JP Inglis (AUS) | 58 | 19.87 | 94.64 | 17 | 3 | 0 | 0 | 0 |
| M Jansen (SA) | 75 | 31.4 | 110.56 | 9 | 9 | 26.47 | 6.52 | 24.35 |
| TWM Latham (NZ) | 68 | 25.83 | 91.17 | 12 | 3 | 0 | 0 | 0 |
| MDKJ Perera (SL) | 78 | 21.28 | 101.36 | 25 | 2 | 0 | 0 | 0 |
| T Bavuma (SA) | 35 | 18.12 | 73.6 | 18 | 3 | 0 | 0 | 0 |
| Tanzid Hasan (BAN) | 51 | 16.11 | 95.39 | 22 | 3 | 0 | 0 | 0 |
| Iftikhar Ahmed (PAK) | 40 | 23.66 | 115.44 | 11 | 8 | 65.5 | 5.45 | 72 |
| DM de Silva (SL) | 34 | 20 | 76.08 | 13 | 4 | 0 | 0 | 0 |
| LV van Beek (NED) | 59 | 23.33 | 78.21 | 9 | 3 | 39.66 | 6.72 | 35.41 |
| BFW de Leede (NED) | 67 | 15.44 | 69.84 | 15 | 2 | 30.43 | 7.26 | 25.12 |
| JC Buttler (ENG) | 43 | 15.33 | 97.18 | 11 | 5 | 0 | 0 | 0 |
| MP O’Dowd (NED) | 42 | 15.33 | 69 | 22 | 2 | 0 | 0 | 0 |
| CR Woakes (ENG) | 51 | 18.71 | 84.51 | 15 | 2 | 29.8 | 5.41 | 33 |
| PJ Cummins (AUS) | 37 | 32 | 68.81 | 13 | 5 | 34.33 | 5.75 | 35.8 |
| Shadab Khan (PAK) | 43 | 24.2 | 100.83 | 7 | 4 | 118.5 | 6.23 | 114 |
| RA Jadeja (IND) | 39 | 40 | 101.69 | 7 | 3 | 24.87 | 4.25 | 35.06 |
| SA Yadav (IND) | 49 | 17.66 | 100.95 | 12 | 1 | 0 | 0 | 0 |
| Rashid Khan (AFG) | 35 | 21 | 94.59 | 7 | 5 | 35.27 | 4.48 | 47.18 |
| MJ Santner (NZ) | 36 | 25.75 | 127.16 | 6 | 5 | 28.06 | 4.84 | 34.75 |
| M Theekshana (SL) | 38 | 25 | 54.05 | 11 | 1 | 63.66 | 5.35 | 71.33 |
| Vikramjit Singh (NED) | 52 | 16.33 | 65.33 | 12 | 1 | 0 | 0 | 0 |
| RR Hendricks (SA) | 85 | 48.5 | 103.19 | 10 | 3 | 0 | 0 | 0 |
| MM Ali (ENG) | 42 | 15.83 | 74.8 | 8 | 1 | 49.6 | 5.81 | 51.2 |
| AU Rashid (ENG) | 20 | 15.33 | 101.09 | 7 | 2 | 27.53 | 5.18 | 31.86 |
| Ikram Alikhil (AFG) | 58 | 44.5 | 88.11 | 7 | 3 | 0 | 0 | 0 |
| MP Stoinis (AUS) | 35 | 21.75 | 112.98 | 8 | 4 | 35.75 | 7.52 | 28.5 |
| MA Starc (AUS) | 28 | 12.42 | 57.61 | 7 | 1 | 33 | 6.06 | 32.62 |
| MA Wood (ENG) | 43 | 28.33 | 130.76 | 7 | 5 | 58.16 | 6.46 | 54 |
| MS Chapman (NZ) | 39 | 16.8 | 118.3 | 10 | 1 | 0 | 0 | 0 |
| W Barresi (NED) | 41 | 20.75 | 74.1 | 11 | 1 | 0 | 0 | 0 |
| Mohammad Nawaz (PAK) | 39 | 20.25 | 83.5 | 5 | 3 | 111.5 | 5.89 | 113.5 |
| MD Shanaka (SL) | 68 | 40 | 100 | 6 | 3 | 0 | 0 | 0 |
| DJ Willey (ENG) | 16 | 19.5 | 116.41 | 7 | 6 | 23.54 | 5.07 | 27.81 |
| A Dutt (NED) | 23 | 11.66 | 80.45 | 1 | 5 | 42.6 | 5.49 | 46.5 |
| RE van der Merwe (NED) | 29 | 8.5 | 80 | 4 | 3 | 51.83 | 5.55 | 56 |
| C Green (AUS) | 47 | 21 | 75.9 | 6 | 0 | 0 | 0 | 0 |
| LS Livingstone (ENG) | 27 | 10 | 63.82 | 6 | 0 | 52.66 | 5.44 | 58 |
| KA Maharaj (SA) | 40 | 19.66 | 73.75 | 7 | 1 | 24.66 | 4.15 | 35.6 |
| JDS Neesham (NZ) | 58 | 29 | 123.4 | 3 | 3 | 78.5 | 10.82 | 43.5 |
| Mohammad Nabi (AFG) | 19 | 9.16 | 72.36 | 3 | 1 | 31.75 | 4.13 | 46.12 |
| Shaheen Shah Afridi (PAK) | 25 | 18.33 | 91.66 | 7 | 1 | 26.72 | 5.93 | 27 |
| G Coetzee (SA) | 22 | 13.5 | 69.23 | 4 | 1 | 19.8 | 6.23 | 19.05 |
| Haris Rauf (PAK) | 35 | 17.66 | 117.77 | 5 | 4 | 33.31 | 6.74 | 29.62 |
| CAK Rajitha (SL) | 33 | 13 | 91.22 | 6 | 1 | 42 | 6.85 | 36.75 |
| Agha Salman (PAK) | 51 | 51 | 113.33 | 6 | 1 | 0 | 0 | 0 |
| AD Mathews (SL) | 23 | 12.75 | 65.38 | 4 | 1 | 17.83 | 4.82 | 22.16 |
| Mujeeb Ur Rahman (AFG) | 28 | 12.75 | 127.5 | 6 | 2 | 57.25 | 5.59 | 61.37 |
| Taskin Ahmed (BAN) | 17 | 12.25 | 52.68 | 1 | 3 | 61 | 5.54 | 66 |
| A Zampa (AUS) | 29 | 16 | 80 | 5 | 0 | 22.39 | 5.36 | 25.04 |
| Ishan Kishan (IND) | 47 | 23.5 | 97.91 | 5 | 2 | 0 | 0 | 0 |
| Mustafizur Rahman (BAN) | 20 | 10.5 | 47.19 | 4 | 1 | 79.6 | 6.06 | 78.8 |
| Nasum Ahmed (BAN) | 19 | 13.33 | 83.33 | 5 | 0 | 0 | 0 | 0 |
| AL Phehlukwayo (SA) | 39 | 39 | 105.4 | 1 | 3 | 36 | 5.14 | 42 |
| AAP Atkinson (ENG) | 35 | 18.5 | 160.86 | 7 | 0 | 36.5 | 6.08 | 36 |
| SM Curran (ENG) | 14 | 11.66 | 61.4 | 1 | 0 | 70 | 8.07 | 52 |
| Mahedi Hasan (BAN) | 17 | 16.5 | 45.2 | 2 | 0 | 24.83 | 6.2 | 24 |
| D Madushanka (SL) | 19 | 14 | 41.79 | 4 | 0 | 25 | 6.7 | 22.38 |
| Shoriful Islam (BAN) | 12 | 28 | 100 | 3 | 1 | 40.9 | 6.32 | 38.8 |
| Noor Ahmad (AFG) | 26 | 26 | 81.25 | 4 | 0 | 36.4 | 4.78 | 45.6 |
| PA van Meekeren (NED) | 7 | 4.33 | 48.14 | 3 | 0 | 37.25 | 6.01 | 37.16 |
| K Rabada (SA) | 10 | 8.33 | 55.55 | 0 | 2 | 28 | 4.99 | 33.61 |
| Mohammad Wasim (PAK) | 16 | 23 | 100 | 2 | 2 | 21.5 | 5.63 | 22.9 |
| TA Boult (NZ) | 10 | 21 | 84 | 1 | 1 | 36 | 5.53 | 39 |
| Hasan Ali (PAK) | 12 | 6.66 | 71.42 | 4 | 0 | 35.66 | 6.29 | 34 |
| Kuldeep Yadav (IND) | 10 | 19 | 61.29 | 1 | 0 | 28.26 | 4.45 | 38.06 |
| MJ Henry (NZ) | 10 | 9.5 | 86.36 | 1 | 1 | 28.63 | 5.79 | 29.63 |
| JJ Bumrah (IND) | 16 | 9 | 62.06 | 1 | 0 | 18.65 | 4.06 | 27.55 |
| TG Southee (NZ) | 9 | 8 | 76.19 | 2 | 0 | 36.57 | 7.75 | 28.28 |
| RJW Topley (ENG) | 15 | 16 | 177.77 | 3 | 0 | 22.87 | 6.61 | 20.75 |
| Naveen-ul-Haq (AFG) | 9 | 4 | 64 | 2 | 0 | 44 | 6.55 | 40.25 |
| Hasan Mahmud (BAN) | 15 | 15 | 60 | 2 | 0 | 44 | 9.42 | 28 |
| FDM Karunaratne (SL) | 15 | 7.5 | 68.18 | 1 | 0 | 0 | 0 | 0 |
| Saqib Zulfiqar (NED) | 10 | 6.5 | 39.39 | 1 | 0 | 40 | 8 | 30 |
| DN Wellalage (SL) | 10 | 4 | 66.66 | 1 | 0 | 98 | 6.68 | 88 |
| HH Pandya (IND) | 11 | 11 | 137.5 | 0 | 1 | 22.6 | 6.84 | 19.8 |
| L Ngidi (SA) | 7 | 5.5 | 26.82 | 0 | 0 | 35.5 | 5.86 | 36.3 |
| Mohammed Shami (IND) | 6 | 3.33 | 50 | 1 | 0 | 10.7 | 5.26 | 12.2 |
| Mohammed Siraj (IND) | 9 | 9 | 112.5 | 1 | 0 | 33.5 | 5.68 | 35.35 |
| T Shamsi (SA) | 4 | 9 | 60 | 1 | 0 | 23.55 | 5.6 | 25.22 |
| R Klein (NED) | 8 | 8 | 53.33 | 0 | 0 | 0 | 0 | 0 |
| C Karunaratne (SL) | 6 | 4 | 28.57 | 1 | 0 | 0 | 0 | 0 |
| Najibullah Zadran (AFG) | 5 | 3.5 | 33.33 | 0 | 0 | 0 | 0 | 0 |
| LH Ferguson (NZ) | 6 | 3.5 | 77.77 | 0 | 1 | 30.1 | 5.57 | 32.4 |
| Shariz Ahmad (NED) | 6 | 6 | 75 | 0 | 0 | 0 | 0 | 0 |
| M Pathirana (SL) | 5 | 6 | 31.57 | 1 | 0 | 92.5 | 9.73 | 57 |
| PVD Chameera (SL) | 4 | 1.5 | 15.38 | 0 | 0 | 98 | 6.25 | 94 |
| Tanzim Hasan Sakib (BAN) | 5 | 5 | 83.33 | 1 | 0 | 26.66 | 8 | 20 |
| CBRLS Kumara (SL) | 4 | 4 | 50 | 1 | 0 | 27.33 | 7.45 | 22 |
| MADI Hemantha (SL) | 4 | 4 | 100 | 1 | 0 | 0 | 0 | 0 |
| JR Hazlewood (AUS) | 2 | 2 | 80 | 0 | 0 | 28.06 | 4.81 | 34.93 |
| Fazalhaq Farooqi (AFG) | 2 | 2 | 22.22 | 0 | 0 | 38 | 5.7 | 40 |
| Usama Mir (PAK) | 0 | 0 | 0 | 0 | 0 | 62 | 7.08 | 52.5 |
| LB Williams (SA) | 0 | 0 | 0 | 0 | 0 | 28 | 6.46 | 26 |
| SA Abbott (AUS) | 0 | 0 | 0 | 0 | 0 | 30.5 | 6.1 | 30 |
| SN Thakur (IND) | 0 | 0 | 0 | 0 | 0 | 51 | 6 | 51 |
| R Ashwin (IND) | 0 | 0 | 0 | 0 | 0 | 34 | 3.4 | 60 |
Test Datasheet
| Player | HS | Ave | SR | 4s | 6s | Bowl Avg | Econ | Bowl SR |
| JE Root (ENG) | 180 | 53.19 | 60.81 | 217 | 3 | 48 | 3.52 | 81.64 |
| UT Khawaja (AUS) | 195 | 64.84 | 50.04 | 174 | 7 | 0 | 0 | 0 |
| M Labuschagne (AUS) | 204 | 52.53 | 52.23 | 182 | 6 | 0 | 0 | 0 |
| Babar Azam (PAK) | 196 | 61.08 | 53.15 | 171 | 12 | 0 | 0 | 0 |
| SPD Smith (AUS) | 200 | 52.11 | 47.74 | 148 | 7 | 0 | 0 | 0 |
| TM Head (AUS) | 175 | 55.56 | 81.8 | 169 | 18 | 23.71 | 3.2 | 44.42 |
| JM Bairstow (ENG) | 162 | 51.4 | 68.9 | 157 | 19 | 0 | 0 | 0 |
| FDM Karunaratne (SL) | 147 | 47.9 | 51.92 | 117 | 0 | 0 | 0 | 0 |
| Litton Das (BAN) | 141 | 46.54 | 56.82 | 123 | 4 | 0 | 0 | 0 |
| KC Brathwaite (WI) | 160 | 43.21 | 39.05 | 112 | 2 | 50.5 | 4.28 | 70.66 |
| Abdullah Shafique (PAK) | 160 | 47.23 | 41.47 | 96 | 14 | 0 | 0 | 0 |
| BA Stokes (ENG) | 120 | 32.36 | 63.17 | 106 | 28 | 35.33 | 3.23 | 65.6 |
| DJ Mitchell (NZ) | 190 | 60 | 53.54 | 96 | 20 | 0 | 0 | 0 |
| TWM Latham (NZ) | 252 | 43.63 | 51.14 | 118 | 3 | 0 | 0 | 0 |
| LD Chandimal (SL) | 206 | 68.42 | 54.27 | 84 | 15 | 0 | 0 | 0 |
| Imam-ul-Haq (PAK) | 157 | 54.82 | 47.52 | 101 | 8 | 0 | 0 | 0 |
| V Kohli (IND) | 186 | 32.13 | 45.53 | 110 | 2 | 0 | 0 | 0 |
| CA Pujara (IND) | 102 | 32 | 42.58 | 123 | 2 | 0 | 0 | 0 |
| T Bavuma (SA) | 172 | 45 | 49.72 | 103 | 3 | 0 | 0 | 0 |
| Z Crawley (ENG) | 122 | 27.93 | 61.86 | 138 | 0 | 0 | 0 | 0 |
| DA Warner (AUS) | 200 | 30.72 | 59.67 | 111 | 8 | 0 | 0 | 0 |
| DP Conway (NZ) | 122 | 49.11 | 53.83 | 118 | 3 | 0 | 0 | 0 |
| AD Mathews (SL) | 199 | 46.42 | 46.42 | 79 | 13 | 0 | 0 | 0 |
| RR Pant (IND) | 146 | 43.4 | 80.81 | 96 | 22 | 0 | 0 | 0 |
| OJ Pope (ENG) | 145 | 33.76 | 66.04 | 94 | 3 | 0 | 0 | 0 |
| TA Blundell (NZ) | 106 | 43.1 | 48.8 | 103 | 2 | 0 | 0 | 0 |
| AT Carey (AUS) | 111 | 34.91 | 60.6 | 86 | 3 | 0 | 0 | 0 |
| D Elgar (SA) | 96 | 28.53 | 49.62 | 103 | 1 | 0 | 0 | 0 |
| RG Sharma (IND) | 127 | 42.11 | 50.56 | 88 | 11 | 0 | 0 | 0 |
| DM de Silva (SL) | 155 | 39.63 | 57.74 | 83 | 7 | 43.8 | 3.58 | 73.4 |
| KS Williamson (NZ) | 215 | 75.2 | 49.96 | 86 | 4 | 0 | 0 | 0 |
| C Green (AUS) | 114 | 36.8 | 49.83 | 79 | 2 | 29.12 | 3.12 | 56 |
| J Blackwood (WI) | 102 | 31.39 | 47.43 | 95 | 2 | 0 | 0 | 0 |
| RA Jadeja (IND) | 175 | 36.05 | 49.65 | 84 | 7 | 23.68 | 2.44 | 58.19 |
| SS Iyer (IND) | 105 | 44.4 | 65.81 | 80 | 14 | 0 | 0 | 0 |
| KL Rahul (IND) | 129 | 30.28 | 40.69 | 81 | 4 | 0 | 0 | 0 |
| Mushfiqur Rahim (BAN) | 175 | 41.66 | 42.25 | 67 | 0 | 0 | 0 | 0 |
| HM Nicholls (NZ) | 200 | 32.31 | 54.82 | 69 | 4 | 0 | 0 | 0 |
| Saud Shakeel (PAK) | 125 | 72.5 | 41.66 | 72 | 1 | 0 | 0 | 0 |
| Azhar Ali (PAK) | 185 | 33.11 | 41.7 | 59 | 5 | 0 | 0 | 0 |
| Mohammad Rizwan (PAK) | 104 | 32.52 | 51.2 | 62 | 5 | 0 | 0 | 0 |
| KD Petersen (SA) | 82 | 32.47 | 50.13 | 69 | 0 | 0 | 0 | 0 |
| K Verreynne (SA) | 136 | 31.35 | 55.06 | 59 | 3 | 0 | 0 | 0 |
| BKG Mendis (SL) | 87 | 33.18 | 56.73 | 68 | 1 | 0 | 0 | 0 |
| Shubman Gill (IND) | 128 | 33.8 | 60.57 | 54 | 8 | 0 | 0 | 0 |
| J Da Silva (WI) | 100 | 26.88 | 36.22 | 54 | 1 | 0 | 0 | 0 |
| HC Brook (ENG) | 153 | 80 | 92.13 | 55 | 12 | 0 | 0 | 0 |
| SJ Erwee (SA) | 108 | 26.61 | 43.27 | 56 | 0 | 0 | 0 | 0 |
| AK Markram (SA) | 115 | 27.11 | 55.2 | 77 | 0 | 0 | 0 | 0 |
| Najmul Hossain Shanto (BAN) | 67 | 20 | 44.48 | 58 | 5 | 0 | 0 | 0 |
| AR Patel (IND) | 84 | 45.8 | 55.38 | 43 | 16 | 24.86 | 2.3 | 64.86 |
| AZ Lees (ENG) | 67 | 23.84 | 43.06 | 58 | 1 | 0 | 0 | 0 |
| Agha Salman (PAK) | 103 | 34.38 | 56.65 | 58 | 2 | 57.5 | 3.92 | 88 |
| R Ashwin (IND) | 61 | 23.36 | 58.42 | 50 | 4 | 19.67 | 2.48 | 47.59 |
| JO Holder (WI) | 81 | 23.31 | 46.82 | 54 | 12 | 40.19 | 2.61 | 92.19 |
| MA Agarwal (IND) | 150 | 33.53 | 51.23 | 66 | 5 | 0 | 0 | 0 |
| Shakib Al Hasan (BAN) | 84 | 33.38 | 60.61 | 45 | 8 | 32.81 | 2.49 | 79 |
| WA Young (NZ) | 89 | 27.12 | 44.06 | 61 | 0 | 0 | 0 | 0 |
| AM Rahane (IND) | 89 | 24.64 | 49.41 | 58 | 3 | 0 | 0 | 0 |
| NE Bonner (WI) | 123 | 29.85 | 31.33 | 46 | 1 | 0 | 0 | 0 |
| BOP Fernando (SL) | 64 | 25.87 | 53.35 | 47 | 8 | 0 | 0 | 0 |
| BT Foakes (ENG) | 113 | 33.33 | 49.07 | 42 | 0 | 0 | 0 | 0 |
| KA Maharaj (SA) | 84 | 18.57 | 66.78 | 54 | 4 | 30.62 | 3.06 | 60.03 |
| Mahmudul Hasan Joy (BAN) | 137 | 25.92 | 37.97 | 43 | 2 | 0 | 0 | 0 |
| KR Mayers (WI) | 146 | 22.56 | 57.57 | 47 | 5 | 17.79 | 2.55 | 41.75 |
| BM Duckett (ENG) | 107 | 71.4 | 95.71 | 43 | 2 | 0 | 0 | 0 |
| CR Woakes (ENG) | 50 | 29.5 | 55.83 | 47 | 2 | 39.66 | 3.11 | 76.5 |
| DJ Malan (ENG) | 82 | 26.92 | 40.69 | 49 | 0 | 0 | 0 | 0 |
| Abid Ali (PAK) | 133 | 48 | 53.93 | 43 | 3 | 0 | 0 | 0 |
| Sarfaraz Ahmed (PAK) | 118 | 83.75 | 65.17 | 35 | 1 | 0 | 0 | 0 |
| N Dickwella (SL) | 61 | 22.42 | 67.23 | 37 | 1 | 0 | 0 | 0 |
| P Nissanka (SL) | 73 | 38.5 | 44.44 | 32 | 1 | 0 | 0 | 0 |
| M Jansen (SA) | 59 | 20.4 | 42.55 | 42 | 1 | 22.38 | 3.32 | 40.34 |
| MA Starc (AUS) | 41 | 20.13 | 49.91 | 30 | 2 | 27.98 | 3.18 | 52.69 |
| Fawad Alam (PAK) | 124 | 32.88 | 47.28 | 34 | 0 | 0 | 0 | 0 |
| HE van der Dussen (SA) | 45 | 21.07 | 36.5 | 27 | 0 | 0 | 0 | 0 |
| Tamim Iqbal (BAN) | 133 | 32.66 | 63.77 | 42 | 0 | 0 | 0 | 0 |
| Nurul Hasan (BAN) | 64 | 27.9 | 64.28 | 39 | 3 | 0 | 0 | 0 |
| Mominul Haque (BAN) | 88 | 14.94 | 40.45 | 37 | 1 | 27.66 | 3.74 | 44.33 |
| RJ Burns (ENG) | 61 | 20 | 39.33 | 33 | 1 | 0 | 0 | 0 |
| JD Campbell (WI) | 58 | 35.42 | 54.98 | 31 | 2 | 0 | 0 | 0 |
| Mehidy Hasan Miraz (BAN) | 47 | 13.77 | 33.06 | 34 | 3 | 36.18 | 2.94 | 73.81 |
| NM Lyon (AUS) | 38 | 15.31 | 60.34 | 33 | 5 | 26.12 | 2.58 | 60.63 |
| Mohammed Shami (IND) | 56 | 14.68 | 68.71 | 29 | 5 | 28.28 | 3.32 | 51 |
| SN Thakur (IND) | 60 | 17.84 | 66.09 | 29 | 7 | 27.27 | 3.51 | 46.59 |
| RL Chase (WI) | 55 | 14.43 | 42.85 | 24 | 4 | 70.81 | 3.69 | 115 |
| PJ Cummins (AUS) | 34 | 13.52 | 57.93 | 21 | 9 | 22.15 | 2.79 | 47.54 |
| C de Grandhomme (NZ) | 120 | 75 | 78.94 | 23 | 4 | 0 | 0 | 0 |
| DW Lawrence (ENG) | 91 | 27.75 | 65.87 | 25 | 4 | 0 | 0 | 0 |
| MJ Henry (NZ) | 72 | 36.66 | 73.82 | 30 | 5 | 27.65 | 2.87 | 57.72 |
| H Hameed (ENG) | 68 | 16.92 | 30.09 | 27 | 0 | 0 | 0 | 0 |
| RTM Mendis (SL) | 45 | 19.81 | 48.44 | 22 | 1 | 26.86 | 2.87 | 56.07 |
| GH Vihari (IND) | 58 | 35.83 | 41.18 | 24 | 0 | 0 | 0 | 0 |
| MG Bracewell (NZ) | 74 | 23.66 | 57.56 | 30 | 2 | 41.84 | 3.82 | 65.57 |
| Yasir Ali (BAN) | 55 | 20.5 | 46.17 | 26 | 0 | 0 | 0 | 0 |
| K Rabada (SA) | 47 | 11.33 | 56.66 | 16 | 7 | 21.05 | 3.63 | 34.8 |
| T Chanderpaul (WI) | 51 | 24.37 | 42.57 | 22 | 2 | 0 | 0 | 0 |
| Zakir Hasan (BAN) | 100 | 46.5 | 42.46 | 22 | 1 | 0 | 0 | 0 |
| SCJ Broad (ENG) | 42 | 14.15 | 72.72 | 22 | 5 | 28.32 | 3.22 | 52.76 |
| PWA Mulder (SA) | 42 | 15.25 | 38.93 | 23 | 1 | 44 | 2.89 | 91.2 |
| MS Harris (AUS) | 76 | 29.83 | 37.29 | 18 | 0 | 0 | 0 | 0 |
| JC Buttler (ENG) | 39 | 14.91 | 30.86 | 23 | 0 | 0 | 0 | 0 |
| Faheem Ashraf (PAK) | 44 | 16.18 | 42.18 | 24 | 1 | 37.12 | 2.85 | 78 |
| OE Robinson (ENG) | 37 | 9.31 | 52.83 | 20 | 1 | 20.75 | 2.69 | 46.18 |
| MA Wood (ENG) | 39 | 14.08 | 70.71 | 21 | 3 | 25.9 | 3.34 | 46.48 |
| JJ Bumrah (IND) | 34 | 16.9 | 65.25 | 19 | 6 | 19.73 | 2.7 | 43.84 |
| KAJ Roach (WI) | 30 | 12.07 | 35.95 | 23 | 2 | 27.48 | 3.06 | 53.86 |
| RD Rickelton (SA) | 42 | 23.57 | 48.1 | 20 | 1 | 0 | 0 | 0 |
| SR Harmer (SA) | 47 | 23.28 | 36.22 | 14 | 1 | 25.63 | 3.05 | 50.36 |
| TG Southee (NZ) | 33 | 8.57 | 61.5 | 24 | 2 | 32.12 | 2.92 | 65.78 |
| Hasan Ali (PAK) | 28 | 11.14 | 70.58 | 10 | 10 | 35.52 | 3 | 71 |
| AS Joseph (WI) | 43 | 10.4 | 42.97 | 15 | 7 | 28.09 | 3.63 | 46.36 |
| MJ Leach (ENG) | 41 | 12.75 | 38.63 | 19 | 1 | 39.77 | 2.99 | 79.62 |
| PSP Handscomb (AUS) | 72 | 29 | 40.27 | 18 | 0 | 0 | 0 | 0 |
| SSJ Brooks (WI) | 39 | 14.55 | 43.23 | 19 | 0 | 0 | 0 | 0 |
| KS Bharat (IND) | 44 | 18.42 | 57.07 | 10 | 5 | 0 | 0 | 0 |
| Shan Masood (PAK) | 35 | 20.33 | 63.21 | 17 | 1 | 0 | 0 | 0 |
| K Zondo (SA) | 39 | 20 | 37.97 | 12 | 3 | 0 | 0 | 0 |
| RA Reifer (WI) | 62 | 17.14 | 44.6 | 16 | 0 | 0 | 0 | 0 |
| LRPL Taylor (NZ) | 40 | 17 | 44.23 | 13 | 0 | 0 | 0 | 0 |
| KA Jamieson (NZ) | 23 | 8.92 | 41.13 | 12 | 0 | 28.8 | 3.12 | 55.3 |
| T de Zorzi (SA) | 85 | 28.5 | 48.71 | 15 | 0 | 0 | 0 | 0 |
| N Wagner (NZ) | 49 | 15.85 | 63.42 | 13 | 6 | 37.55 | 3.39 | 66.44 |
| WP Saha (IND) | 61 | 34 | 48.11 | 9 | 2 | 0 | 0 | 0 |
| UT Yadav (IND) | 25 | 11.22 | 61.58 | 7 | 7 | 33.72 | 3.27 | 61.72 |
| J Overton (ENG) | 97 | 97 | 71.32 | 13 | 2 | 0 | 0 | 0 |
| Mohammad Nawaz (PAK) | 45 | 18.8 | 49.73 | 11 | 0 | 31.72 | 3.63 | 52.36 |
| H Klaasen (SA) | 35 | 15.5 | 47.44 | 10 | 0 | 0 | 0 | 0 |
| WG Jacks (ENG) | 31 | 22.25 | 98.88 | 6 | 5 | 38.66 | 4.25 | 54.5 |
| KIC Asalanka (SL) | 29 | 14.66 | 51.46 | 11 | 3 | 0 | 0 | 0 |
| MM Ali (ENG) | 35 | 16.6 | 40.09 | 14 | 0 | 49.83 | 3.47 | 86 |
| Shadman Islam (BAN) | 22 | 8.2 | 34.3 | 8 | 0 | 0 | 0 | 0 |
| IS Sodhi (NZ) | 65 | 38 | 35.68 | 13 | 0 | 25.15 | 3.17 | 47.46 |
| Noman Ali (PAK) | 20 | 9.5 | 29 | 12 | 0 | 50.42 | 3.07 | 98.33 |
| Yasir Shah (PAK) | 27 | 15 | 37.5 | 7 | 1 | 45.55 | 3.76 | 72.66 |
| CAK Rajitha (SL) | 22 | 10.71 | 30.73 | 9 | 0 | 31.57 | 3.08 | 61.42 |
| SM Curran (ENG) | 32 | 18.5 | 64.91 | 10 | 1 | 0 | 0 | 0 |
| R Ravindra (NZ) | 18 | 14.6 | 29.67 | 12 | 0 | 0 | 0 | 0 |
| TA Boult (NZ) | 17 | 18 | 92.3 | 14 | 0 | 25.48 | 3.33 | 45.84 |
| A Nortje (SA) | 28 | 10.28 | 52.55 | 12 | 0 | 23.86 | 3.76 | 38.04 |
| L Embuldeniya (SL) | 39 | 6.36 | 26.02 | 3 | 3 | 35.81 | 2.92 | 73.36 |
| Naseem Shah (PAK) | 18 | 11.33 | 37.98 | 8 | 4 | 30.4 | 3.6 | 50.63 |
| SW Billings (ENG) | 36 | 22 | 57.89 | 10 | 0 | 0 | 0 | 0 |
| Taijul Islam (BAN) | 20 | 5.5 | 28.57 | 8 | 0 | 34.4 | 2.75 | 75.06 |
| Taskin Ahmed (BAN) | 31 | 12.6 | 52.06 | 7 | 1 | 64.16 | 3.13 | 122.83 |
| PHKD Mendis (SL) | 61 | 61 | 44.52 | 7 | 0 | 0 | 0 | 0 |
| M Theekshana (SL) | 38 | 19.66 | 39.59 | 6 | 1 | 37.6 | 3.09 | 73 |
| KNM Fernando (SL) | 39 | 29 | 46.77 | 7 | 1 | 0 | 0 | 0 |
| C Overton (ENG) | 32 | 9.66 | 52.25 | 8 | 0 | 29.75 | 2.8 | 63.75 |
| DP Sibley (ENG) | 28 | 14.25 | 22.7 | 5 | 0 | 0 | 0 | 0 |
| JM Anderson (ENG) | 0 | 0 | 0 | 0 | 0 | 20.37 | 2.27 | 53.72 |
| Shaheen Shah Afridi (PAK) | 0 | 0 | 0 | 0 | 0 | 18.19 | 2.87 | 38 |
| Mohammed Siraj (IND) | 0 | 0 | 0 | 0 | 0 | 33.52 | 3.59 | 55.97 |
| SM Boland (AUS) | 0 | 0 | 0 | 0 | 0 | 14.57 | 2.31 | 37.84 |
| NGRP Jayasuriya (SL) | 0 | 0 | 0 | 0 | 0 | 24.69 | 3.06 | 48.42 |
| JNT Seales (WI) | 0 | 0 | 0 | 0 | 0 | 23.25 | 3.47 | 40.12 |
| Abrar Ahmed (PAK) | 0 | 0 | 0 | 0 | 0 | 33.64 | 3.94 | 51.1 |
| Ebadot Hossain (BAN) | 0 | 0 | 0 | 0 | 0 | 45.33 | 3.46 | 78.45 |
| AM Fernando (SL) | 0 | 0 | 0 | 0 | 0 | 25.78 | 3.31 | 46.65 |
| AY Patel (NZ) | 0 | 0 | 0 | 0 | 0 | 32.63 | 3.48 | 56.18 |
| Khaled Ahmed (BAN) | 0 | 0 | 0 | 0 | 0 | 40.14 | 3.39 | 70.85 |
| MJ Potts (ENG) | 0 | 0 | 0 | 0 | 0 | 28 | 3.06 | 54.85 |
| Sajid Khan (PAK) | 0 | 0 | 0 | 0 | 0 | 35.85 | 2.93 | 73.2 |
| L Ngidi (SA) | 0 | 0 | 0 | 0 | 0 | 23.47 | 3.07 | 45.73 |
| T Murphy (AUS) | 0 | 0 | 0 | 0 | 0 | 25.21 | 2.56 | 58.92 |
| P Jayawickrama (SL) | 0 | 0 | 0 | 0 | 0 | 33.14 | 2.97 | 66.85 |
| V Permaul (WI) | 0 | 0 | 0 | 0 | 0 | 30.38 | 3.18 | 57.15 |
| Zahid Mahmood (PAK) | 0 | 0 | 0 | 0 | 0 | 36.16 | 6.94 | 31.25 |
| D Olivier (SA) | 0 | 0 | 0 | 0 | 0 | 33.63 | 3.42 | 58.9 |
| JR Hazlewood (AUS) | 0 | 0 | 0 | 0 | 0 | 29.7 | 2.3 | 77.4 |
| MJ Swepson (AUS) | 0 | 0 | 0 | 0 | 0 | 45.8 | 3.08 | 89.2 |
| G Coetzee (SA) | 0 | 0 | 0 | 0 | 0 | 15.88 | 3.57 | 26.66 |
| MP Kuhnemann (AUS) | 0 | 0 | 0 | 0 | 0 | 31.11 | 3.56 | 52.33 |
| JA Warrican (WI) | 0 | 0 | 0 | 0 | 0 | 31.88 | 2.97 | 64.33 |
| Kuldeep Yadav (IND) | 0 | 0 | 0 | 0 | 0 | 14.12 | 3.13 | 27 |
| BM Tickner (NZ) | 0 | 0 | 0 | 0 | 0 | 38.5 | 3.81 | 60.62 |
| MG Neser (AUS) | 0 | 0 | 0 | 0 | 0 | 16.71 | 2.49 | 40.14 |
| Rehan Ahmed (ENG) | 0 | 0 | 0 | 0 | 0 | 19.57 | 3.71 | 31.57 |
| Shoriful Islam (BAN) | 0 | 0 | 0 | 0 | 0 | 44.14 | 2.94 | 90 |
| S Mahmood (ENG) | 0 | 0 | 0 | 0 | 0 | 22.83 | 2.24 | 61 |
| Mohammad Abbas (PAK) | 0 | 0 | 0 | 0 | 0 | 26 | 2.36 | 66 |
| Nayeem Hasan (BAN) | 0 | 0 | 0 | 0 | 0 | 30.66 | 3.47 | 53 |
| J Yadav (IND) | 0 | 0 | 0 | 0 | 0 | 19.6 | 2.96 | 39.6 |
| JA Richardson (AUS) | 0 | 0 | 0 | 0 | 0 | 24 | 3.14 | 45.8 |
| I Sharma (IND) | 0 | 0 | 0 | 0 | 0 | 45.8 | 2.93 | 93.6 |
| CBRLS Kumara (SL) | 0 | 0 | 0 | 0 | 0 | 70.6 | 4.65 | 91 |
| ST Gabriel (WI) | 0 | 0 | 0 | 0 | 0 | 41.75 | 4.39 | 57 |
| RAS Lakmal (SL) | 0 | 0 | 0 | 0 | 0 | 42 | 2.89 | 87 |
| Mohammad Ali (PAK) | 0 | 0 | 0 | 0 | 0 | 65.25 | 5.32 | 73.5 |
| JD Unadkat (IND) | 0 | 0 | 0 | 0 | 0 | 22.33 | 2.68 | 50 |
| LB Williams (SA) | 0 | 0 | 0 | 0 | 0 | 35 | 3.4 | 61.66 |
| G Motie (WI) | 0 | 0 | 0 | 0 | 0 | 52.66 | 3.51 | 90 |
T20 Datasheet
| Player | HS | Ave | SR | 4s | 6s | Bowl Avg | Econ | Bowl SR |
| V Kohli (IND) | 82 | 98.66 | 136.4 | 25 | 8 | 0 | 0 | 0 |
| MP O’Dowd (NED) | 71 | 34.57 | 112.55 | 22 | 8 | 0 | 0 | 0 |
| SA Yadav (IND) | 68 | 59.75 | 189.68 | 26 | 9 | 0 | 0 | 0 |
| BFW de Leede (NED) | 30 | 18.6 | 79.48 | 7 | 1 | 0 | 7.68 | 10.15 |
| JC Buttler (ENG) | 80 | 45 | 144.23 | 24 | 7 | 0 | 0 | 0 |
| BKG Mendis (SL) | 79 | 31.85 | 142.94 | 17 | 10 | 0 | 0 | 0 |
| Sikandar Raza (ZIM) | 82 | 27.37 | 147.97 | 16 | 11 | 15.6 | 6.5 | 14.4 |
| P Nissanka (SL) | 74 | 30.57 | 109.18 | 13 | 8 | 0 | 0 | 0 |
| AD Hales (ENG) | 86 | 42.4 | 147.22 | 19 | 10 | 0 | 0 | 0 |
| Shadab Khan (PAK) | 52 | 24.5 | 168.96 | 7 | 5 | 15 | 6.34 | 14.18 |
| LJ Tucker (IRE) | 71 | 40.8 | 125.15 | 19 | 4 | 0 | 0 | 0 |
| GD Phillips (NZ) | 104 | 40.2 | 158.26 | 19 | 8 | 0 | 0 | 0 |
| Najmul Hossain Shanto (BAN) | 71 | 36 | 114.64 | 20 | 2 | 0 | 0 | 0 |
| PA van Meekeren (NED) | 24 | 15 | 166.66 | 6 | 1 | 18 | 6.38 | 16.9 |
| KS Williamson (NZ) | 61 | 35.6 | 116.33 | 11 | 5 | 0 | 0 | 0 |
| DM de Silva (SL) | 66 | 25.28 | 129.19 | 15 | 4 | 13.83 | 6.82 | 12.16 |
| Shan Masood (PAK) | 52 | 43.75 | 118.24 | 12 | 1 | 0 | 0 | 0 |
| Mohammad Rizwan (PAK) | 57 | 25 | 109.37 | 15 | 3 | 0 | 0 | 0 |
| PR Stirling (IRE) | 66 | 28.33 | 133.85 | 16 | 6 | 0 | 0 | 0 |
| CN Ackermann (NED) | 62 | 23.57 | 110.73 | 13 | 4 | 0 | 0 | 0 |
| SC Williams (ZIM) | 64 | 19.37 | 113.13 | 14 | 2 | 22.2 | 6.16 | 21.6 |
| A Balbirnie (IRE) | 62 | 21.85 | 124.39 | 10 | 9 | 0 | 0 | 0 |
| DP Conway (NZ) | 92 | 36.25 | 116.93 | 12 | 2 | 0 | 0 | 0 |
| RR Rossouw (SA) | 109 | 35.25 | 169.87 | 9 | 9 | 0 | 0 | 0 |
| HH Pandya (IND) | 63 | 25.6 | 131.95 | 7 | 7 | 18.25 | 8.11 | 13.5 |
| KIC Asalanka (SL) | 38 | 26.2 | 115.92 | 9 | 2 | 0 | 0 | 0 |
| KL Rahul (IND) | 51 | 21.33 | 120.75 | 8 | 8 | 0 | 0 | 0 |
| Litton Das (BAN) | 60 | 25.4 | 142.69 | 11 | 5 | 0 | 0 | 0 |
| MP Stoinis (AUS) | 59 | 42 | 161.53 | 7 | 9 | 0 | 0 | 0 |
| C Campher (IRE) | 72 | 25.2 | 163.63 | 12 | 2 | 37 | 9.25 | 24 |
| PBB Rajapaksa (SL) | 34 | 17.85 | 119.04 | 14 | 2 | 0 | 0 | 0 |
| Q de Kock (SA) | 63 | 31 | 161.03 | 16 | 5 | 0 | 0 | 0 |
| Babar Azam (PAK) | 53 | 17.71 | 93.23 | 13 | 0 | 0 | 0 | 0 |
| HG Munsey (SCOT) | 66 | 60.5 | 114.15 | 16 | 0 | 0 | 0 | 0 |
| GJ Maxwell (AUS) | 54 | 39.33 | 161.64 | 11 | 6 | 6.33 | 6 | 6.33 |
| BA Stokes (ENG) | 52 | 36.66 | 105.76 | 7 | 1 | 18.5 | 6.79 | 16.33 |
| RG Sharma (IND) | 53 | 19.33 | 106.42 | 11 | 4 | 0 | 0 | 0 |
| Iftikhar Ahmed (PAK) | 51 | 22.8 | 122.58 | 6 | 6 | 0 | 0 | 0 |
| CR Ervine (ZIM) | 58 | 16 | 89.6 | 13 | 0 | 0 | 0 | 0 |
| MA Jones (SCOT) | 86 | 36.66 | 142.85 | 10 | 4 | 0 | 0 | 0 |
| DJ Mitchell (NZ) | 53 | 54.5 | 128.23 | 5 | 1 | 0 | 0 | 0 |
| Shakib Al Hasan (BAN) | 23 | 8.8 | 95.65 | 3 | 0 | 27.83 | 8.78 | 19 |
| AJ Finch (AUS) | 63 | 53.5 | 110.3 | 6 | 5 | 0 | 0 | 0 |
| TLW Cooper (NED) | 35 | 13.37 | 103.88 | 7 | 3 | 0 | 0 | 0 |
| GJ Delany (IRE) | 24 | 17.25 | 127.77 | 7 | 1 | 30.83 | 7.87 | 23.5 |
| MR Marsh (AUS) | 45 | 26.5 | 130.86 | 8 | 6 | 0 | 0 | 0 |
| W Madhevere (ZIM) | 35 | 15.14 | 127.71 | 15 | 2 | 0 | 0 | 0 |
| JO Holder (WI) | 38 | 21 | 116.66 | 4 | 1 | 9.8 | 4.74 | 12.4 |
| JN Frylinck (NAM) | 44 | 33.66 | 108.6 | 6 | 1 | 24 | 6.54 | 22 |
| RP Burl (ZIM) | 35 | 25.25 | 104.12 | 11 | 2 | 0 | 0 | 0 |
| GH Dockrell (IRE) | 39 | 20 | 120.48 | 10 | 1 | 0 | 0 | 0 |
| AK Markram (SA) | 52 | 24.75 | 125.31 | 13 | 1 | 21 | 7 | 18 |
| Mohammad Haris (PAK) | 31 | 24.25 | 144.77 | 6 | 6 | 0 | 0 | 0 |
| Afif Hossain (BAN) | 38 | 23.75 | 125 | 6 | 3 | 11 | 11 | 6 |
| FH Allen (NZ) | 42 | 19 | 186.27 | 11 | 5 | 0 | 0 | 0 |
| Muhammad Waseem (UAE) | 50 | 31 | 101.08 | 2 | 5 | 16 | 8 | 12 |
| BJ McCarthy (IRE) | 22 | 18 | 109.09 | 1 | 2 | 45.4 | 9.08 | 30 |
| SA Edwards (NED) | 21 | 15.16 | 87.5 | 8 | 0 | 0 | 0 | 0 |
| Ibrahim Zadran (AFG) | 32 | 26.66 | 96.38 | 6 | 2 | 0 | 0 | 0 |
| BA King (WI) | 62 | 79 | 125.39 | 9 | 1 | 0 | 0 | 0 |
| DA Miller (SA) | 59 | 78 | 116.41 | 5 | 3 | 0 | 0 | 0 |
| MA Leask (SCOT) | 17 | 16.5 | 117.85 | 4 | 0 | 16.75 | 6.7 | 15 |
| MD Shanaka (SL) | 35 | 13 | 105.4 | 6 | 3 | 24 | 7.57 | 19 |
| T Bavuma (SA) | 36 | 17.5 | 112.9 | 6 | 2 | 0 | 0 | 0 |
| Rashid Khan (AFG) | 48 | 28.5 | 178.12 | 4 | 4 | 19.25 | 6.41 | 18 |
| J Charles (WI) | 45 | 34.5 | 127.77 | 6 | 3 | 0 | 0 | 0 |
| Rahma0ah Gurbaz (AFG) | 30 | 22.66 | 136 | 4 | 5 | 0 | 0 | 0 |
| Mohammad Nawaz (PAK) | 28 | 13.6 | 106.25 | 7 | 2 | 22.33 | 7.44 | 18 |
| HT Tector (IRE) | 45 | 11.33 | 90.66 | 4 | 1 | 0 | 0 | 0 |
| RD Berrington (SCOT) | 37 | 22 | 117.85 | 3 | 2 | 0 | 0 | 0 |
| D Wiese (NAM) | 55 | 33 | 157.14 | 4 | 3 | 21.66 | 6.19 | 21 |
| M Shumba (ZIM) | 18 | 10.83 | 79.26 | 5 | 0 | 0 | 0 | 0 |
| Usman Ghani (AFG) | 30 | 19.66 | 92.18 | 5 | 1 | 0 | 0 | 0 |
| MM Ali (ENG) | 24 | 19 | 123.91 | 6 | 1 | 0 | 0 | 0 |
| Vikramjit Singh (NED) | 39 | 11.4 | 91.93 | 5 | 2 | 0 | 0 | 0 |
| DJ Malan (ENG) | 35 | 28 | 82.35 | 2 | 0 | 0 | 0 | 0 |
| HC Brook (ENG) | 20 | 11.2 | 96.55 | 2 | 1 | 0 | 0 | 0 |
| LM Jongwe (ZIM) | 29 | 18.33 | 134.14 | 6 | 1 | 29.5 | 11.8 | 15 |
| LS Livingstone (ENG) | 29 | 27.5 | 125 | 4 | 1 | 32 | 8 | 24 |
| JJ Smit (NAM) | 31 | 39 | 169.56 | 3 | 2 | 26.33 | 7.18 | 22 |
| JDS Neesham (NZ) | 26 | 17.66 | 143.24 | 2 | 2 | 0 | 0 | 0 |
| MG Erasmus (NAM) | 20 | 17.33 | 86.66 | 2 | 0 | 0 | 0 | 0 |
| Gulbadin Naib (AFG) | 39 | 25.5 | 137.83 | 3 | 2 | 0 | 0 | 0 |
| SJ Myburgh (NED) | 37 | 17 | 106.25 | 8 | 1 | 0 | 0 | 0 |
| TJG Pringle (NED) | 20 | 10.2 | 87.93 | 1 | 1 | 34 | 6 | 34 |
| SJ Baard (NAM) | 26 | 16.33 | 94.23 | 3 | 0 | 0 | 0 | 0 |
| Soumya Sarkar (BAN) | 20 | 12.25 | 125.64 | 3 | 3 | 0 | 0 | 0 |
| CS MacLeod (SCOT) | 25 | 16 | 111.62 | 5 | 0 | 0 | 0 | 0 |
| V Aravind (UAE) | 21 | 16 | 67.6 | 3 | 0 | 0 | 0 | 0 |
| CP Rizwan (UAE) | 43 | 22.5 | 132.35 | 3 | 1 | 0 | 0 | 0 |
| RW Chakabva (ZIM) | 15 | 5.62 | 70.31 | 5 | 1 | 0 | 0 | 0 |
| C Karunaratne (SL) | 14 | 8 | 84.21 | 3 | 0 | 48 | 8 | 36 |
| DA Warner (AUS) | 25 | 11 | 107.31 | 6 | 0 | 0 | 0 | 0 |
| E Lewis (WI) | 15 | 14 | 85.71 | 2 | 1 | 0 | 0 | 0 |
| Nurul Hasan (BAN) | 25 | 10.25 | 97.61 | 2 | 1 | 0 | 0 | 0 |
| Mosaddek Hossain (BAN) | 20 | 9.5 | 97.43 | 2 | 2 | 32 | 9.14 | 21 |
| R Powell (WI) | 28 | 13 | 111.42 | 2 | 2 | 0 | 0 | 0 |
| H Klaasen (SA) | 21 | 18 | 133.33 | 3 | 1 | 0 | 0 | 0 |
| KR Mayers (WI) | 20 | 11.33 | 113.33 | 5 | 1 | 0 | 0 | 0 |
| M van Lingen (NAM) | 20 | 11 | 100 | 4 | 0 | 0 | 0 | 0 |
| MH Cross (SCOT) | 28 | 10.66 | 96.96 | 5 | 0 | 0 | 0 | 0 |
| Najibullah Zadran (AFG) | 18 | 10.33 | 106.89 | 1 | 1 | 0 | 0 | 0 |
| T Stubbs (SA) | 18 | 10.33 | 100 | 2 | 1 | 0 | 0 | 0 |
| Basil Hameed (UAE) | 25 | 15.5 | 129.16 | 3 | 2 | 12.33 | 7.4 | 10 |
| MR Adair (IRE) | 11 | 5.6 | 90.32 | 1 | 1 | 53 | 8.83 | 36 |
| MJ Santner (NZ) | 16 | 27 | 168.75 | 0 | 2 | 14.33 | 6.45 | 13.33 |
| Chirag Suri (UAE) | 14 | 13 | 66.66 | 4 | 0 | 0 | 0 | 0 |
| TH David (AUS) | 15 | 26 | 144.44 | 2 | 1 | 0 | 0 | 0 |
| R Trumpelmann (NAM) | 25 | - | 104.16 | 1 | 1 | 0 | 0 | 0 |
| Shariz Ahmad (NED) | 16 | 25 | 131.57 | 3 | 0 | 0 | 0 | 0 |
| N Pooran (WI) | 13 | 8.33 | 86.2 | 0 | 1 | 0 | 0 | 0 |
| OF Smith (WI) | 19 | 25 | 113.63 | 1 | 2 | 42.5 | 9.44 | 27 |
| PW Hasaranga (SL) | 9 | 5 | 73.52 | 2 | 0 | 13.26 | 6.41 | 12.4 |
| AJ Hosein (WI) | 23 | 24 | 126.31 | 2 | 0 | 47 | 7.83 | 36 |
| Aayan Afzal Khan (UAE) | 19 | 12 | 85.71 | 1 | 0 | 19 | 4.75 | 24 |
| Taskin Ahmed (BAN) | 12 | 7.66 | 76.66 | 2 | 1 | 16.37 | 7.27 | 13.5 |
| Shaheen Shah Afridi (PAK) | 16 | 11 | 183.33 | 2 | 1 | 14.09 | 6.15 | 13.72 |
| PJ Cummins (AUS) | 21 | 10.5 | 105 | 2 | 1 | 44 | 8.25 | 32 |
| B Evans (ZIM) | 19 | 10.5 | 123.52 | 0 | 1 | 28.5 | 8.14 | 21 |
| JN Loftie-Eaton (NAM) | 20 | 7 | 105 | 1 | 2 | 0 | 0 | 0 |
| R Ashwin (IND) | 13 | 21 | 116.66 | 1 | 1 | 25.83 | 8.15 | 19 |
| R Ngarava (ZIM) | 9 | 5.25 | 105 | 0 | 2 | 21.88 | 7.03 | 18.66 |
| Fakhar Zaman (PAK) | 20 | 20 | 125 | 3 | 0 | 0 | 0 | 0 |
| CN Greaves (SCOT) | 16 | - | 105.55 | 2 | 0 | 0 | 0 | 0 |
| Junaid Siddique (UAE) | 18 | 18 | 105.88 | 1 | 1 | 23.75 | 7.91 | 18 |
| Mohammad Nabi (AFG) | 13 | 5.66 | 113.33 | 1 | 0 | 0 | 0 | 0 |
| Mohammad Wasim (PAK) | 12 | 8 | 72.72 | 2 | 0 | 15.5 | 7.29 | 12.75 |
| JB Little (IRE) | 8 | 8 | 76.19 | 1 | 1 | 17.18 | 7 | 14.72 |
| Darwish Rasooli (AFG) | 15 | 15 | 115.38 | 1 | 0 | 0 | 0 | 0 |
| Kashif Daud (UAE) | 15 | 7.5 | 83.33 | 0 | 1 | 0 | 0 | 0 |
| MS Wade (AUS) | 7 | 7.5 | 100 | 2 | 0 | 0 | 0 | 0 |
| LV van Beek (NED) | 6 | 7.5 | 65.21 | 0 | 0 | 41.66 | 7.65 | 32.66 |
| KD Karthik (IND) | 7 | 4.66 | 63.63 | 1 | 0 | 0 | 0 | 0 |
| KA Maharaj (SA) | 13 | 13 | 108.33 | 0 | 1 | 29.66 | 7.41 | 24 |
| TL Chatara (ZIM) | 6 | 6.5 | 68.42 | 1 | 0 | 38.75 | 6.73 | 34.5 |
| SM Curran (ENG) | 6 | 12 | 85.71 | 0 | 1 | 11.38 | 6.52 | 10.46 |
| F Hand (IRE) | 6 | 4 | 109.09 | 2 | 0 | 0 | 0 | 0 |
| Mehidy Hasan Miraz (BAN) | 11 | 11 | 84.61 | 0 | 0 | 0 | 0 | 0 |
| Azmatullah Omarzai (AFG) | 8 | 11 | 110 | 1 | 0 | 0 | 0 | 0 |
| M Theekshana (SL) | 11 | 11 | 78.57 | 0 | 1 | 22.44 | 6.69 | 20.11 |
| PD Salt (ENG) | 10 | 10 | 111.11 | 2 | 0 | 0 | 0 | 0 |
| K Rabada (SA) | 9 | 10 | 100 | 0 | 0 | 75.5 | 9.43 | 48 |
| Haris Rauf (PAK) | 6 | 10 | 142.85 | 0 | 1 | 22.25 | 6.84 | 19.5 |
| FJ Klaassen (NED) | 7 | 3.33 | 90.9 | 0 | 0 | 23.87 | 6.36 | 22.5 |
| Mustafizur Rahman (BAN) | 9 | - | 225 | 0 | 1 | 37.33 | 5.6 | 40 |
| PVD Chameera (SL) | 8 | 9 | 56.25 | 0 | 0 | 13.5 | 6.89 | 11.75 |
| RR Pant (IND) | 6 | 4.5 | 100 | 1 | 0 | 0 | 0 | 0 |
| D la Cock (NAM) | 9 | 4.5 | 81.81 | 1 | 0 | 0 | 0 | 0 |
| AR Patel (IND) | 7 | 4.5 | 100 | 1 | 0 | 38.33 | 8.62 | 26.66 |
| CAK Rajitha (SL) | 8 | - | 38.09 | 0 | 0 | 31.33 | 8.54 | 22 |
| B Muzarabani (ZIM) | 0 | 0 | 0 | 0 | 0 | 16.58 | 7.65 | 13 |
| A Nortje (SA) | 0 | 0 | 0 | 0 | 0 | 8.54 | 5.37 | 9.54 |
| Arshdeep Singh (IND) | 0 | 0 | 0 | 0 | 0 | 15.6 | 7.8 | 12 |
| MA Wood (ENG) | 0 | 0 | 0 | 0 | 0 | 12 | 7.71 | 9.33 |
| TA Boult (NZ) | 0 | 0 | 0 | 0 | 0 | 18.5 | 7.4 | 15 |
| BD Glover (NED) | 0 | 0 | 0 | 0 | 0 | 8.57 | 6.79 | 7.57 |
| TG Southee (NZ) | 0 | 0 | 0 | 0 | 0 | 16.28 | 6.57 | 14.85 |
| L Ngidi (SA) | 0 | 0 | 0 | 0 | 0 | 16.57 | 8.92 | 11.14 |
| CBRLS Kumara (SL) | 0 | 0 | 0 | 0 | 0 | 21.85 | 7.58 | 17.28 |
| LH Ferguson (NZ) | 0 | 0 | 0 | 0 | 0 | 22.71 | 8.36 | 16.28 |
| AS Joseph (WI) | 0 | 0 | 0 | 0 | 0 | 13.83 | 6.91 | 12 |
| IS Sodhi (NZ) | 0 | 0 | 0 | 0 | 0 | 21.66 | 6.72 | 19.33 |
| Hasan Mahmud (BAN) | 0 | 0 | 0 | 0 | 0 | 22.33 | 8.37 | 16 |
| Mohammed Shami (IND) | 0 | 0 | 0 | 0 | 0 | 23.83 | 7.15 | 20 |
| Zahoor Khan (UAE) | 0 | 0 | 0 | 0 | 0 | 11.4 | 4.75 | 14.4 |
| CJ Jordan (ENG) | 0 | 0 | 0 | 0 | 0 | 14 | 8.75 | 9.6 |
| MRJ Watt (SCOT) | 0 | 0 | 0 | 0 | 0 | 14 | 5.83 | 14.4 |
| KP Meiyappan (UAE) | 0 | 0 | 0 | 0 | 0 | 15 | 6.25 | 14.4 |
| A Zampa (AUS) | 0 | 0 | 0 | 0 | 0 | 16 | 6.66 | 14.4 |
| WD Parnell (SA) | 0 | 0 | 0 | 0 | 0 | 20.4 | 6.37 | 19.2 |
| JR Hazlewood (AUS) | 0 | 0 | 0 | 0 | 0 | 24.8 | 8.26 | 18 |
| CR Woakes (ENG) | 0 | 0 | 0 | 0 | 0 | 34.4 | 8.6 | 24 |
| T Shamsi (SA) | 0 | 0 | 0 | 0 | 0 | 14 | 7 | 12 |
| BM Scholtz (NAM) | 0 | 0 | 0 | 0 | 0 | 15.25 | 5.08 | 18 |
| BTJ Wheal (SCOT) | 0 | 0 | 0 | 0 | 0 | 20.75 | 6.91 | 18 |
| Mujeeb Ur Rahman (AFG) | 0 | 0 | 0 | 0 | 0 | 22 | 7.33 | 18 |
| B Kumar (IND) | 0 | 0 | 0 | 0 | 0 | 28.75 | 6.16 | 28 |
| AU Rashid (ENG) | 0 | 0 | 0 | 0 | 0 | 36.75 | 6.12 | 36 |
| Naveen-ul-Haq (AFG) | 0 | 0 | 0 | 0 | 0 | 7 | 5.25 | 8 |
| B Shikongo (NAM) | 0 | 0 | 0 | 0 | 0 | 16 | 9.6 | 10 |
| Fazalhaq Farooqi (AFG) | 0 | 0 | 0 | 0 | 0 | 25 | 6.52 | 23 |
| Pramod Madushan (SL) | 0 | 0 | 0 | 0 | 0 | 25 | 7.5 | 20 |
| Simi Singh (IRE) | 0 | 0 | 0 | 0 | 0 | 26 | 8.66 | 18 |
| JH Davey (SCOT) | 0 | 0 | 0 | 0 | 0 | 32 | 9.6 | 20 |
| MA Starc (AUS) | 0 | 0 | 0 | 0 | 0 | 34 | 8.5 | 24 |
| Naseem Shah (PAK) | 0 | 0 | 0 | 0 | 0 | 54 | 6.23 | 52 |
| B Fernando (SL) | 0 | 0 | 0 | 0 | 0 | 32.5 | 7.35 | 26.5 |
| RE van der Merwe (NED) | 0 | 0 | 0 | 0 | 0 | 37.5 | 6.81 | 33 |
| SM Sharif (SCOT) | 0 | 0 | 0 | 0 | 0 | 39 | 8.66 | 27 |
| Nasum Ahmed (BAN) | 0 | 0 | 0 | 0 | 0 | 14 | 3.5 | 24 |
| Aryan Lakra (UAE) | 0 | 0 | 0 | 0 | 0 | 24 | 8 | 18 |
| AC Agar (AUS) | 0 | 0 | 0 | 0 | 0 | 25 | 6.25 | 24 |
| Ebadot Hossain (BAN) | 0 | 0 | 0 | 0 | 0 | 25 | 7.89 | 19 |
References
[1] Kimber, A. C., and Hansford, A.R (1993) – A Statistical Analysis of Batting in Cricket. Journal of the Royal Statistical Society. Series A (Statistics in Society) 156, no. 3 : 443–55. https://doi.org/10.2307/2983068.
[2] Preston, I., and Thomas, J. (2000). “Batting strategy in limited overs cricket.” Journal of the Royal Statistical Society Series D: The Statistician 49.1 (2000): 95–106. https://www.jstor.org/stable/2681259.
[3] Barr, G. D. I., and Kantor, B. S. (2004). A criterion for comparing and selecting batsmen in limited overs cricket. Journal of the Operational Research Society, 55(12), 1266–1274, (2004). https://doi.org/10.1057/palgrave.jors.2601800.
[4] Swartz, T., Gill, P., Beaudoin, D., and deSilva, B. (2006). Optimal batting orders in oneday cricket. Computers & Operations Research. 33. 1939–1950, doi: 10.1016/j.cor.2004.09.031.
[5] Bailey, M., and Clarke, S. R. (2006). Predicting the match outcome in one day international cricket matches, while the game is in progress. Journal of Sports Science & Medicine, 5(4), 480–487.
[6] Norman, J.M. and Clarke, S.R. (2010): Optimal batting orders in cricket. Journal of the Operational Research Society. 61, 980-986, (2010). doi: 10.1057/jors.2009.54.
[7] Van Staden, P. J. (2009). Comparison of cricketers’ bowling and batting performances using graphical displays, Current Science, 96(6), p. 764–766. http://hdl.handle.net/2263/14543.
[8] Sharp, G., Brettenny, W., Gonsalves, J., Lourens, M., and Stretch, R. (2011). Integer optimisation for the selection of a Twenty20 cricket team. Journal of the Operational Research Society. 62, doi: 10.1057/jors.2010.122.
[9] Lemmer, H.H. (2013). Team selection after a short cricket series, European Journal of Sport Science, DOI: 10.1080/17461391.2011.587895.
[10] Sharma, S., and Amin, G. R. (2012). Cricket team selection using data envelopment analysis. European Journal of Sport Science. 14. 369–376 https://doi.org/10.1080/17461391.2012.705333.
[11] Dey, P., and Ghosh, D., and Mondal, A. (2011). A MCDM approach for evaluating bowlers’ performance in IPL. Journal of Emerging Trends in Computing and Information Sciences. 2. 563–573.
[12] Sharma, S.K. (2013). A Factor Analysis Approach in Performance Analysis of T-20 Cricket, Journal of Reliability and Statistical Studies; ISSN (Print): 0974-8024, (Online):2229- 5666 Vol.6, Issue 1: 69–76 (2013).
[13] Shah, S., Hazarika, P., and Hazarika, J. (2017). A Study on Performance of Cricket Players using Factor Analysis Approach. International Journal of Advanced Research. 8. 656–660. https://doi.org/10.26483/ijarcs.v8i3.3072.
[14] Valadkhani, A., Chancharat, S and Harvie, C. (2008). A Factor Analysis of International Portfolio Diversification. Studies in Economics and Finance. 25. 165–174. DOI: 10.1108/10867370810894693.
[15] Noora Shrestha. (2021). Factor Analysis as a Tool for Survey Analysis. American Journal of Applied Mathematics and Statistics. Vol. 9, No. 1, pp. 4–11, https://pubs.sciepub.com/ajams/9/1/2.
[16] Alaka, S., Sreekumar, R., and Shalu, H. (2021). Efficient feature representations for cricket data analysis using deep learning based multi-modal fusion model. arXiv preprint arXiv:2108.07139. https://arxiv.org/abs/2108.07139.
[17] Abbas, K., and Haider, S. (2021). Duckworth-Lewis-Stern method comparison with machine learning approach. arXiv preprint arXiv:2106.00175. https://arxiv.org/abs/2106.00175.
[18] Ayub, M. S., Saleemi, I., Zafar, M. F., and Habib, Z. (2023). CAMP: A context-aware cricket players performance metric. arXiv preprint arXiv:2307.13700. https://arxiv.org/abs/2307.13700.
[19] Mullick, P. (2024). Statistical evolution of ODI cricket: Analyzing performance trends and effect sizes. arXiv preprint arXiv:2406.11652. https://arxiv.org/abs/2406.11652.
[20] Sahoo, S., Tripathy, A., and Kumar, R. (2025). Identification of key performance indicators for T20 cricket using random forest and LASSO logistic regression. Applied Sciences, 15(12), 6483. https://doi.org/10.3390/app15126483.
[21] Vora, S. (2025). Cricket data analytics: Building the best XI players from T20 World Cup. SSRN Electronic Journal. https://papers.ssrn.com/sol3/papers.cfm?abstract\_id=5180123.
[22] Thilakarathne, P., Ranasinghe, R., and Fernando, T. (2024). Predicting players’ performance in T20 cricket matches using machine learning approaches. International Journal of Computer Applications Research, Advance online publication. https://doi.org/10.13140/RG.2.2.39057.48435.
[23] Chathurangi, A. (2025). Impact ranking methodologies in limited-overs cricket. International Journal of Sports Science and Coaching, 20(2), 145–160. https://doi.org/10.1177/17479541251321477.
[24] Raj, P., and Kumar, S. (2024). Cricket performance analytics: A review of machine learning approaches. Journal of the Indian Institution of Industrial Engineering, 1(2), 85–97. https://www.journal-iiie-india.com/1\_oct\_24/18\_online\_oct.pdf.
[25] Hair, J.F., Black, W.C., Babin, Anderson, R.E. and Tatham, R.L. (2007). Multivariate Data Analysis, 6th ed., Prentice-Hall, Upper Saddle River, NJ.
[26] https://www.espncricinfo.com.
[27] https://www.icc-cricket.com.
Biographies

Kuldeep Dahal is a PhD scholar in Mathematics at IIIT Manipur, Department of Humanities and Basic Sciences. He completed his Master’s degree in Statistics from Dibrugarh University. His research interests lie in statistical analysis and interdisciplinary applications. He aims to contribute meaningful academic and scientific work through his research.

Sanjib Choudhury is working as an Assistant Professor at IIIT Senapati, Manipur, and previously served at NIT Nagaland, India. He received Ph.D. in Mathematics from NERIST, Nirjuli, India in 2012 after completing his M.Phil and M.Sc in Mathematics. His academic interests include data analytics, computational methods, and emerging areas in science and technology. He actively guides Ph.D. scholars and engages in research-driven academic initiatives and collaborative projects.
Journal of Reliability and Statistical Studies, Vol. 19, Issue 1 (2026), 65–100
doi: 10.13052/jrss0974-8024.1914
© 2025 River Publishers