An Educational Tutorial on Fisher’s Exact Test for Medical Researchers
Farzan Madadizadeh1, 2, Moslem Taheri Soodejani2 and Sajjad Bahariniya3,*
1Medical Informatics Research Center, Institute for Futures Studies in Health, Kerman University of Medical Sciences, Kerman, Iran
2Center for healthcare Data modeling, Departments of biostatistics and Epidemiology, School of public health, Shahid Sadoughi University of Medical Sciences, Yazd, Iran
3Department of Healthcare Services Management, School of Health Management & Information Sciences, Iran University of Medical Sciences, Tehran, Iran
E-mail: sajjadbahari98@gmail.com
*Corresponding Author
Received 15 August 2025; Accepted 07 February 2026
Abstract
Fisher’s exact test is a fundamental statistical tool for analyzing associations in contingency tables, especially when dealing with small samples or sparse data common in preliminary medical studies. Despite its widespread use, misconceptions regarding its assumptions, application criteria, and interpretation persist. This tutorial provides a structured, practical guide to Fisher’s exact test. We begin with the theoretical foundation, contrasting it with the chi-square test and explaining its reliance on the hypergeometric distribution. The core of the tutorial features step-by-step manual calculations for educational clarity, followed by practical implementation guides using R, SPSS, and Stata. We address common pitfalls, including misuse in large samples, confusion between one- and two-tailed p-values, and the need for multiple testing corrections. Extensions to larger tables via the Fisher-Freeman-Halton test and Monte Carlo simulation are also discussed. By integrating theory with actionable examples, this tutorial aims to enhance statistical literacy and ensure the accurate application of Fisher’s exact test in clinical and epidemiological research, thereby improving the reliability and reproducibility of findings.
Keywords: Fisher’s exact test, biostatistics, epidemiological research, categorical data.
1 Background
The use of appropriate statistical methods is essential for scientific research, particularly in the medical sciences, the rigor of medical research depends heavily on the appropriate application of statistical methods [1]. With the increasing complexity of biomedical data, researchers must be equipped to choose and correctly implement analytical tools to derive valid conclusions that can inform clinical practice [2]. Accurate data analysis not only strengthens the scientific value of research but also influences clinical decision-making and health policy development [3]. However, many medical researchers encounter complex datasets without having received sufficient formal training in biostatistics, making accessible educational resources critical for improving statistical literacy [4, 5]. A common challenge in medical statistics is the analysis of categorical data from studies with limited sample sizes, such as pilot investigations, rare disease cohorts, or specific sub-group analyses, In such scenarios, traditional asymptotic tests like the Pearson chi-square test can produce unreliable p-value [6, 7].
Among the various statistical techniques available for analyzing categorical data, Fisher’s exact test is widely recognized as a robust method, especially in situations involving small sample sizes or low expected cell counts, Fisher’s exact test provides a robust solution for analyzing contingency tables under these conditions, calculating an exact probability based on the hypergeometric distribution without relying on large-sample approximations [8, 9]. Although it is a staple in medical literature – appearing in fields from oncology to clinical trials – it is frequently misunderstood or misapplied, Common errors include using it for large datasets, misinterpreting one-tailed results, or applying it to inappropriate study designs [10].
Recent methodological discourse has expanded beyond the classic test. Advances include efficient network algorithms for the Fisher-Freeman-Halton extension to larger tables, the widespread use of Monte Carlo simulation to approximate exact p-values for complex tables, and discussions on mitigating the test’s inherent conservatism through mid-p-value adjustments or unconditional exact methods [11]. Despite these advances, accessible educational resources that bridge foundational theory, modern computational practice, and clear decision-making guidelines remain scarce [12].
New applications of this test have been reported in diverse fields, including oncology [13], infectious diseases [14], and clinical trials [15] with small numbers of participants Various studies have confirmed the stability and higher reliability of this test compared to asymptotic methods, especially in retrospective and pilot studies [12, 16]. In addition, the development of statistical software such as R and Python has made it easier to use Fisher’s exact test and its extended versions for larger tables and exact Monte Carlo mixed methods.
This educational tutorial aims to address this gap by providing a novel, integrative pedagogical resource. Unlike existing materials that often focus on theory, calculation, or software in isolation, this tutorial synthesizes a clear decision framework, contrasts theoretical logic with alternative tests, and provides integrated software guidance – all within the context of common medical research scenarios. Our goal is to empower medical researchers to use this test correctly, interpret results insightfully, and stay abreast of relevant methodological developments.
2 When to Use Fisher’s Exact Test: A Decision Framework
Fisher’s exact test is primarily recommended for the analysis of contingency tables when sample sizes are small or when expected cell counts are less than five in one or more cells. Unlike the chi-square test, Fisher’s exact test does not rely on large-sample approximations and calculates an exact p-value based on the hypergeometric distribution. Although Fisher’s exact test is mathematically valid for any sample size, its use in large datasets is generally unnecessary and computationally inefficient. In such cases, the chi-square test provides adequate approximation. Clarifying this distinction is essential for appropriate methodological decision-making in medical research. Selecting the correct test for a contingency table is a critical first step. The decision primarily hinges on sample size and the expected frequencies within the table. Figure 1 provides a straightforward flowchart to guide this choice.
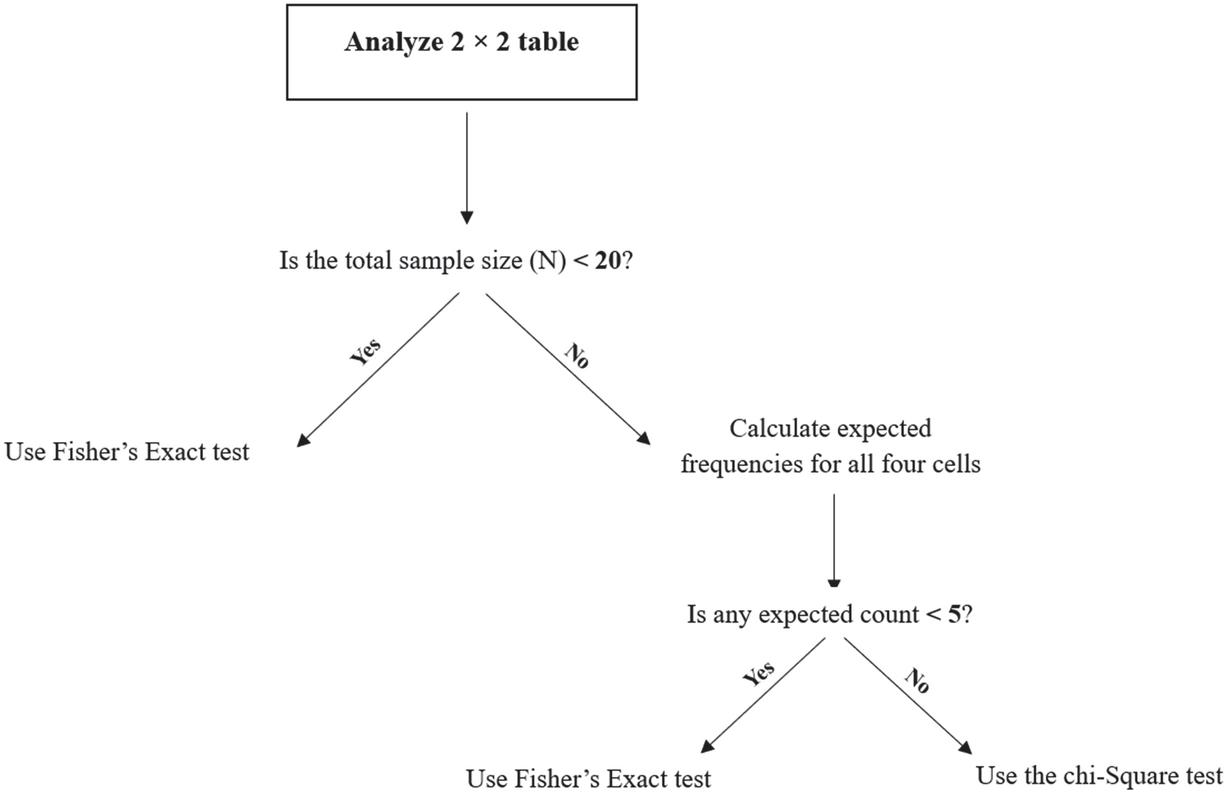
Figure 1 Decision flowchart for choosing between the chi-Square and Fisher’s Exact test for table.
Fisher’s Exact Test is recommended when the total sample size is small (N 20) or when the data is sparse (having one or more expected cell counts less than 5). It computes an exact p-value, making it the gold standard under these conditions. Chi-Square Test provides an excellent and computationally efficient approximation for large samples where all expected cell counts are 5. Using Fisher’s test in such situations is unnecessary and offers no practical advantage [17].
While the decision flowchart in Section 2 provides a direct rule for test selection, a clear understanding of the fundamental methodological distinctions between Fisher’s exact and the chi-square tests is essential for proper application and reporting. Table 1 provides a concise, side-by-side comparison of their key characteristics, assumptions, and applications.
Table 1 Comparison of fisher’s exact test and Pearson’s chi-square test for contingency tables
| Feature | Fisher’s Exact Test | Pearson’s Chi-Square Test |
| Type of Test | Exact probability test | Asymptotic approximation test |
| Statistical Basis | Hypergeometric distribution | Chi-square distribution approximation |
| Key Assumption | Fixed row and column margins (conditional) | Independent observations; adequate expected frequencies |
| Sample Size | Optimal for small samples (N 20) or sparse data | Requires larger samples for valid approximation |
| Expected Frequency Rule | Required when: Any expected count 5 (or 20% of cells) | Requires: All expected counts 5 (general guideline) |
| P-value Calculation | Exact: Sum of probabilities of observed and more extreme tables | Approximate: Based on chi-square distribution |
| Computational Demand | High for large marginal totals (but efficient with modern algorithms) | Low and computationally fast |
| Common Applications in Medicine | Pilot studies, rare disease research, small subgroup analyses, sparse adverse event data | Large observational studies, clinical trials with ample sample size, epidemiological surveys |
| One-Tailed vs. Two-Tailed | Directly calculable for both; interpretation must be carefully justified | Inherently two-tailed; one-tailed hypotheses not directly tested |
| Conservative Nature | Can be conservative (tends toward larger p-values) due to discrete distribution | Less conservative when assumptions are fully met |
| Reporting Example | “Fisher’s exact test, p 0.032” | “” |
| Primary Advantage | Accuracy and validity for small or unbalanced datasets | Simplicity and efficiency for large datasets with adequate expected counts |
| Primary Limitation | Computationally intensive for very large tables (though modern software mitigates this) | Invalid and unreliable when expected frequencies are too low |
As illustrated in Table 1, the core distinction lies in their approach to probability calculation: Fisher’s test computes an exact p-value conditional on the fixed margins, making it the valid choice for small or sparse data, whereas the chi-square test relies on a large-sample approximation. This comparison underscores that the choice is not a matter of preference but of statistical validity dictated by the data’s structure. The following section delves into the theoretical rationale behind these differences.
3 Theoretical Foundation: Contrasting Chi-Square and Exact Logic
3.1 The Chi-Square Test and Its Limitation in Small Samples
The Pearson chi-square test of independence assesses whether observed frequencies in a contingency table deviate significantly from the frequencies expected under the null hypothesis of no association. The test statistic,
follows an asymptotic chi-square distribution. This approximation relies on the Central Limit Theorem and becomes unstable – leading to inaccurate p-values – when expected cell counts are low [8, 9]. This fundamental limitation in small or unbalanced samples necessitates an exact approach.
3.2 The Logic of Fisher’s Exact Test
In contrast, Fisher’s exact test does not rely on approximating distribution. It treats the row and column totals of the table as fixed. Under the null hypothesis of no association, the probability of observing the specific arrangement of counts a,b,c,d is given by the hypergeometric probability:
where N is the total sample size. The p-value for the test is the sum of the probabilities of the observed table and all tables more extreme than it, given the fixed margins. This yields an exact probability statement about the data. A recognized characteristic of this conditional approach is that it can be conservative, leading to discussions about alternative methods like the mid-p-value in certain research contexts [12].
4 Step-by-Step Application and Interpretation
The following manual calculations are provided to illuminate the underlying mechanics. In practice, statistical software should be used for computation.
Table 2 Data from a pilot study with a zero-frequency cell
| Disease | Healthy | Total | |
| Exposed | 8 (a) | 0 (b) | 8 |
| Unexposed | 4 (c) | 4 (d) | 8 |
| Total | 12 | 4 | 16 |
4.1 Example 1: A Table with a Zero Cell (One-Tailed vs. Two-Tailed)
Consider data from a pilot study:
• Step 1 – Hypotheses: H0: No association between exposure and disease. H1: Association exists (two-sided) or Exposure increases disease risk (one-sided).
• Step 2 – Calculate Probability of Observed Table:
Using the hypergeometric formula:
• Step 3 – Determine the P-value:
∘ One-tailed (right-sided): The p-value is the probability of this table, as it is the most extreme in the direction of positive association. p 0.048.
∘ Two-tailed: We must consider tables as extreme in the opposite direction. The only more extreme table in the other direction would have cell ‘a’ 12, which is impossible given the fixed margins. Therefore, the two-tailed p-value is often calculated as .
• Step 4 – Interpretation & Conclusion:
At , a one-tailed test suggests statistical significance (p 0.048), while a two-tailed test does not (p 0.096). This stark difference highlights the critical importance of pre-specifying the hypothesis.
Scientific Insight: This example demonstrates how a seemingly strong result (not healthy individuals exposed) requires careful statistical interpretation. The choice of one-tailed test must be justified by prior biological rationale, not by the observed data. In a two-tailed framework, the evidence is not strong enough to reject the null hypothesis, underscoring the need for cautious inference in very small samples.
Table 3 Example with small cell frequencies
| Disease | Healthy | Total | |
| Exposed | 7 (a) | 1 (b) | 8 |
| Unexposed | 1 (c) | 6 (d) | 7 |
| Total | 8 | 7 | 15 |
4.2 Example 2: A Table with Small Counts
Now consider data with the smallest count being 1:
• Step 1 – Hypotheses: H0: No association. H1: Association exists (two-sided).
• Step 2 – Calculate Probabilities for Observed and More Extreme Tables:
We calculate probabilities for all tables with the same margins that are as or more extreme than the observed (where cell ‘b’ is 1).
1. Observed Table (a 7, b 1, c 1, d 6): P
2. More Extreme Table (a 8, b 0, c 0, d 7): P2 0.0004P2 0.0004
• Step 3 – Determine the Two-Tailed P-value:
The two-tailed p-value is the sum:
• Step 4 – Interpretation & Conclusion:
With p 0.015 0.05, we reject the null hypothesis.
Scientific Insight: The result provides statistically significant evidence of an association. In this small sample, most diseased individuals were exposed (7/8) and most healthy individuals were not (6/7), suggesting a potential risk effect. However, the very small counts mandate that this finding be interpreted as preliminary. It should be reported with the exact p-value and confidence interval (e.g., from logistic regression with exact methods) and warrants validation in a larger study. This illustrates the role of Fisher’s test in generating hypotheses from pilot data.
5 Extensions and Advanced Applications
5.1 The Fisher-Freeman-Halton Test for Larger Tables
For analyzing contingency tables larger than (r c), the principle of Fisher’s exact test generalizes to the Fisher-Freeman-Halton test [14]. This test evaluates the overall independence between row and column variables in larger tables. Due to the immense number of possible table configurations, computation is intensive. Modern software (e.g., R, SAS, SPSS) employs sophisticated network algorithms to perform this calculation efficiently or offers a Monte Carlo approximation as a practical alternative for very large tables [14].
5.2 Monte Carlo Simulation
When exact enumeration for larger or complex tables is computationally prohibitive, a Monte Carlo approach provides an excellent, unbiased estimate of the exact p-value [15]. This method simulates a large number of random tables (e.g., 10,000 or more) with the same fixed margins and estimates the p-value as the proportion of simulated tables that are as or more extreme than the observed one. This method, now standard in software packages, has made exact testing feasible for a much wider range of table configurations encountered in modern medical research.
6 Practical Implementation and Software Guide
6.1 Common Software Commands
• R: fisher.test (my_table) for the exact test. For Monte Carlo: fisher.test (my_table, simulate.p.value=TRUE, B=10000). For larger tables, the same function is used.
• SPSS: In Analyze Descriptive Statistics Crosstabs. Place variables in Row/Column, click Exact…, and select “Exact” to get Fisher’s test result. For Monte Carlo, select the “Monte Carlo” option within the same dialog.
• STATA: tabulate rowvar colvar, exact or fisher rowvar colvar. For Monte Carlo, the exact command offers relevant options.
6.2 Essential Checklist and Pitfalls to Avoid
1. Verify Assumptions: Ensure data are independent counts in a contingency table. For paired/matched data (e.g., pre-post), use McNemar’s test.
2. Check Sample Size: Use the decision framework in Section 2. Do not default to Fisher’s test for large samples where chi-square is appropriate.
3. Specify Your Hypothesis: Decide on a one-tailed or two-tailed test a priori based on scientific rationale, not data patterns, and interpret the corresponding p-value correctly.
4. Report Accurately: In your manuscript, state “Fisher’s exact test” and report the exact p-value (e.g., p 0.015), not “p 0.05”. Consider reporting an effect measure (e.g., Odds Ratio) with its confidence interval alongside the p-value.
5. Multiple Comparisons: If performing multiple independent tests, consider p-value adjustment (e.g., Bonferroni, FDR) to control the family-wise error rate or false discovery rate [16].
7 Discussion and Conclusion
This tutorial provides a logically structured and integrative guide to Fisher’s exact test, designed to address persistent methodological gaps in medical research. Our pedagogical approach offers a distinct contribution by synthesizing three critical pillars that are often treated in isolation: (1) a practical decision framework (Figure 1) to guide test selection, (2) a contrastive theoretical explanation that clarifies why Fisher’s test is needed by exposing the limitations of asymptotic methods in small samples, and (3) integrated software guidance coupled with scientific interpretation of results. This integrative structure is a direct response to recent calls for educational resources that bridge statistical theory, computational practice, and decision-making in a clinically relevant context [18].
Recent methodological reviews have highlighted that misuse of significance tests for categorical data remains prevalent, particularly in small-sample studies common in specialized medicine and pilot trials [19–21]. Our work directly addresses these issues by providing explicit guidance on common pitfalls, such as the inappropriate use of Fisher’s test for large samples and the critical distinction between one- and two-tailed p-values. This aligns with and extends the recommendations of Kim (2017), who identified these as recurring sources of error. However, we advance beyond these foundational warnings by embedding them within a step-by-step application workflow that includes interpretation, thereby translating methodological advice into actionable practice [18].
Our structured approach, featuring explicit interpretation subsections (Section 4), directly addresses the well-documented gap in statistical reporting where p-values are often presented without meaningful context or scientific insight [18, 22]. By framing examples within common research scenarios and translating the numerical p-value into a narrative about the hypothesis and the data’s implications, we provide a model for reporting that enhances reproducibility and clarity. This is particularly crucial given recent evidence that purely algorithmic application of statistical tests without understanding contributes to the replication crisis in science [22].
The tutorial’s discussion of extensions to larger tables and Monte Carlo methods (Section 5) connects to contemporary computational advances. While the Fisher-Freeman-Halton test has been established for decades [14], its practical application was historically limited by computational constraints. Our reference to modern network algorithms [9] and the standard availability of Monte Carlo simulation [16] in software updates the narrative, showing researchers that exact methods are now accessible for a wider range of problems. This updates older tutorials that may present exact tests as computationally prohibitive for anything beyond tables.
Furthermore, we contextualize our educational contribution within recent literature on statistical education for medical researchers. Studies like those by Nuzzo (2014) [23] and Althouse (2016) [22] emphasize that improving statistical literacy requires moving beyond formulaic teaching to foster conceptual understanding and critical thinking about test assumptions and interpretation. Our tutorial’s emphasis on why to choose a test, followed by how to execute and interpret it, is designed to foster this deeper understanding, contrasting with resources that focus solely on calculation or software commands.
In conclusion, this tutorial bridges a specific gap in educational resources for medical statistics by offering a comprehensive, integrated, and practical guide to Fisher’s exact test. It not only consolidates foundational knowledge but also incorporates modern computational contexts and addresses widespread misconceptions as identified in recent literature. By doing so, it equips researchers to apply this test more accurately and interpret its results more insightfully, thereby strengthening the validity of inferences drawn from studies with limited sample sizes – a cornerstone of exploratory and clinical research.
Implications: Correct application and interpretation of Fisher’s exact test, as guided by this tutorial, strengthen the statistical integrity of research involving categorical data from small studies. This is vital for generating reliable preliminary evidence in fields like rare diseases, personalized medicine, and early-phase trials.
Limitations: This tutorial focuses on the core principles and common applications. Extremely complex scenarios involving stratified analysis with multiple confounders are better addressed by exact logistic regression, which is beyond our current scope.
Future Directions: Building interactive and simulation-based learning approaches shown to be effective in statistical education, the development of dynamic web-based tutorials or R Shiny applications could be a logical next step. Such tools would allow researchers to manipulate table parameters in real-time and visualize the immediate impact on the p-value, test decision, and effect measures, thereby deepening conceptual understanding through active exploration.
Acknowledgements: Not applicable.
Author contributions: FM, SB and MTS were involved in the concept drafting, development, drafting, and methodology. All authors are involved in writing and reviewing the manuscript.
Disclosure statement: No potential conflict of interest was reported by the authors.
Ethics and consent: Not applicable.
Funding information: The author(s) reported there is no funding associated with the work featured in this article.
Paper context: Fisher’s exact test is a crucial statistical technique for analyzing categorical data, especially in medical research. However, many researchers struggle to apply it correctly. This educational article aims to clarify its correct application.
ORCID:
Farzan Madadizadeh https://orcid.org/0000-0002-5757-182X
Moslem Taheri Soodejani https://orcid.org/0000-0002-5165-7569
Sajjad Bahariniya https://orcid.org/0000-0001-7730-2187
References
[1] Enoyoze E, Enoyoze GE. Statistical applications in the biomedical sciences: A review. International Journal of Science and Research Archive. 2024;12(2):1594–601.
[2] Mertler CA, Vannatta RA, LaVenia KN. Advanced and multivariate statistical methods: Practical application and interpretation: Routledge; 2021.
[3] Yan F, Robert M, Li Y. Statistical methods and common problems in medical or biomedical science research. International journal of physiology, pathophysiology and pharmacology. 2017;9(5):157.
[4] Rahnenführer J, De Bin R, Benner A, Ambrogi F, Lusa L, Boulesteix A-L, et al. Statistical analysis of high-dimensional biomedical data: a gentle introduction to analytical goals, common approaches and challenges. BMC medicine. 2023;21(1):182.
[5] Tavakol M, Wilcox RR. Medical education research: the application of robust statistical methods. International journal of medical education. 2013;4:93.
[6] Fernández-Cásseres MA, Russi-Pulgar D. Categorical variable analyses: chi-square, Fisher exact, Mantel–Haenszel. Translational sports medicine. 2023:151–6.
[7] Alam R, Srivastava A, Patel HD. Categorical variable analyses: chi-square, fisher exact, and Mantel–Haenszel. Translational Urology: Elsevier; 2025. pp. 115–20.
[8] Ma L, Mao J. Fisher exact scanning for dependency. Journal of the American Statistical Association. 2019;114(525):245–58.
[9] Vierra A, Razzaq A, Andreadis A. Categorical variable analyses: chi-square, Fisher Exact, and mantel–haenszel. Translational surgery: Elsevier; 2023. pp. 171–5.
[10] Azen R, Walker CM. Categorical data analysis for the behavioral and social sciences: Routledge; 2021.
[11] Metsämuuronen J. Note on the deviating exact probabilities. Should we change the logic of Fisher-Freeman-Halton test? 2024.
[12] Neuhäuser M, Ruxton GD. The Choice Between Pearson’s Test and Fisher’s Exact Test for Tables. Pharmaceutical Statistics. 2025;24(3):e70012.
[13] George J, Maas L, Abedpour N, Cartolano M, Kaiser L, Fischer RN, et al. Evolutionary trajectories of small cell lung cancer under therapy. Nature. 2024;627(8005):880–9.
[14] Faustman DL, Lee A, Hostetter ER, Aristarkhova A, Ng NC, Shpilsky GF, et al. Multiple BCG vaccinations for the prevention of COVID-19 and other infectious diseases in type 1 diabetes. Cell Reports Medicine. 2022;3(9).
[15] Ornish D, Madison C, Kivipelto M, Kemp C, McCulloch CE, Galasko D, et al. Effects of intensive lifestyle changes on the progression of mild cognitive impairment or early dementia due to Alzheimer’s disease: a randomized, controlled clinical trial. Alzheimer’s research & therapy. 2024;16(1):122.
[16] Shan G, Gerstenberger S. Fisher’s exact approach for post hoc analysis of a chi-squared test. PloS one. 2017;12(12):e0188709.
[17] Madadizadeh F, Abdoli M. Tutorial on Bonferroni Correction as a Post Hoc Analysis of a Significant Chi-Squared Test: A Methodological Guide in Food Science. Journal of food quality and hazards control. 2025.
[18] Kim H-Y. Statistical notes for clinical researchers: Chi-squared test and Fisher’s exact test. Restorative dentistry & endodontics. 2017; 42(2):152.
[19] Morgan CJ. Use of proper statistical techniques for research studies with small samples. American Journal of Physiology-Lung Cellular and Molecular Physiology. 2017;313(5):L873–L7.
[20] Thiese MS, Arnold ZC, Walker SD. The misuse and abuse of statistics in biomedical research. Biochemia medica. 2015;25(1):5–11.
[21] Gardenier J, Resnik D. The misuse of statistics: concepts, tools, and a research agenda. Accountability in Research: Policies and Quality Assurance. 2002;9(2):65–74.
[22] Althouse AD. Adjust for multiple comparisons? It’s not that simple. The Annals of thoracic surgery. 2016;101(5):1644–5.
[23] Nuzzo R. Scientific method: statistical errors. Nature. 2014;506(7487).
Biographies

Farzan Madadizadeh is an Associate Professor of Biostatistics at the School of Public Health, Shahid Sadoughi University of Medical Sciences, Yazd, Iran. His research interests focus on making complex statistical concepts accessible through education in simple language, as well as the design and psychometric evaluation of questionnaires. He is also actively engaged in applying machine learning techniques to health-related data. Dr. Madadizadeh has published numerous peer-reviewed articles and is committed to improving statistical literacy among medical researchers and students.

Moslem Taheri Soodejani is an Assistant Professor of Epidemiology and the Deputy of Research at Shahid Sadoughi Hospital. My academic and professional work is centered on advancing methodological rigor in public health research, with a specialized focus on causal inference and the integration of digital health technologies. I am committed to leveraging data-driven approaches to improve health outcomes and inform evidence-based policy.

Sajjad Bahariniya is a PhD student in Health Services Management from Iran University of Medical Sciences. His research interests have focused on various fields such as health management, health policy, health economics, biostatistics, and other related fields. Sajjad Bahariniya has published numerous articles and is committed to promoting literacy among researchers and medical students.
Journal of Reliability and Statistical Studies, Vol. 19, Issue 1 (2026), 199–214
doi: 10.13052/jrss0974-8024.1919
© 2026 River Publishers