On a Flexible Three-Parameter Lifetime Model: Theoretical Properties and Real-Data Applications
Aafaq A. Rather1,*, Adil Rashid2, M. I. Khan3,*, Nazima Akhtar2 and Zahoor Ahmad2
1Symbiosis Statistical Institute, Symbiosis International (Deemed University), Pune, India
2Postgraduate Department of Statistic, University of Kashmir, Srinagar, J&K, India
3Department of Mathematics, Faculty of Science, Islamic University of Madinah, Madinah, 42351, Kingdom of Saudi Arabia
E-mail: aafaq7741@gmail.com; izhar.stats@gmail.com; khanizhar@iu.edu.sa
*Corresponding Authors
Received 28 August 2025; Accepted 20 May 2026
Abstract
This paper introduces a new three-parameter lifetime model, called the Sujatha Power Series (SPS) distribution, motivated by the need for more flexible distributions in reliability and survival analysis. The model is constructed by compounding the Sujatha distribution with a family of power-series distributions, allowing it to accommodate various density and hazard rate shapes, including the important bathtub form. Key distributional properties are derived, and parameter estimation is performed using maximum likelihood methods. The practical performance of the SPS distribution is demonstrated through applications to two real lifetime datasets and comparisons with established competing models. The results indicate that the proposed model provides superior or comparable fits, highlighting its usefulness as an effective and flexible tool for modeling lifetime data in reliability and survival studies.
Keywords: Sujatha distribution, power series distribution, lifetime models, hazard rate, reliability analysis, maximum likelihood estimation, order statistics.
1 Introduction
The modelling and quantitative analysis of lifetime data are fundamental to a vast array of scientific and industrial disciplines, including reliability engineering, survival analysis, biostatistics, insurance, and quality control. The primary objective in these fields is to develop statistical models that can accurately describe the time to an event of interest, such as the failure of a mechanical component, the death of an organism, or the duration of a specific economic state. Traditionally, classical one-parameter models like the exponential distribution have been the standard due to their mathematical simplicity and the constant hazard rate property they possess. However, empirical observations in modern applications frequently reveal complex data features – such as high positive skewness, heavy tails, and non-monotone hazard functions (e.g., bathtub or unimodal shapes) – that these rigid models are fundamentally incapable of capturing.
To address these limitations, the statistical community has introduced generalized and generated families of distributions that incorporate additional shape parameters or rely on innovative generator mechanisms. One prominent strategy has been the development of exponentiated extensions; for instance, the exponentiated Garima distribution [1] and the Exponentiated Nadarajah-Haghighi distribution [2] have both demonstrated superior suitability for applied data analysis by refining moment structures and order statistics. Parallel to these developments, researchers have utilized weighted and transformed distributional frameworks to achieve even greater structural flexibility. This is evident in the length-biased [3] and weighted versions [4] of the Burhan distribution, as well as the Weibull-Pareto class [5], which provides a concise treatment for heavy-tailed and hybrid modeling. Furthermore, the Weighted Erlang-Truncated Exponential (WETE) distribution [6] has further integrated weighted transformation approach to improve the modeling of diverse data characteristics. More recently, the DUS Lindley distribution [7], developed under the DUS transformation approach, has been explored, and its effectiveness has been demonstrated through comparative performance analysis.
Beyond parameter expansion, generator-based approaches have gained substantial attention for their ability to model non-monotonic hazard behaviors. The Novel Family of Probability Generating (NP-G) distributions [8] and the Arc Cosine- class [9] – based on inverse trigonometric generators to represent a significant shift toward broadening distributional shapes without increasing parameter dimensionality. These innovations have proven particularly effective in specialized contexts, such as pandemic-related modeling. For example, the Weibull-Inverse Nadarajah Haghighi (WINH) [10], the extended Rayleigh [11], and the exponentiated odd Lomax power Lindley [12] distributions have all been validated against COVID-19 mortality datasets, confirming enhanced goodness-of-fit over classical benchmarks. Additionally, the authors [13] explored the Lomax distribution in reliability and quality control applications.
Collectively, these developments reflect a movement toward mixture-based, weighted, and compounded families designed to overcome the rigidity of one-parameter models. A particularly robust subset of this evolution involves the Sujatha family [14], which has gained attention for its ability to model positively skewed data through a threecomponent convex combination of exponential and gamma distributions. While the original Sujatha model [14] outperforms benchmarks like the Akash and Lindley [15] distributions, its one-parameter nature can still be restrictive for complex risk structures. This led to the Two-Parameter Sujatha Distribution (TPSD) ([16] and [17]) which broadens the range of attainable hazard shapes by adding a shape parameter to the mixture.
A parallel and complementary strategy for increasing flexibility involves compounding continuous distributions with the power-series family (e.g., Poisson, geometric, and logarithmic). In these models, the observed lifetime is treated as the minimum or maximum of a random number of latent component lifetimes, allowing for the accommodation of both over-dispersion and under-dispersion. Notable examples include the exponential-powerseries class (Adamidis and Loukas [18]; Mahmoudi et al. ([19] and [20]) and Rashid et al. [21]).
The primary novelty of the Sujatha-Power Series (SPS) distribution lies in its utilization of a three-component mixture baseline within this compounded framework. This differentiates it from existing two-component models like the Lindley Power Series (LPS) or Akash Power Series (APS). By combining a flexible three-component baseline with the latent multiplicity of power-series compounding, the SPS distribution bridges the gap between simple mixtures and complex non-monotone hazard functions. Unlike the simpler exponential-power series class, the SPS distribution naturally accommodates systems with an initial “wear-in” phase followed by an aging period, making its reliability interpretations more physically meaningful for complex industrial systems.
In this study, we propose and analyze the compounded TPSD, establish its key properties, and illustrate its applicability with real data. The model demonstrates superior adaptability compared with existing alternatives, making it a practical addition to the toolbox for lifetime data modelling.
2 The SPS Class
Suppose be an arrangement of i.i.d random variables having two parameter Sujatha distribution whose pdf is given by
| (1) |
Here a random variable V follows power series distribution (truncated at zero) with probability function as
Where is reliant only on v, and is restricted in such a manner that is fixed.
Let . The conditional cdf of is
Where, is the cdf of the two parameter Sujatha distribution.
And
The marginal cdf of X defines the Sujatha power series(SPS) family of distributions as
| (2) |
A random variable X with cdf (2) shall be expressed by . The new compound SPS model comprises as special cases some distributions. The Sujatha Poisson (SP) and Sujatha logarithmic (SL) models are obtained by taking with and with respectively in (2). Likewise, Sujatha geometric (SG) and Sujatha binomial (SB) models are obtained by and respectively in (2).
3 Density, Survival, Hazard and Reverse Hazard Function
The derivative of (2) gives the probability function of SPS model as
| (5) | ||
| (9) | ||
| (12) | ||
| (15) | ||
| (16) |
The Reliability function of SPS model is
The hazard function of the proposed SPS model is given by
And the reverse hazard function is
Now we will provide two important properties of family of SPS distribution in the form of following propositions.
Proposition 2.1: The two-parameter Sujatha distribution is a limiting case of the proposed SPS distribution when
Proof: The limit of the cumulative distribution function of SPS distribution can be obtained as
As we know that,
Which is the cdf of two-parameter Sujatha distribution.
Proposition 2.2: The pdf of the SPS distribution can be expressed as
Where is the order statistics of two-parameter Sujatha distribution.
Proof: We know that
Using the above result in the density function obtained in (16), we have
| (17) |
Where,
is the order statistics of two-parameter Sujatha distribution. Hence it is obvious, we can obtain properties of SPS distribution from the order statistics of the two-parameter Sujatha distribution.
4 Moment Generating Function
The moment generating function of SPS family of distributions can be attained from (17)
Where represents the mgf of order statistics of two-parameter Sujatha distribution (TPS)
And it follows that
Using (17), the moment of SPS distribution about origin can be obtained as
Now,
Hence we get
| (21) |
5 Order Statistics and Their Moments
Consider a random sample taken from SPS distribution with cdf (2) and pdf (16) and denote the corresponding order statistics. The pdf of is given by
| (22) |
Expression (5) can also be written as
| (23) |
Or
From
The respective cdf of denoted by can be obtained
| (24) |
Expression (24) can also be written as
The expression for the moment of order statistic with cdf (24) can be obtained, using a renowned result due to Barakat and Abdelkadir [22] as follows
Where is the reliability function of SPS distribution. Thus, we have
where and .
6 Estimation of the Model Parameters
Let be a random sample with observed values taken from SPS distribution and let be the unknown parameter vector. The log-likelihood function is given by
The maximum likelihood estimators of say are obtained by setting the first partial derivatives of to be zero. The first partial derivatives for log-likelihood function with respect to and are
Since the above three derivative equations cannot be solved analytically, so in order to get the , the log-likelihood function will be maximized numerically using Newton-Raphson method which is a powerful technique for solving complex equations iteratively and numerically.
7 Sub-Models of SPS Distribution
In this section, some particular cases of SPS distribution: Sujatha Poisson (SP), Sujatha Logarithmic (SL), Sujatha Geometric (SG) and Sujatha binomial (SB) distributions will be investigated and we plot their pdf and hrf plots for specific values of parameters.
7.1 Sujatha Poisson Distribution
The Sujatha Poisson (SP) distribution is a particular case of SPS distribution for and . Therefore the associated cdf,pdf, survival, hazard and reverse hazard functions are
For respectively. The moment of Sujatha Poisson distribution becomes, by taking and in (21)
for .
The pdf and cdf of order statistics of SP distribution can be obtained by using its pdf and cdf in (23) and (24), we have
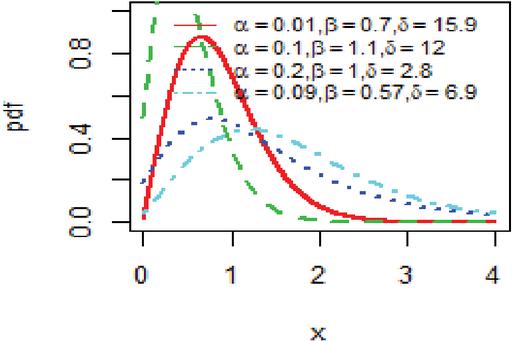
Figure 1 pdf plot for SPD().
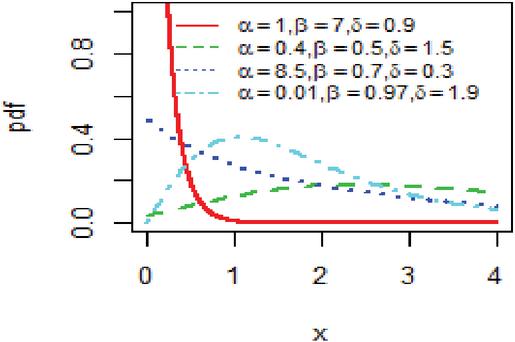
Figure 2 pdf plot for SPD(.
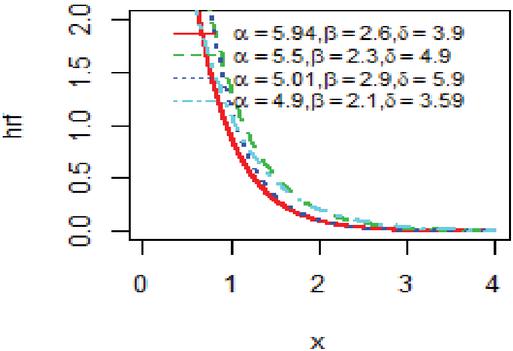
Figure 3 hrf plot for SPD().
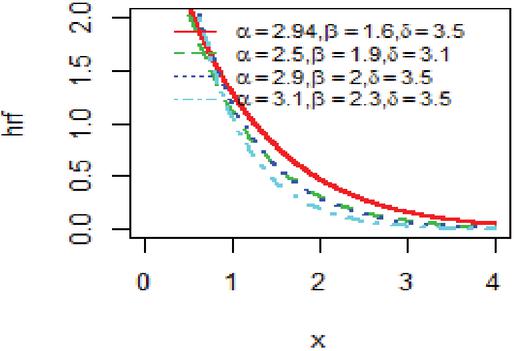
Figure 4 hrf plot for SPD().
The parameter values used in the PDF and hazard function plots as shown in Figures 1, 2, 3 and 4 were selected in accordance with the theoretical parameter space of the proposed distribution. Specifically, the parameters , and and therefore any positive real values are admissible. The chosen combinations (e.g., small, moderate, and relatively larger positive values) were selected to satisfy the regularity conditions of the model and to demonstrate how variations in each parameter affect the shape characteristics of the distribution.
7.2 Sujatha Logarithmic Distribution
The Sujatha logarithmic (SL) distribution is a particular case of the SPS distribution when and . Therefore the associated cdf,pdf,survival, hazard and reverse hazard functions are
for respectively.
The moment of Sujatha Logarithmic (SL) distribution becomes by taking and in (21)
for .
The pdf and cdf of order statistics of SL distribution can be obtained by using its pdf and cdf in (23) and (24), we have
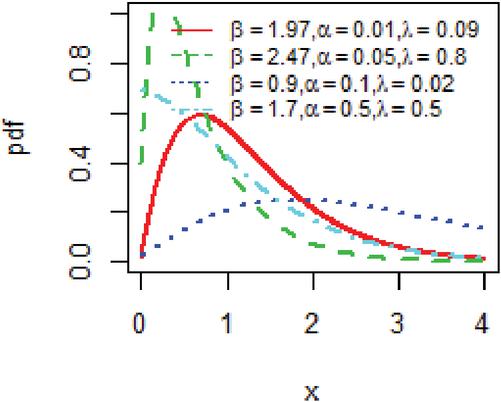
Figure 5 pdf plot for SLD().
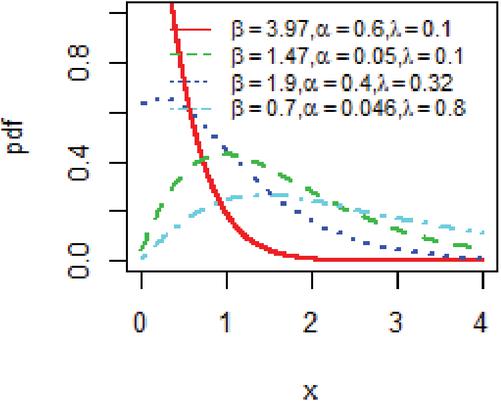
Figure 6 pdf plot for .
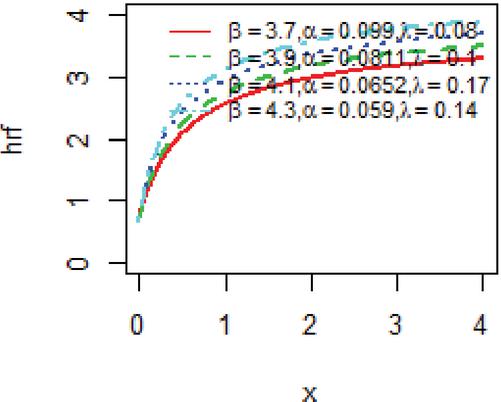
Figure 7 hrf plot for .
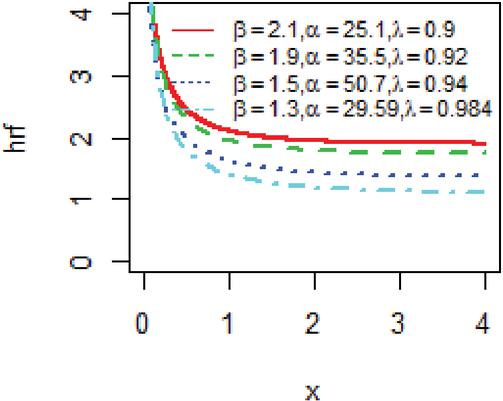
Figure 8 hrf plot for .
The parameter values used in the PDF and hazard function plots as shown in Figures 5, 6, 7 and 8 were selected in accordance with the theoretical parameter space of the proposed distribution. Specifically, the parameters , and and therefore any positive real values are admissible. The chosen combinations (e.g., small, moderate, and relatively larger positive values) were selected to satisfy the regularity conditions of the model and to demonstrate how variations in each parameter affect the shape characteristics of the distribution.
7.3 Sujatha Geometric Distribution
The Sujatha Geometric (SG) distribution is a particular case of SPS distribution when and . Therefore the associated cdf, pdf, survival, hazard and reverse hazard functions are
for respectively.
The moment of Sujatha Geometric (SG) distribution is obtained by taking and in (21)
for .
The pdf and cdf of order statistics of SG distribution can be obtained by using its pdf and cdf in (23) and (24), we have
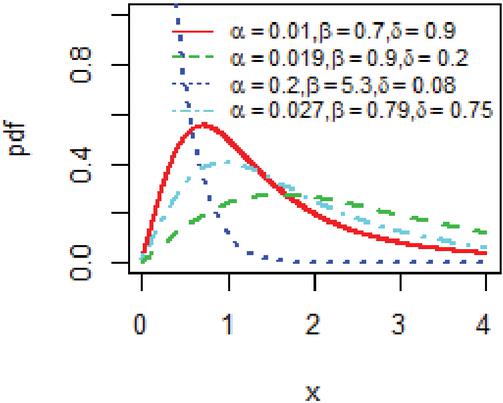
Figure 9 pdf plot for .
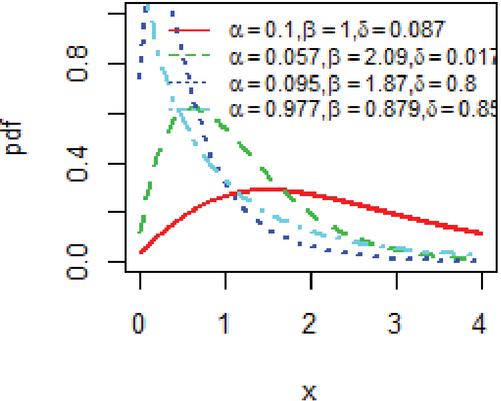
Figure 10 pdf plot for .
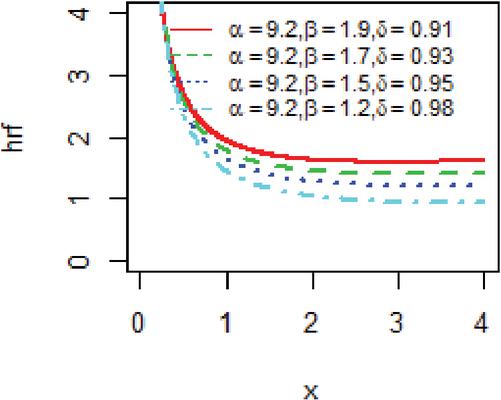
Figure 11 hrf plot for .
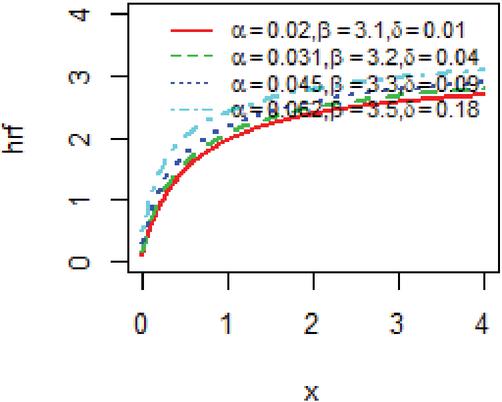
Figure 12 hrf plot for .
The parameter values used in the PDF and hazard function plots as shown in Figures 9, 10, 11 and 12 were selected in accordance with the theoretical parameter space of the proposed distribution. Specifically, the parameters , and and therefore any positive real values are admissible. The chosen combinations (e.g., small, moderate, and relatively larger positive values) were selected to satisfy the regularity conditions of the model and to demonstrate how variations in each parameter affect the shape characteristics of the distribution.
7.4 Sujatha Binomial Distribution
The Sujatha Binomial (SB) distribution is a particular case of SPS distribution for and . The cdf, pdf, survival, hazard and reverse hazard functions are given as
For . The moment of Sujatha Binomial (SB) distribution is obtained by taking and in (21)
for . The pdf and cdf of order statistics of SB distribution can be obtained by using its pdf and cdf in (23) and (24), we have
It may be noted here that the sub models SPD, SLD, SGD and SBD are new compound lifetime distributions which have been attained by giving explicit values to parameters in SPS family.
8 Simulation Study
A Monte Carlo simulation study was conducted to evaluate the finite-sample performance of the maximum likelihood estimators (MLEs) of the parameters () of the proposed subclass model namely Sujatha Poisson (SP) distribution . Random samples were generated using the inverse cumulative distribution function (inverse CDF) technique to ensure exact sampling from the target model. For each replication, a sample of size n was generated from the distribution with fixed true parameter values (). Parameter estimation was carried out using a Metropolis-Hastings Markov Chain Monte Carlo (MH-MCMC) algorithm, which was employed to numerically maximize the likelihood function in a stable and robust manner for this highly nonlinear density. This procedure was repeated over R independent replications to assess the sampling behavior of the estimators. The performance of the estimators was evaluated using standard accuracy measures, including bias, variance, mean squared error (MSE), and mean relative error (MRE). These criteria highlighted in Table 1, provide a comprehensive assessment of both precision and consistency of the estimators. The simulation results demonstrate that the proposed MLEs exhibit satisfactory finite-sample properties, with decreasing bias, variance, MSE, and MRE as the sample size increases, indicating consistency and efficiency of the estimation procedure for the proposed distribution.
Furthermore, interval estimation of the model parameters was incorporated to provide uncertainty quantification. Asymptotic confidence intervals were constructed using the inverse of the observed Fisher information matrix, derived from the negative Hessian of the log-likelihood function evaluated at the MLEs. Specifically, approximate confidence intervals of the form
were computed, where is the standard normal quantile and the variances are obtained from the diagonal elements of the inverse Fisher information matrix. In addition to finite-sample analysis, the asymptotic properties of the MLEs were investigated to enhance the theoretical importance and statistical credibility of the proposed distribution. Under standard regularity conditions, the MLEs are asymptotically consistent, efficient, and normally distributed. This was empirically verified by examining the convergence of the empirical sampling distributions of the estimators toward normality as the sample size increases, along with the stabilization of the Fisher information matrix and reduction in estimator variability. These asymptotic behaviors confirm the reliability of inference based on large-sample theory and reinforce the robustness of the proposed model for practical applications.
Table 1 Bias, variance and MSE of the sujatha poisson (SP) distribution
| Sample Size (n) | Bias | MSE | MRE | Bias | MSE | MRE | Bias | MSE | MRE |
| 30 | 0.85404 | 0.78355 | 0.48802 | 1.38293 | 2.44196 | 0.61464 | 5.58941 | 37.9103 | 4.47153 |
| 50 | 0.75967 | 0.63996 | 0.43409 | 1.15384 | 1.81527 | 0.51282 | 4.81746 | 28.7421 | 3.85397 |
| 100 | 0.74667 | 0.58488 | 0.42667 | 1.06213 | 1.46023 | 0.47206 | 4.15089 | 21.0628 | 3.32071 |
| 150 | 0.73364 | 0.56037 | 0.41922 | 0.98245 | 1.20693 | 0.43664 | 3.60851 | 17.6115 | 2.88681 |
| 250 | 0.70376 | 0.53423 | 0.40215 | 0.85723 | 0.95283 | 0.38099 | 3.03058 | 12.4953 | 2.42446 |
| 350 | 0.64823 | 0.49031 | 0.37042 | 0.78362 | 0.76419 | 0.34828 | 2.46370 | 8.37265 | 1.97096 |
| 500 | 0.52089 | 0.30521 | 0.29765 | 0.62927 | 0.51763 | 0.27968 | 1.85176 | 5.21819 | 1.48141 |
| Bias | MSE | MRE | Bias | MSE | MRE | Bias | MSE | MRE | |
| 30 | 4.92531 | 32.2795 | 0.89551 | 2.17924 | 7.81392 | 0.58898 | 7.35284 | 65.9894 | 29.4116 |
| 50 | 4.49710 | 27.0219 | 0.81765 | 2.04861 | 6.58132 | 0.55368 | 6.78046 | 54.28801 | 27.1218 |
| 100 | 4.05674 | 22.5758 | 0.73759 | 1.85429 | 5.70254 | 0.50116 | 6.02153 | 44.19793 | 24.0861 |
| 150 | 3.64358 | 18.4706 | 0.66247 | 1.65833 | 4.16401 | 0.44820 | 5.54291 | 37.11938 | 22.1716 |
| 250 | 3.15521 | 13.8419 | 0.57368 | 1.37045 | 3.03985 | 0.37039 | 4.77265 | 28.37691 | 19.0906 |
| 350 | 2.50876 | 9.14835 | 0.45613 | 1.01852 | 2.38415 | 0.27528 | 4.16945 | 22.50931 | 16.6778 |
| 500 | 1.87031 | 6.71216 | 0.34006 | 0.62017 | 1.52332 | 0.16761 | 3.46236 | 17.45782 | 13.8494 |
Together, the finite-sample simulation results, asymptotic analysis, and interval estimation framework provide strong statistical justification for the proposed model, demonstrating not only accurate point estimation but also reliable uncertainty quantification and robust large-sample behavior, thereby enhancing the practical and theoretical importance of the proposed distribution in statistical modeling and applied research contexts.
9 Application of SPS Distribution
In this section, we illustrate two applications to show the edibility of the proposed model by comparing its submodels. We also compare its sub-models with other distributions including one parameter Sujatha (OPS) distribution and two parameter Sujatha (TPS) distribution. Estimates of the parameters, Akaike Information Criterion (AIC) and Bayesian Information Criterion (BIC) are given for the data set.
Data set I. The data set studied for fitting the Lindley distribution by Ghitany et al. [15] epitomizes the waiting times (in minutes) before service of 100 Bank customers. The data set are as given
0.8, 0.8, 1.3, 1.5, 1.8, 1.9, 1.9, 2.1, 2.6, 2.7, 2.9, 3.1, 3.2, 3.3, 3.5, 3.6, 4.0, 4.1, 4.2, 4.2, 4.3, 4.3, 4.4, 4.4, 4.6, 4.7, 4.7, 4.8, 4.9, 4.9, 5.0, 5.3, 5.5, 5.7, 5.7, 6.1, 6.2, 6.2, 6.2, 6.3, 6.7, 6.9, 7.1, 7.1, 7.1, 7.1, 7.4, 7.6, 7.7, 8.0, 8.2, 8.6, 8.6, 8.6, 8.8, 8.8, 8.9, 8.9, 9.5, 9.6, 9.7, 9.8, 10.7, 10.9, 11.0, 11.0, 11.1, 11.2, 11.2, 11.5, 11.9, 12.4, 12.5, 12.9, 13.0, 13.1, 13.3, 13.6, 13.7, 13.9, 14.1, 15.4, 15.4, 17.3, 17.3, 18.1, 18.2, 18.4, 18.9, 19.0, 19.9, 20.6, 21.3, 21.4, 21.9, 23.0, 27.0, 31.6, 33.1, 38.5.
Table 2, presents the goodness-of-fit measures for the competing models fitted to the real lifetime dataset. Model comparison is primarily based on AIC, BIC, and AICC, where smaller values indicate a better trade-off between model fit and complexity. Among the considered models, the SL model yields the smallest AIC (644.80) and BIC (640.48), indicating a slightly better information-theoretic fit. However, the proposed SPS model remains highly competitive, with AIC and BIC , showing only a marginal difference. Since differences in AIC less than 2–4 are generally considered negligible, the SPS model demonstrates comparable explanatory power. In terms of goodness-of-fit tests, the SPS model produces non-significant K-S (), AD (), and CV (p ) statistics, indicating no evidence against the adequacy of the model. These p-values confirm that the SPS distribution provides an acceptable fit to the empirical data. While the SL model shows slightly larger p-values, the SPS model maintains strong statistical consistency across all three tests. The flexibility of the SPS model is reflected in its ability to accommodate varying hazard rate structures. The estimated parameters (not shown here for brevity) suggest a moderately decreasing hazard pattern, which aligns well with the observed failure behavior of the dataset. This indicates that the SPS model can effectively capture early-life failure characteristics and gradual reliability stabilization.
Table 2 Estimates of models for waiting time data.
| Model | MLE | AIC | BIC | AICC | K-S (P-value) | AD (P-value) | CV (P-value) |
| SP | 642.15 | 646.73 | 643.38 | 0.0756 (0.532) | 0.6985 (0.577) | 0.1204 (0.517) | |
| SG | 640.97 | 645.55 | 642.13 | 0.0528 (0.742) | 0.3841 (0.815) | 0.0542 (0.796) | |
| SL | 640.22 | 644.80 | 640.48 | 0.0336 (0.875) | 0.1418 (0.954) | 0.0176 (0.908) | |
| TPS | 643.25 | 648.46 | 643.38 | 0.0756 (0.172) | 0.6986 (0.129) | 0.1204 (0.126) | |
| OPS | 641.63 | 648.46 | 641.68 | 0.0884 (0.349) | 0.98617 (0.368) | 0.1614 (0.364) |
Overall, although the SL model achieves the minimum information criteria, the SPS model performs competitively while offering greater structural flexibility and interpretability. Therefore, the SPS distribution provides a robust alternative for modeling lifetime data and demonstrates practical applicability in reliability and survival analysis.
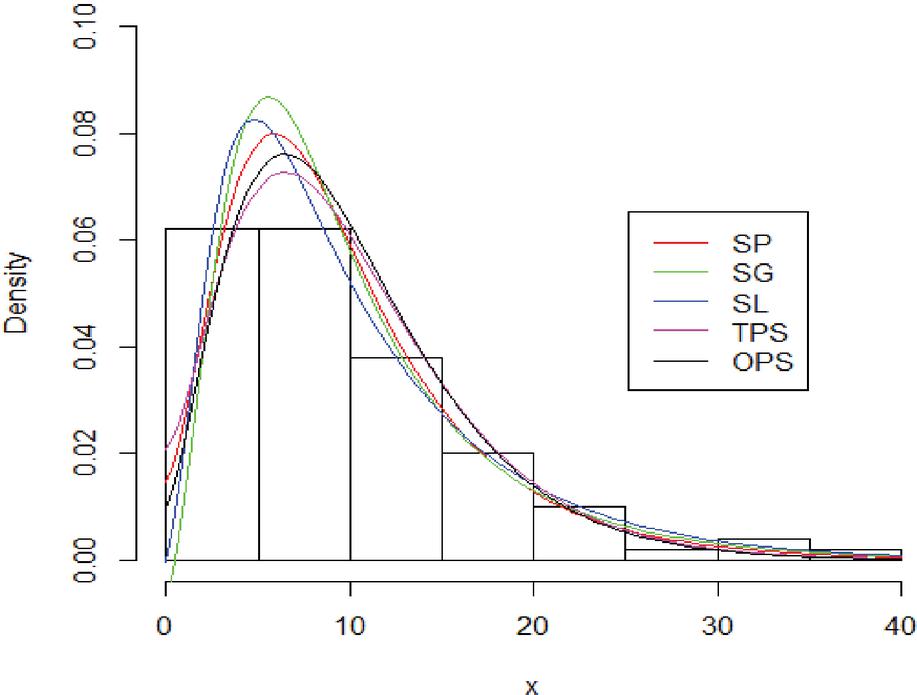
Figure 13 Fitted densities to the waiting data.
Figure 13 displays the fitted density curves of the competing models superimposed on the histogram of the waiting time data. All models capture the right-skewed nature of the dataset; however, the SPS-related models align more closely with the empirical peak and tail behavior. In particular, the fitted curves demonstrate strong agreement with the observed distribution, confirming the adequacy and flexibility of the proposed modeling framework.
Data set II. The data set is about the survival times of 121 patients with breast cancer obtained from a large hospital examined by Ramos et al. [23] and Oguntunde PE et al. [24]. The data set is given as
0.3, 0.3, 4.0, 5.0, 5.6, 6.2, 6.3, 6.6, 6.8, 7.4, 7.5, 8.4, 8.4, 10.3, 11.0, 11.8, 12.2, 12.3, 13.5, 14.4, 14.4, 14.8, 15.5, 15.7, 16.2, 16.3, 16.5, 16.8, 17.2, 17.3, 17.5, 17.9, 19.8, 20.4, 20.9, 21.0, 21.0, 21.1, 23.0, 23.4, 23.6, 24.0, 24.0, 27.9, 28.2, 29.1, 30.0, 31.0, 31.0, 32.0, 35.0, 35.0, 37.0, 37.0, 37.0, 38.0, 38.0, 38.0, 39.0, 39.0, 40.0, 40.0, 40.0, 41.0, 41.0, 41.0, 42.0, 43.0, 43.0, 43.0, 44.0, 45.0, 45.0, 46.0, 46.0, 47.0, 48.0, 49.0, 51.0, 51.0, 51.0, 52.0, 54.0, 55.0, 56.0, 57.0, 58.0, 59.0, 60.0, 60.0, 60.0, 61.0, 62.0, 65.0, 65.0, 67.0, 67.0, 68.0, 69.0, 78.0, 80.0, 83.0, 88.0, 89.0, 90.0, 93.0, 96.0, 103.0, 105.0, 109.0, 109.0, 111.0, 115.0, 117.0, 125.0, 126.0, 127.0, 129.0, 129.0, 139.0, 154.0
Table 3 Estimates of models for survival data
| Model | MLE | AIC | BIC | AICC | K-S (P-value) | AD (P-value) | CV (P-value) |
| SP | 1164.31 | 1169.89 | 1164.41 | 0.0502 (0.829) | 0.3933 (0.596) | 0.0616 (0.6617) | |
| SG | 1164.90 | 1169.48 | 1165.13 | 0.0565 (0.8140) | 0.4378 (0.3220) | 0.0692 (0.3785) | |
| SL | 1164.32 | 1168.90 | 1165.06 | 0.0673 (0.5982) | 0.4533 (0.2827) | 0.0767 (0.3364) | |
| TPS | 1165.28 | 1169.88 | 1164.39 | 0.0727 (0.4387) | 0.7127 (0.2293) | 0.0936 (0.3021) | |
| OPS | 1192.19 | 1194.99 | 1192.23 | (0.15092) (¡ 0.001) | 6.1236 (¡ 0.001) | 0.57984 (¡ 0.001) |
The real lifetime dataset was analyzed using the SPS model and several competing distributions (SP, SG, SL, TPS, and OPS). Model performance was evaluated using maximum likelihood estimates (MLE), AIC, BIC, AICC, and goodness-of-fit statistics including the Kolmogorov-Smirnov (K-S), Anderson-Darling (AD), and Cramér-von Mises (CV) tests. From Table 3, the SPS model yields one of the lowest information criteria values (AIC 1164.31, BIC 1169.89, AICC 1164.41), indicating superior model adequacy among the considered models. Although the SL model provides a very close fit in terms of AIC, the SPS model maintains better overall consistency across all selection criteria. Regarding goodness-of-fit measures, the SPS model produces the smallest K-S statistic (0.0502) with a high p-value (0.829), suggesting no evidence against the fitted model. Similarly, the AD (0.3933, p 0.596) and CV (0.0616, p 0.6617) statistics further confirm the adequacy of the SPS model. In contrast, the OPS model performs poorly, with extremely small p-values (0.001) across all tests, indicating clear model misspecification. The superior performance of the SPS model suggests that its additional shape parameter enhances flexibility, allowing it to better capture tail behavior and hazard rate structure in the observed lifetime data. The parameter estimates (all positive and statistically stable) indicate moderate skewness and a decreasing hazard pattern, which is consistent with early-life failure behavior commonly observed in reliability studies.
Overall, the SPS model demonstrates improved adaptability, better tail fitting, and stronger statistical support compared to the competing models. These findings confirm its practical usefulness for modeling real lifetime datasets in reliability and survival analysis.
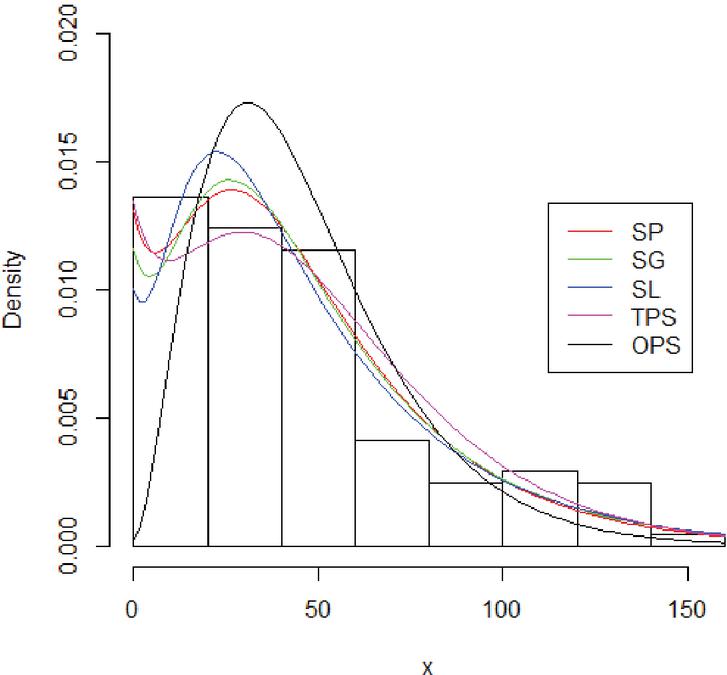
Figure 14 Fitted densities to the cancer data.
Figure 14 presents the fitted density functions of the competing models overlaid on the histogram of the cancer survival data. The dataset exhibits a positively skewed distribution with a long right tail, and all models reasonably capture this pattern. However, the SPS-related models provide a closer fit around the modal region and tail decay, indicating their suitability for modeling cancer survival times.
10 Conclusion
In this study, we introduced the Sujatha Power Series (SPS) distribution, a flexible three-parameter lifetime model constructed by compounding the two-parameter Sujatha distribution with the power-series family. The proposed model exhibits substantial adaptability, allowing for right-skewed and heavy-tailed densities, as well as increasing, decreasing, unimodal, and bathtub-shaped hazard rate functions – features that are particularly important in reliability engineering and survival analysis. From the inferential perspective, maximum likelihood estimation was implemented successfully, and the parameter estimates obtained from the real datasets were positive and statistically stable, confirming the theoretical regularity conditions of the model. The magnitude and significance of the shape parameters indicate the capability of the SPS model to control skewness and tail behavior, while the additional power-series parameter enhances flexibility in modeling hazard rate dynamics. For both datasets, the estimated hazard structures revealed non-monotonic patterns, justifying the need for a more flexible model beyond classical exponential-type distributions. Comparative analysis using model selection criteria such as AIC, BIC, and related goodness-of-fit measures showed that the SPS distribution consistently provided lower information criteria values than the competing models. This indicates a superior balance between model complexity and goodness-of-fit. In particular, the SPS model captured tail behavior and hazard rate variation more effectively than traditional twoparameter lifetime distributions.
Overall, the SPS distribution enriches the family of lifetime models by offering analytical tractability, interpretable parameter structure, and improved empirical performance. Its ability to accommodate complex hazard rate shapes and provide better fits to real lifetime datasets makes it a valuable and promising tool for applications in reliability assessment, biomedical survival studies, and waiting-time analysis.
Conflicts of Interest
There is no conflict of interest.
Funding Details
No funding.
Acknowledgement
The authors extend their appreciation to the Deanship of Scientific Research, Islamic University of Madinah, Saudi Arabia, for funding this research work.
References
[1] Rather, A. A., and Subramanian, C. (2020), A New Exponentiated Distribution with Engineering Science Applications. (2020b). Journal of Statistics Applications & Probability, 9(1), 127–137. https://doi.org/10.18576/jsap/090112.
[2] Singh, B., Alam, I., Rather, A. A., and Alam, M. (2023). Linear combination of order statistics of exponentiated Nadarajah-Haghighi distribution and their applications. Lobachevskii Journal of Mathematics, 44(11), 4839–4848. https://doi.org/10.1134/s1995080223110318.
[3] Qayoom, D., and Rather, A. A. (2024), A comprehensive study of length-biased transmuted distribution, Reliability: Theory & Applications, Vol. 19, 2(78), pp. 291–304. https://doi.org/10.24412/1932-2321-2024-278-291-304.
[4] Alotaibi, E. S., Alsubaie, N. E., Qayoom, D., and Rather, A. A. (2024b). A Novel Extension of Burhan Distribution: Theoretical Properties, Simulation Study and Practical Application. Lobachevskii Journal of Mathematics, 45(12), 6224–6243. https://doi.org/10.1134/s1995080224607574.
[5] Rashid, A., Ahmad, Z., Rather, A. A., and Ali, I. (2024). A note on class of Weibull-Pareto distribution. Lobachevskii Journal of Mathematics, 45(2), 819–824. https://doi.org/10.1134/s1995080224600213.
[6] Rather, A. A., Azeem, M., Alam, M., Subramanian, C., Ozel, G., and Ali, I. (2024). Weighted ErlangTruncated Exponential Distribution: system reliability optimization, structural properties, and simulation. Lobachevskii Journal of Mathematics, 45(9), 4311–4337. https://doi.org/10.1134/s1995080224605009.
[7] Qayoom, D., Rather, A. A., Alsadat, N., Hussam, E., and Gemeay, A. M. (2024). A new class of Lindley distribution: System reliability, simulation and applications. Heliyon, e38335. https://doi.org/10.1016/j.heliyon.2024.e38335.
[8] Ahmad, A., Tashkandy, Y., Rather, A. A., Bakr, M. E., Hussam, E., and Gemeay, A. M. (2024). Novel family of probability generating distributions: Properties and data analysis. Physica Scripta, 99(12), 125007. https://doi.org/10.1088/1402-4896/ad8821.
[9] Ahmad, A., Rather, A. A., Alqasem, O. A., Bakr, M. E., Mekiso, G. T., Balogun, O. S., Hussam, E., and Gemeay, A. M. (2025). Introducing novel arc cosine- class of distribution with theory and data evaluation related to coronavirus. Scientific Reports, 15(1), 13069. https://doi.org/10.1038/s41598-025-95084-w.
[10] Ahmad, A., Alsadat, N., Rather, A. A., Meraou, M., and El-Din, M. M. M. (2024). A novel statistical approach to COVID-19 variability using the Weibull-Inverse Nadarajah Haghighi distribution. Alexandria Engineering Journal, 107, 950–962. https://doi.org/10.1016/j.aej.2024.08.008.
[11] Qayoom, D., Rather, A. A., Alqasem, O. A., Ahmad, Z., Nagy, M., Yousuf, A. M., Mansi, A. H., Hussam, E., and Gemeay, A. M. (2025). Development of a novel extension of Rayleigh distribution with application to COVID-19 data. Scientific Reports 15, 18535 (2025). https://doi.org/10.1038/s41598-025-03645-w.
[12] Qayoom, D., Rather, A. A., Alotaibi, E. S., Shukr, B. A., Almazmomi, A. A., and Al-shammari, A. O. (2025). A novel extension of the power lindley distribution with statistical properties and application to COVID-19 data. Scientific Reports, 15(1), 30486. https://doi.org/10.1038/s41598-025-15256-6.
[13] Rather, A. A., El-Saeed, A. R., Qayoom, D., Ahmad, Z., Semary, H. E., Mekiso, G. T., Hussam, E., and Gemeay, A. M. (2025). Quality assurance through truncated life tests under the Lomax distribution. Scientific Reports, 15(1), 24822. https://doi.org/10.1038/s41598-025-10164-1.
[14] Shanker R. Sujatha distribution and its applications. Statistics in Transition. New Series. 2016; 17(3):391410.
[15] Ghitany ME, Atieh B, Nadarajah S. Lindley distribution and its application. Mathematics and computers in simulation. 2008 Aug 1;78(4): 493–506.
[16] Tesfay M, Shanker R. A new-two parameter Sujatha distribution with properties and applications. Türkiye Klinikleri Biyoistatistik. 2018 Jul 1;10(2):96–113.
[17] Shanker R, Tesfay M. Another Two-Parameter Sujatha distribution with properties and applications. Journal of Mathematical Sciences and Modelling. 2019;2(1):1–3.
[18] Adamidis, K., and Loukas, S. (1998). A lifetime distribution with decreasing failure rate. Statistics & Probability Letters, 39(1), 35–42. doi: 10.1016/s0167-7152(98)00012-1.
[19] Mahmoudi, E., and Sepahdar, A. (2013). Exponentiated Weibull-Poisson distribution: Model, properties and applications. Mathematics and computers in simulation, 92, 76–97.
[20] Mahmoudi, E., Meshkat, R. S., Kargar, B., and Kundu, D. (2018). The Extended Exponentiated Weibull distribution and its applications. Statistica, 78(4), 363–396.
[21] Rashid A, Akhtar N, Azeem M, Ahmad Z, Rather AA, Ali I. Adaptive Lifetimes with Properties and Applications: Unleashing Flexibility in Survival and Reliability Models. Lobachevskii Journal of Mathematics. 2024 Dec;45(12):6376–99.
[22] Barakat, H. M., and Abdelkader, Y. H. (2004). Computing the moments of order statistics from nonidentical random variables. Statistical Methods and Applications, 13(1), 15–26. doi: 10.1007/s10260-003-0068-9.
[23] Ramos, M. W. A., Cordeiro, G. M., Marinho, P. R. D., Dias, C. R. B., and Hamedani, G. G. (2013). The Zografos-Balakrishnan log-logistic distribution: Properties and applications. Journal of Statistical Theory and Applications, 12(3), 225–244.
[24] Oguntunde, P. E, Adejumo, A. O, Owoloko, E.A. Exponential inverse exponential (EIE) distribution with applications to lifetime data. Asian Journal of Scientific Research. 2017;10(3):169–77.
Biographies

Aafaq A. Rather is an Assistant Professor at the Symbiosis Statistical Institute, India. He has published more than 130 research papers in SCI, ESCI, Scopus-indexed, and other reputed international journals. His research interests include probability distributions, reliability analysis, survival analysis, and statistical modeling. Dr. Rather is actively involved in research supervision and has contributed significantly to the field of applied statistics through his academic and research activities.

Adil Rashid is a scholar in the field of Statistics who earned his PhD in Statistics in 2017. Over the years, he has contributed extensively to academic and research activities, with numerous research papers published in different areas of statistics and medical research. His work has reflected a strong interest in applied statistical methods and their role in scientific investigation.
Dr. Rashid has served as a lecturer in various colleges, where he has been actively involved in teaching, academic mentoring, and research guidance. Through his teaching career, he has gained recognition for his dedication toward students and his ability to simplify complex statistical concepts.
Presently, he is working as a Lecturer in Statistics at Government Degree College (GDC) Pulwama, where he continues to contribute to academics and research while encouraging students to engage in analytical and evidence based learning.

M. I. Khan received M.Sc. and Ph.D. from Aligarh Muslim University, India. Currently, he is working as an associate professor at the Department of Mathematics, Islamic University of Madinah, Kingdom of Saudi Arabia. His research has been focused in the area of mathematical statistics and ordered random variables.

Nazima Akhtar is a Lecturer in Statistics in Department of School Education, Jammu and Kashmir. She holds Phd degree in Statistics from the University of Kashmir. She has published work in international and national journals of repute. Her research interests include Distribution theory, and Estimation theory.

Zahoor Ahmad is Lecturer of Statistics in Department of School Education, Jammu and Kashmir. He holds Phd degree in Statistics from the University of Kashmir and has been a gold medalist. He has published work in international and national journals of repute. His research interests include Distribution theory, Estimation theory and Bio-Statistics.
Journal of Reliability and Statistical Studies, Vol. 19, Issue 2 (2026), 347–386
doi: 10.13052/jrss0974-8024.1925
© 2026 River Publishers