Prediction of Wheat Yield Through Soil Nutrient: Machine Learning and Feature Selection Approaches
Afshan Tabassum1,*, Manish Sharma1, Bupesh Kumar2, Sudhakar Dwivedi3, Lalit Mohan Gupta4 and Sanjay Guleria5
1Department of Statistics and Computer Science, Faculty of Basic Sciences, Sher-e-Kashmir University of Agricultural Sciences & Technology of Jammu, Main Campus, Chatha, Jammu – 180009, India
2Department of Plant Breeding and Genetics, Faculty of Agriculture, Sher-e-Kashmir University of Agricultural Sciences & Technology of Jammu, Main Campus, Chatha, Jammu – 180009, India
3Department of Agricultural Economics and ABM, Faculty of Agriculture, Sher-e-Kashmir University of Agricultural Sciences & Technology of Jammu, Main Campus, Chatha, Jammu – 180009, India
4Department of Forest Products and Utilization, Faculty of Horticulture and forestry, Sher-e-Kashmir University of Agricultural Sciences & Technology of Jammu, Main Campus, Chatha, Jammu – 180009, India
5Department of Biochemistry, Faculty of Basic Sciences, Sher-e-Kashmir University of Agricultural Sciences & Technology of Jammu, Main Campus, Chatha, Jammu – 180009, India
E-mail: tabassumafshan85@gmail.com; manshstat@gmail.com; bupeshsharma@gmail.com; dwivedi.sudhakar@gmail.com; headforestproducts@gmail.com; guleria71@gmail.com
*Corresponding Author
Received 29 August 2025; Accepted 13 February 2026
Abstract
Wheat productivity is greatly influenced by soil nutrient variability, especially in areas with agroclimatic diversity like Jammu. The study analyzed a comprehensive dataset comprising 5,196 soil samples and corresponding wheat yield records from the districts of Jammu, Rajouri, and Kathua in Jammu region. This work predicted wheat yield from soil factors using machine learning (ML) models. The ML models used include Random Forest, Gradient Boosting, Support Vector Regression, and Decision Trees, in conjunction with embedded and wrapper-based feature selection methods. The soil variables analyzed in this study included pH, EC, OC, N, P, K, S, Cu, Zn, Mn, and Fe. Among the tested machine learning models, Random Forest yielded the highest predictive accuracy, with RMSE 2.6570, MAE 2.1578, and MAPE 44.87%. Recursive Feature Elimination identified an optimal subset of 10 soil predictors, with S, Mn, Zn, and EC emerging as the most influential variables for wheat yield estimation. In all models, sulfur (S), manganese (Mn), electrical conductivity (EC), and zinc (Zn) were consistently found to be the most significant predictors. In comparison to other models, Random Forest and Support Vector Machines generated more reliable and broadly applicable predictions, according to stability study using k-fold cross-validation. The study highlights the effectiveness of machine learning techniques, particularly Random Forest, in predicting wheat yield from soil parameters. The consistent importance of micronutrients like S, Mn, and Zn underscores the need for micronutrient-focused soil management strategies. These findings demonstrate the usefulness of data-driven approaches in heterogeneous soil and climatic conditions.
Keywords: Wheat yield, soil parameters, machine learning, feature selection, random forest.
1 Introduction
Wheat (Triticum spp.) is one of the world’s most important staple crops, accounting for nearly 29% of the global cereal cultivation area and contributing approximately 18% of global caloric intake and 19% of global protein intake (Kruseman et al., 2025). Wheat is essential to food security and rural livelihoods in India. Over 75,000 hectares of wheat are grown in the Jammu division of the Union Territory of Jammu and Kashmir, making it a crucial region even though the country’s output is dominated by large wheat-producing states like Punjab, Haryana, and Uttar Pradesh. This area, which has temperate and sub-temperate agroclimatic zones, has particular problems, such as water stress, fragmented landholdings, and depletion of soil nutrients. These difficulties frequently result in wheat yields that are below ideal and vary geographically; at the moment, they range from 24 to 27 quintals per hectare (Anonymous, 2025).
Soil health is a foundational pillar of sustainable agriculture, directly influencing root development, nutrient availability, and microbial activity. Macronutrients such as nitrogen (N), phosphorus (P), and potassium (K), along with secondary and micronutrients like sulfur (S), manganese (Mn), zinc (Zn), and iron (Fe), play vital physiological roles in plant growth, grain filling, and protein synthesis (Fageria et al., 2002). However, the complex, non-linear, and interaction effects of these variables on crop output are frequently not captured by conventional yield estimation models, which usually make use of linear assumptions. This is especially true in regions with a variety of soil and climate patterns.
Recent advancements in machine learning (ML) have significantly improved agricultural prediction by enabling models to learn complex and nonlinear relationships among soil properties and crop yield. Several recent studies (Khaki et al., 2020; Pathak et al., 2022; Singh et al., 2023; Raza et al., 2024) have demonstrated the effectiveness of ML algorithms in enhancing yield forecasting accuracy and soil fertility assessment. Ensemble methods such as Random Forest (RF) and Gradient Boosting (GB), as well as Support Vector Machines (SVM), have demonstrated robust performance in predictive agriculture, especially when coupled with feature selection algorithms (Chlingaryan et al., 2018; Khaki and Wang, 2019). Feature selection remains crucial in such models, particularly when handling high-dimensional soil datasets with multicollinearity, as it helps improve model accuracy, interpretability, and generalizability (Guyon and Elisseeff, 2003). However, despite this progress, limited research has focused specifically on soil nutrient–based wheat yield modeling for the Jammu region, where spatial variability in soil fertility and micronutrient deficiencies strongly influence wheat productivity. The novelty of the present study lies in integrating two complementary feature selection approaches – embedded and wrapper methods – with four widely used ML models (Random Forest, Support Vector Machine, Gradient Boosting, and Decision Tree) to identify the most influential soil nutrient predictors of wheat yield. Furthermore, the study utilizes a large dataset of 5,196 soil samples collected from diverse wheat-growing areas of the Jammu region, providing a robust and data-driven framework for improving yield prediction and supporting location-specific nutrient management strategies.
Although ML-based yield prediction has been the subject of many studies worldwide, very few have concentrated on soil nutrient-based modeling in the northern hilly and semi-hilly regions of India. In order to close this gap, the current work uses specific soil nutrient characteristics to apply and compare machine learning models to forecast wheat output in the Jammu region. Specifically, the objectives are: (i) To evaluate the performance of different machine learning models for wheat yield prediction based on soil data, and(ii) To identify key soil parameters influencing yield using embedded and wrapper-based feature selection techniques.
2 Materials and Methods
The study’s dataset consists of secondary data on wheat production and soil fertility that were gathered from the records of the Department of Agriculture, Jammu & Kashmir’s Soil Testing Laboratory, Directorate of Agriculture, Talab Tillo, Jammu. Data have been collected for major wheat-growing regions of the Jammu region, including the districts of Jammu (Latitude: 32.7266∘N and Longitude: 74.8570∘E), Rajouri (Latitude: 33.3753∘N and Longitude: 74.3047∘E), and Kathua (Latitude: 32.3700∘N and Longitude: 75.5200∘E), under Model Village Programme 2019–2020 (Figure 1).
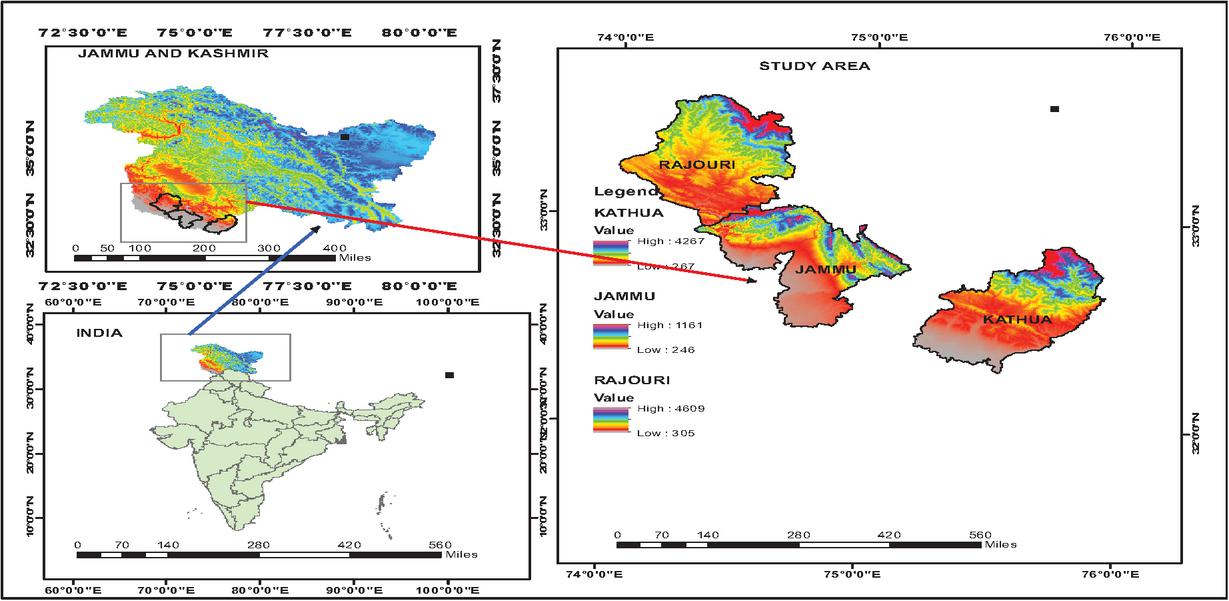
Figure 1 Location map of study area.
The legend values in Figure 1 represent the high and low elevation levels of each district. ‘High’ and ‘Low’ denote the maximum and minimum elevation altitudes observed within Jammu, Rajouri, and Kathua districts, respectively, which may influence soil characteristics and wheat yield.
The study’s dataset includes 5,196 soil samples that were taken from the districts of Jammu, Rajouri, and Kathua in the Jammu region. The samples included measurements of pH(A measure of the acidity or alkalinity of soil), EC(Indicates the salinity level of the soil), OC(organic matter content), N(Nitrogen), P(Phosphorus), K(Potassium), S(Sulphur), and Zn(zinc), Fe(Iron), Cu(copper), and Mn(Manganese) as it represents natural fluctuations in soil fertility and covers a wide range of agro-ecological variables within the chosen districts, the data appropriate for machine learning-based modeling. These soil factors are included in each sample and are known to affect wheat yield. These parameters are used as input features for predicting the yield of wheat. This comprehensive data were randomly split into training (80%) and testing (20%) sets using stratified sampling to maintain regional proportions. All model results, including RMSE, MAE, and MAPE, were based on predictions made on the test set and preprocessed for use in training and evaluating various machine learning models, with the aim of predicting wheat yield based on soil fertility status across the Jammu region.
To ensure model accuracy and consistency, statistical techniques like Missing Value Imputation was applied where missing values in the dataset were handled using median imputation, implemented using the preProcess() function from the caret package in R.4.4.2; Factor Handling: where non-numeric variables were appropriately encoded then Recursive Feature Elimination (RFE) with cross-validation was used to identify the most influential variables contributing to wheat yield. The Random Forest-based (RFB) method was used to rank the features based on their predictive importance. While tree-based algorithms (Random Forest, Decision Trees, Gradient Boosting) are generally insensitive to the scale of input features and therefore usually do not require normalization, we applied normalization/standardization selectively for algorithms that rely on distance or gradient-based optimization (for example, Support Vector Regression). This ensured fair comparison across models and avoided introducing scale-related bias in models that require scaled inputs.
Machine Learning Models:
The four supervised machine learning techniques were chosen because of their solid theoretical underpinnings, capacity to manage high-dimensional and non-linear data, and proven track record of performance in research predicting agricultural output as in our case wheat.
a. Random Forest (RF): Breiman (2001) first proposed Random Forest (RF) method, an ensemble learning method that combines predictions from several decision trees to improve robustness and lessen overfitting. Because RF can capture non-linear interactions between soil, climate, and crop variables, it has been frequently used in the agricultural environment. Notably, Khaki and Wang (2019) used high-dimensional remote sensing and soil datasets to apply RF for wheat yield prediction, showcasing its excellent accuracy and interpretability. To ensure stability, RF was implemented in this study using 500 trees and the randomForest package in R.4.4.2. RFE was also used to incorporate it into feature selection, identifying the key soil characteristics influencing wheat yield.
b. Support Vector Machine (SVM): The Support Vector Machine (SVM), a kernel-based technique developed by Vapnik(1995), which can simulate intricate, non-linear interactions. Since SVM for Support Vector Regression (SVR) fits a function within a given margin, it is resistant to limited datasets and outliers, which are both frequent in regional agronomic research. Applying SVM to wheat, Tao et al. (2017) achieved high predicted accuracy by connecting wheat yield responses to climate variables throughout northern China. Moreover, Lamorski et al. (2008) showed how effective it is at simulating soil water retention, a crucial crop modeling component. This study used the e1071 package in R to implement SVM with a radial basis function (RBF) kernel. Its performance was competitive, notwithstanding the need for parameter adjustment, particularly when it came to capturing localized, non-linear soil-yield correlations.
c. Gradient Boosting Machine (GBM): Friedman (2001) defined GBM, which constructs a sequence of decision trees in which each tree fixes the mistakes of the one before it. Because of its great accuracy and adaptability, GBM has grown in popularity in agricultural prediction applications. Khaki et al. (2020) demonstrated GBM’s flexibility to geographical variability by modeling wheat yield across several agro-ecological zones in the United States using it in combination with environmental and soil data. The gbm package in R was used to build GBM for this work, and cross-validation was used to optimize the tuning parameters (learning rate and number of trees). The significance of features was also evaluated using GBM, with a focus on sulfur, manganese, and electrical conductivity as important soil factors that affect yield.
d. Decision Tree (DT): One of the first supervised learning techniques, Decision Tree (DT) models were first presented by Quinlan (1986) by recursively splitting input features. DT’s are straightforward and easy to understand, but they might overfit, particularly when working with complicated datasets. These are still useful, though, for baseline comparisons and preliminary modeling. Misra et al. (2016) employed DT’s in their wheat research to forecast wheat production under various fertilizer treatments and discovered that the model was helpful in determining nutrient thresholds. The “anova” approach for regression problems was used in the current work to implement DTs using the R rpart package. DTs shed light on the hierarchical nature of variable influence, albeit having somewhat greater error rates.
The machine learning models used in this study were selected based on their ability to capture the complex, nonlinear, and multivariate relationships that typically exist between soil nutrient parameters and wheat yield. Random Forest, Gradient Boosting, and Decision Tree models were chosen because they can effectively handle high-dimensional data, multicollinearity, and variable interactions while providing built-in feature importance measures. Support Vector Regression (SVR) was included due to its strong performance in modeling continuous outcomes and its capability to address nonlinear patterns through kernel functions. The feature selection approaches were also intentionally chosen: embedded methods were used to obtain importance rankings directly from tree-based models, whereas Recursive Feature Elimination (RFE), a wrapper method, was applied to iteratively identify the most influential soil nutrients. Together, these techniques provide a comprehensive and reliable framework for selecting relevant predictors and improving the accuracy of soil-based wheat yield estimation.
When combined, these models allowed for a comparative analysis of machine learning approaches for estimating soil-based yield. In addition to increasing accuracy, their incorporation with feature selection approaches made it clearer which soil minerals were agronomically significant, providing useful information for precision farming in the Jammu area.
2.1 Feature Selection Techniques
Feature selection is essential for improving model accuracy and interpretability, especially in high-dimensional agronomic datasets. This study employed two well-established approaches:
i. Embedded Methods-(Model-Based Feature Importance): This method integrates feature selection into model training by calculating importance scores from the internal structure of algorithms such as Random Forest and Gradient Boosting. These approaches were first formalized using ensemble techniques (Breiman, 2001; Friedman, 2001), and they have shown promise in problems involving agricultural prediction. To be more precise, Khaki and Wang (2019) employed Random Forest and Gradient Boosting to determine which environmental and soil factors had the greatest impact on wheat production under various growth circumstances. To rank nutritional variables influencing wheat yield under Indian agroclimatic conditions, Pathak et al. (2022) used Random Forest-based feature importance. Sulfur, manganese, zinc, and electrical conductivity were consistently identified by embedded approaches as important predictors of wheat production in the current investigation.
ii. Wrapper Method (RFE): This method train models and measure performance metrics like RMSE to iteratively evaluate subsets of features. Since its initial proposal by Guyon et al. (2002), RFE has been used in a number of agronomic settings. Raza et al. (2022) used RFE to improve input factors in the prediction of wheat yield using remote sensing indices and support vector regression. To filter important physicochemical soil characteristics influencing wheat production in northern India, Misra and Srivastava (2021) employed wrapper approaches.
Finally in order to measure the performance of proposed machine learning models the following criteria are used:
Root Mean Square Error (RMSE): The average squared difference between expected and actual data is measured by the root mean square error, or RMSE. A lower RMSE is a sign of improved model performance. It penalizes big mistakes more severely than minor ones.
Where, is the total number of observations, is the actual observation, the predicted value and is the mean of observed value.
Mean Absolute Error (MAE): The average of the absolute deviations between expected and actual values is determined by MAE. All errors, regardless of direction, are given identical weight. Improved accuracy is indicated by a lower MAE.
where, is the total number of observations, is the actual observation, the predicted value and is the mean of observed value.
Mean Absolute Percentage Error (MAPE): The prediction error is expressed as a percentage of the actual values using MAPE. It is beneficial for evaluating model performance on various scales. A lower MAPE indicates a more accurate prediction.
where is the actual value and is the forecast value.
3 Results
The soil nutrient profile showed notable spatial variability across the three districts, with clear differences observed in macronutrients (N, P, K), Organic Carbon, and key micronutrients such as Zn, Mn, and S (Figures 2, 3 and 4). These variations indicate heterogeneous soil fertility conditions that can influence wheat yield. District-wise nutrient trend plots were also included to illustrate patterns in soil nutrient distribution, providing improved clarity on how nutrient imbalances correspond to yield variations across the region. These additions strengthen the analytical framework and support a more comprehensive interpretation of the model outputs.
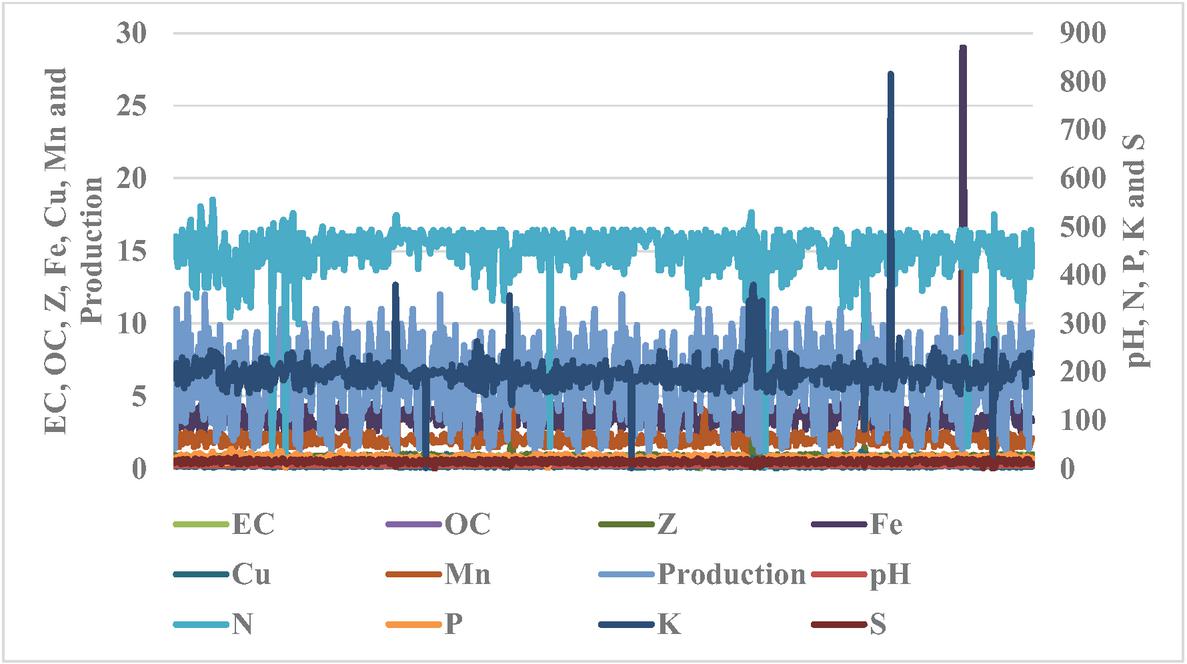
Figure 2 Variation in soil nutrient distribution and wheat yield across Rajouri.
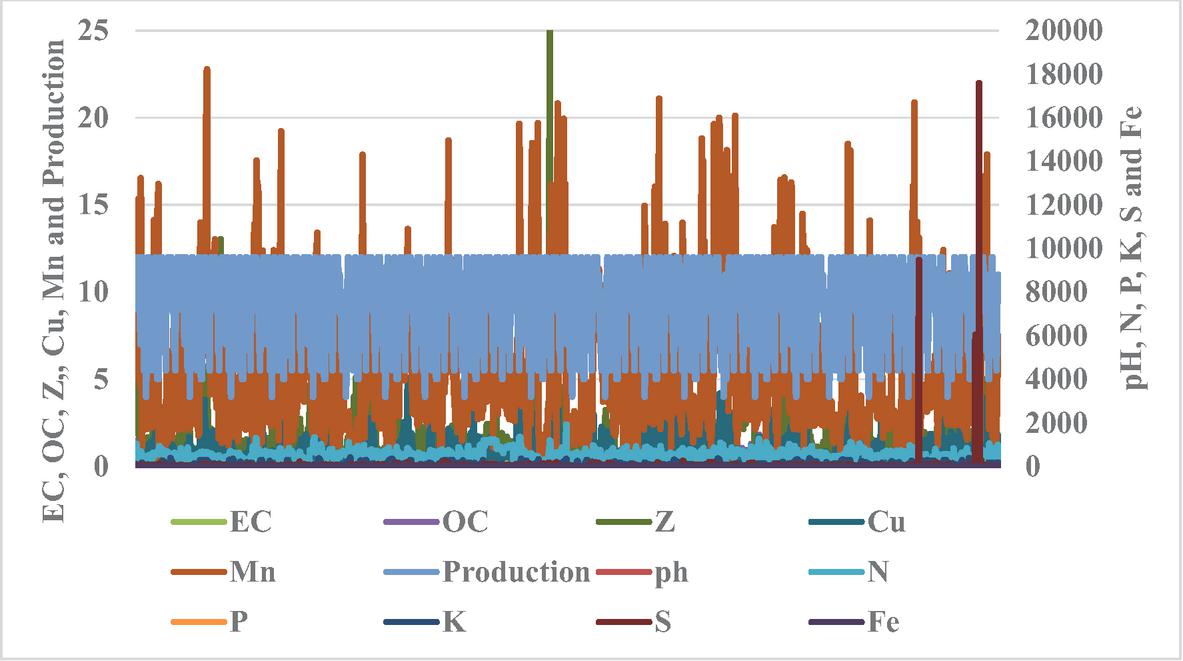
Figure 3 Variation in soil nutrient distribution and wheat yield across Kathua.
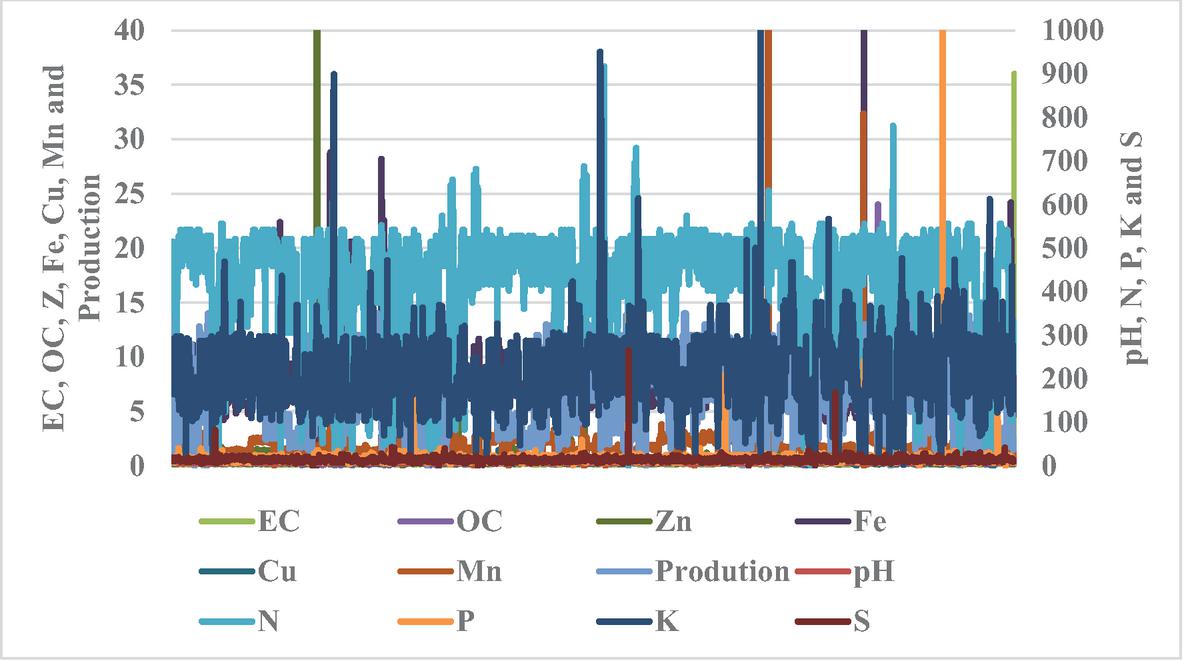
Figure 4 Variation in soil nutrient distribution and wheat yield across Jammu.
Using two feature selection techniques – embedded and wrapper methods – the study initially evaluated the importance of soil properties to identify the most influential predictors (Table 1). The Embedded Methods i.e. Gradient Boosting, Random Forest, and Decision Tree feature were employed. The contribution of each variable to the prediction accuracy of the model is computed internally. Sulphur, Manganese, Electrical conductivity, and Zinc were consistently listed as the leading contributors in all tree-based models specifically ensemble algorithms such as Random Forest and Gradient Boosting Machines, along with decision-tree-based techniques.
In the wrapper approach, feature selection was performed using Recursive Feature Elimination (RFE) with Random Forest serving as the underlying estimator. For every feature count, the Root Mean Square Error (RMSE) was computed (Figure 5). At first, the RMSE is high (over 3.1) with few features. RMSE steadily declines as the number of features rises. Using about ten characteristics results in the lowest RMSE. Adding extra features doesn’t substantially enhance performance; after ten features, RMSE is nearly constant. Until approximately ten features, the RMSE dropped as the number of characteristics increased. In addition, other qualities yielded declining returns, proving that 10 was the ideal number. Sulfur, Manganese, Zinc, Phosphorus, Potassium, Iron, Copper, Organic Carbon, and Nitrogen are thus the features that have been chosen. This dominance of Sulphur (S), Manganese (Mn), and Zinc (Zn) is agronomically meaningful, as these micronutrients play crucial roles in nutrient balance, enzymatic regulation, and overall plant growth, thereby influencing wheat productivity. Improvements were negligible after ten characteristics, suggesting decreasing benefits. Consequently, a 10-feature model provides a useful trade-off between complexity and performance.
Table 1 Summary of models along with feature selection techniques
| Model | Recommended Method 1 | Recommended Method 2 |
| DT | Embedded (Feature Importance) | RFE or Permutation Importance |
| RF | Embedded (Feature Importance) | RFE or Permutation Importance |
| SVM | RFE | Permutation Importance |
| GB | Embedded (Feature Importance) | Permutation Importance |
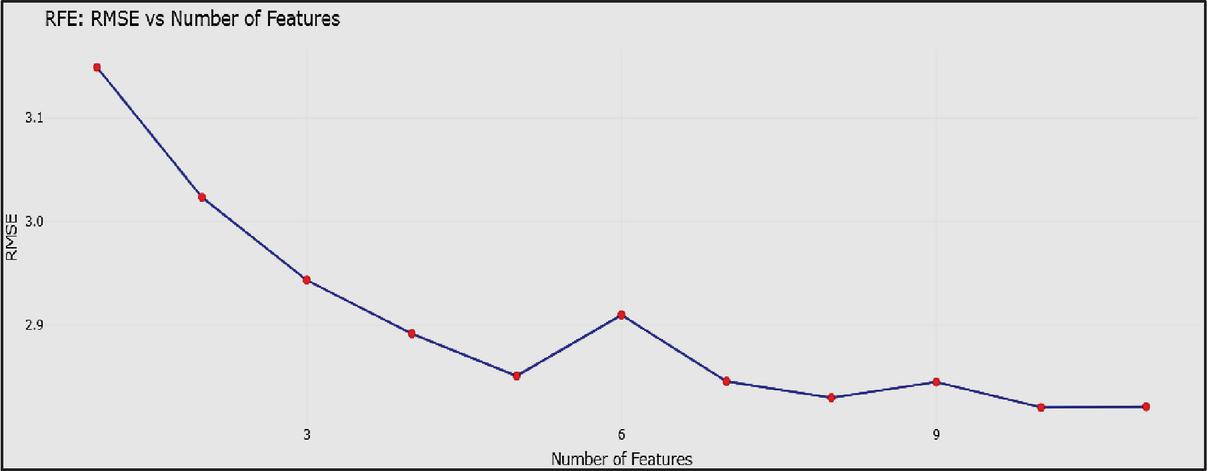
Figure 5 RMSE vs. number of features plot.
The MAE, MAPE, and RMSE were used to evaluate predictive accuracy (Figure 6). All performance metrics reported in this section correspond specifically to the test-set evaluation results. The refined values produced by the final models employing ideal parameters and chosen characteristics are shown in (Table 2). With the lowest RMSE (2.6570), lowest MAE (2.1578), and lowest MAPE (44.8689), the Random Forest (RF) model fared better than all others, according to the latest model evaluation results. Despite having somewhat higher RMSE (2.8534), MAE (2.2670), and MAPE (46.72), Decision Tree’s interpretability is aided by its simplicity. Results from Support Vector Machine and Gradient Boosting Machine were competitive, however they had greater variability and error rates.
Table 2 Model evaluation metrics
| Model | RMSE | MAE | MAPE (%) |
| RF | 2.6570 | 2.1578 | 44.87 |
| GBM | 2.7877 | 2.1962 | 46.07 |
| SVM | 2.8010 | 2.2190 | 45.80 |
| DT | 2.8534 | 2.2670 | 46.72 |
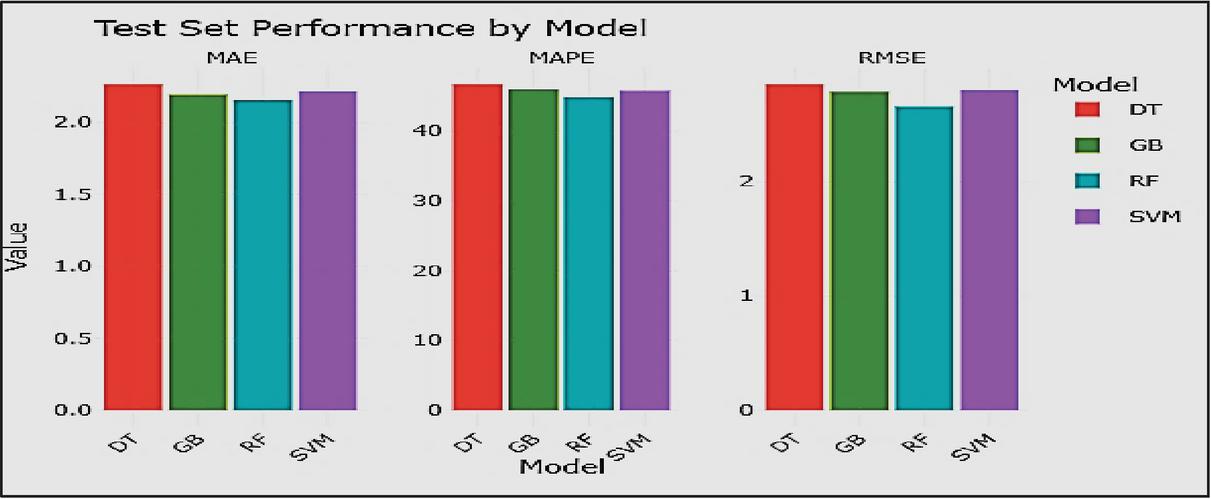
Figure 6 Model performance summary.
The model stability and 10-fold cross-validation was used to evaluate model stability across various data subsets. Random Forest (green) and Support Vector Machine (purple) had the tightest RMSE distributions, indicating consistent predictive behavior, while Decision Tree (red) had the widest spread, suggesting variability and less generalizability, and Gradient Boosting (dark green) performed moderately, with acceptable but broader spread, according to the boxplot visualization (Figure 7). These findings further support RF’s applicability for soil data prediction by demonstrating that both Random Forest and Support Vector Machine are accurate and consistent across datasets. The interquartile ranges of the Random Forest and Support Vector Machine models were the narrowest, indicating consistent and trustworthy predictions. Gradient Boosting Machine displayed intermediate stability, whereas Decision Tree shown significant variability. These results highlight the superior accuracy and dependability of Random Forest and Support Vector Machine across data splits.
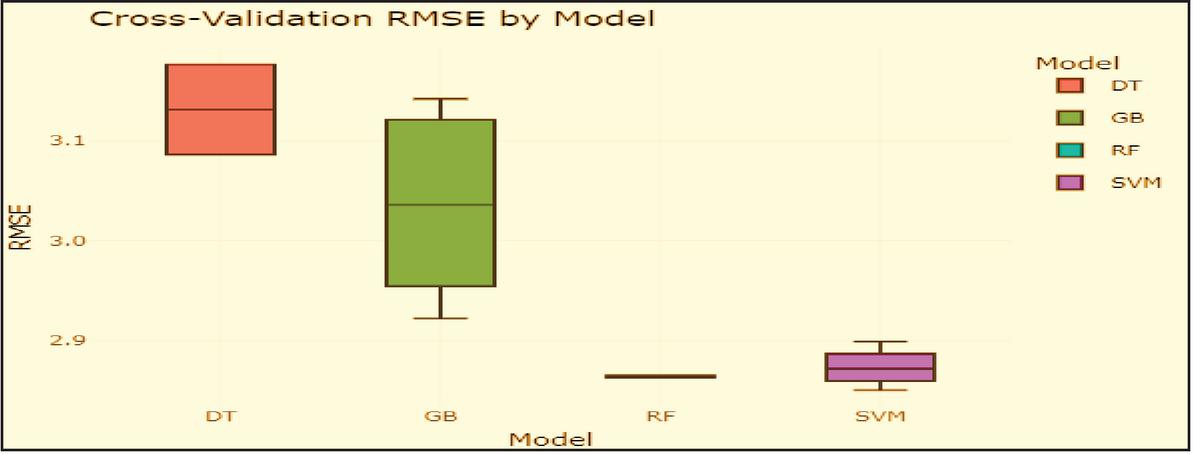
Figure 7 Boxplots of RMSE across cross-validation folds.
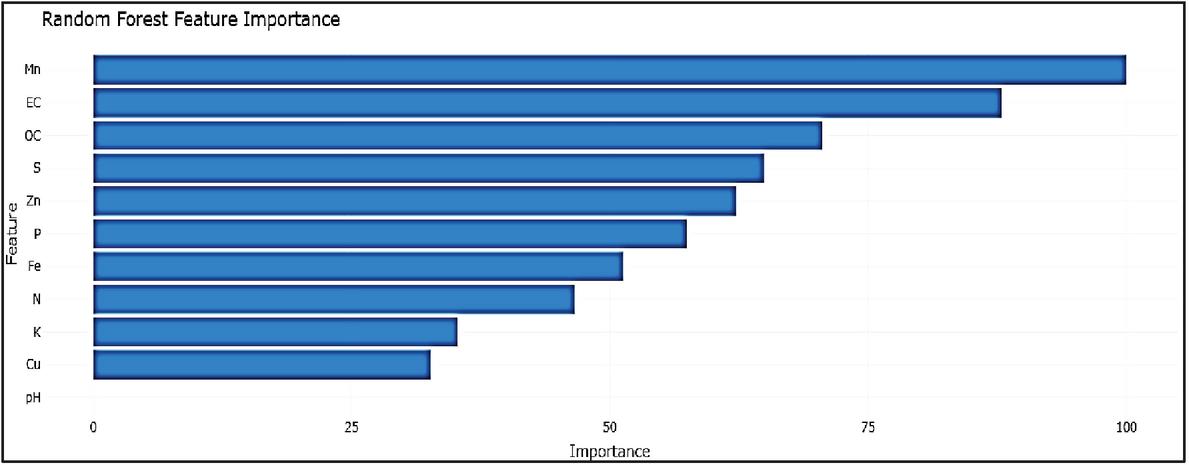
Figure 8 Feature importance plot – random forest (RF).
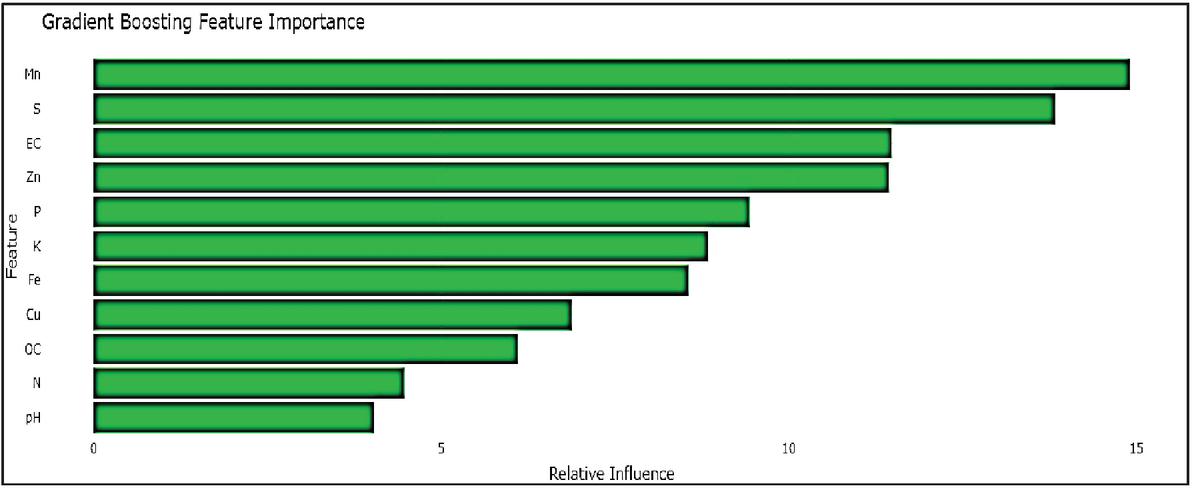
Figure 9 Feature importance plot – gradient boosting machine (GBM).
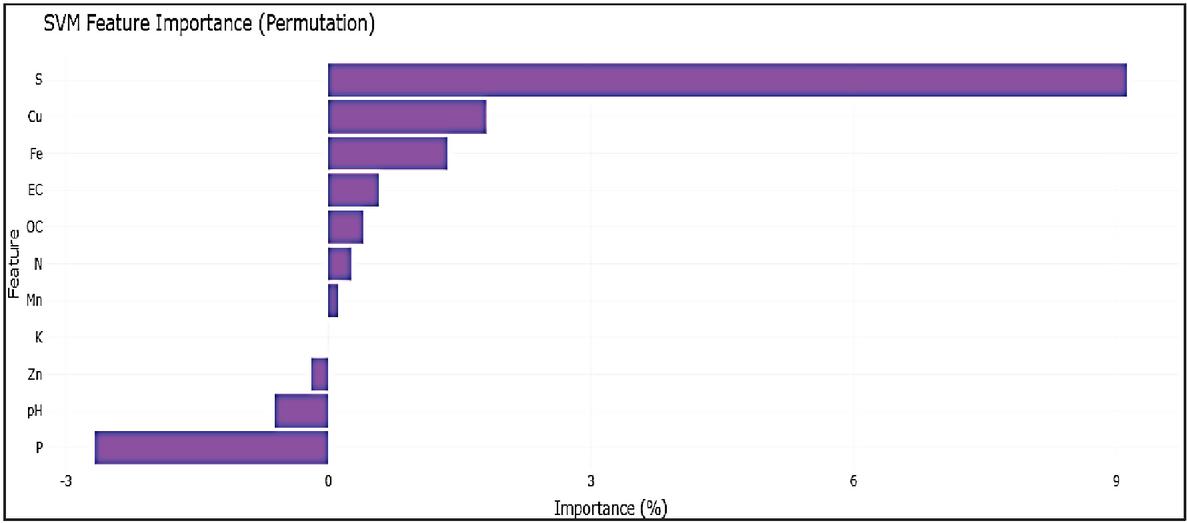
Figure 10 Feature importance plot – support vector machine (SVM).
Careful examination of the feature importance plots (Figures 8–11) shows that the contribution of Soil nutrients was interpreted differently by the ML approaches in relation to wheat yield. The Random Forest (RF) model (Figure 8) clearly reveals that Mn is the most important predictor, followed by EC, S, Zn, and least Affected PH with a smooth and well-distributed importance gradient; This is in good agreement with agronomic studies that highlight the critical impact of the micronutrients on wheat productivity. This consistent and biologically meaningful ranking reflects RF’s ability to handle multicollinearity and capture non-linear relationships through ensemble averaging, resulting in stable and generalizable predictions On the other hand, the Gradient Boosting Machine (Figure 9) also has high ranks for Mn and S, but a wider and less coherent range of weights, suggesting moderate variance and slightly reduced interpretability. The Support Vector Machine model (Figure 10) though it acknowledges the environmental variable S as influential, but failed to capture the importance of Mn and Zn, and even assigned negative weights (refers specifically to negative coefficients obtained under the linear kernel, indicating an inverse association between those features and wheat production) to pH and P – highlighting model instability and reduced generalization performance under the chosen kernel. By the same token, the weight of some characteristics (P and Fe, etc.) estimated by the Decision Tree model (Figure 11) is excessive, which perhaps reflects the phenomenon of overfitting by a classifier without ensemble averaging. These irregularities reduce interpretability and raise concerns about generalizability. The effectiveness of Random Forest is not only reflected in its lowest error metrics (RMSE 2.6570, MAE 2.1578, MAPE 44.87%) but also in its capacity to prioritize agronomically relevant variables. Among all models, only Random Forest maintained a statistically coherent feature ranking aligned with agronomic expectations, confirming its robustness and suitability for yield prediction in the respective three districts of Jammu region.
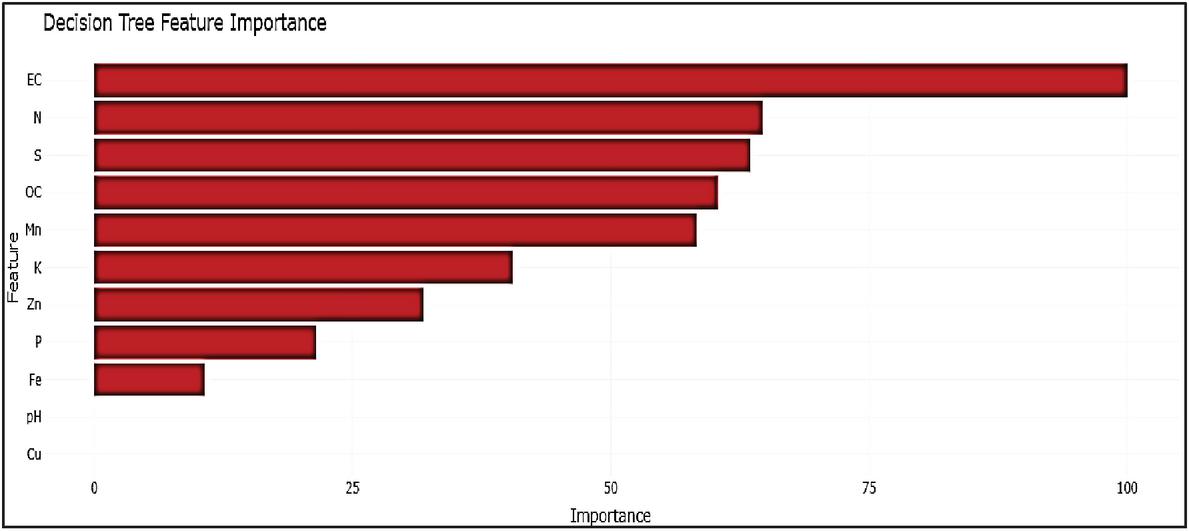
Figure 11 Feature importance plot – decision tree (DT).
4 Discussion
The comparative evaluation of four machine learning models – Random Forest (RF), Gradient Boosting Machine (GBM), Support Vector Machine (SVM), and Decision Tree (DT) – provided clear insights into the predictive value of soil nutrients for wheat yield forecasting. Among these, Random Forest (RF) demonstrated consistently strong performance, which is expected due to its ability to handle nonlinear interactions and complex variable relationships commonly observed in soil datasets. The reason for this better performance was that RF can represent non-linear interactions and use ensemble averaging to reduce overfitting. Moreover, interpretability is improved by its integrated feature importance metrics, which are an essential component of agronomic decision-making.
The feature selection process, utilizing both embedded and wrapper methods, highlighted sulfur (S), manganese (Mn), zinc (Zn), and electrical conductivity (EC) as the most influential soil parameters. This result is agronomically coherent, as these micronutrients are essential for various physiological processes in wheat. For instance, manganese plays a critical role in chlorophyll synthesis and photosynthetic activity (Sharma et al., 2021), while zinc is important for enzyme activation and protein synthesis (Singh and Prasad, 2020). Sulfur is indispensable for amino acid biosynthesis, and its deficiency is increasingly recognized in Indian soils due to reduced organic matter content.
The model performance trends across the ML algorithms also offered important diagnostic insights. While Support Vector Machine achieved competitive results, its sensitivity to kernel tuning and lack of reliable feature attribution limited its practical applicability. In this study, the Support Vector Machine (SVM) model was implemented using a linear kernel to allow coefficient-based feature importance interpretation. GBM performed moderately well but displayed greater variability across cross-validation folds. The Decision Tree model, although interpretable, suffered from overfitting and lower generalizability, as indicated by its higher RMSE and wider prediction error spread. The stability of the RF and Support Vector Machine models during 10-fold cross-validation, which indicates that the chosen features generalize well across various data subsets, is another strength of the work. But Decision Tree and Gradient Boosting Machine showed more variation, highlighting the need for strong cross-validation in agronomic modeling at the regional level.
These findings also align with other Indian studies that employed Random Forest for soil nutrient modeling. For instance, Kumar et al. (2022) reported similar dominance of Mn, S, and Zn as predictors of wheat productivity. The agreement across these studies strengthens the evidence base for including micronutrient-focused strategies in fertilizer recommendations. These results underscore the importance of soil heterogeneity, as the identified key features can directly inform site-specific nutrient management practices. Such insights are valuable for farmers and policymakers by enabling targeted fertilizer recommendations, improving resource efficiency, and ultimately supporting more sustainable wheat production in variable soil conditions.
Despite the positive outcomes, limitations remain. In order to increase the forecast accuracy, the model did not include variables related to climate, management, or varietals. Furthermore, the existing dataset could not account for yield variability brought on by dynamic pests, irrigation availability, and temporal weather variables. Future research should think about using climate indices and remote sensing to model yields more comprehensively. It is important to note that machine learning approaches complement, but do not replace, traditional field experimentation, which remains essential for validating and contextualizing model-driven insights.
5 Conclusion
This study demonstrates the efficacy of advanced machine learning techniques, particularly Random Forest, in modeling wheat yield based solely on soil nutrient parameters across the Jammu region. Among the evaluated models, Random Forest model provided the most accurate wheat yield predictions, with RMSE 2.6570, MAE 2.1578, and MAPE 44.87%. The feature selection analysis identified ten key soil nutrient predictors, among which sulfur (S), manganese (Mn), zinc (Zn), and electrical conductivity (EC) consistently showed strong influence on yield. These results emphasize the importance of soil nutrient management and highlight the effectiveness of combining feature selection with machine learning for soil-based yield estimation.
These findings have important implications for precision agriculture and site-specific nutrient management. Enhancing productivity and sustainability in nutrient-deficient areas may be possible by incorporating such ML-driven insights into fertilizer advice systems and extension services, which could allow for more effective and customized input utilization.
Future studies should concentrate on broadening the model’s scope by adding factors related to climate, management, and remote sensing in order to increase generalizability. Real-time soil and yield monitoring via IoT and GIS integration may also help operationalize the results for wider application.
Limitations: This study relied solely on soil nutrient data and did not incorporate climatic variables, crop management practices, or varietal differences, which also influence yield. Additionally, the analysis was based on a single cropping season, limiting temporal generalizability.
Despite these limitations, the study provides a robust soil-driven modeling framework and demonstrates the value of integrating feature selection techniques with ML algorithms to support precision farming. Future research should incorporate multi-year datasets, weather indicators, and remote sensing–based variables to further enhance prediction accuracy and regional applicability.
Declarations
(a) Funding: Not applicable
(b) Conflict of Interest: No conflict of interest.
(c) Availability of data and Material: Department of Agriculture, Jammu & Kashmir’s Soil Testing Laboratory, Directorate of Agriculture, Talab Tillo, Jammu (under Model Village Programme 2019–2020).
(d) Code availability: R software open accessible (http://cran.us.r-project.org). The analysis utilized the following R packages: caret, randomForest, gbm, e1071, rpart, ggplot2, dplyr, tidyverse.
(e) Ethics approval: Not applicable
(f) Authors Contributions: Afshan Tabassum has worked on the idea and carried all the analysis made the first draft while Manish sharma, Bupesh Kumar, Sudhakar Dwivedi, L.M. Gupta, Sanjay Guleria, has rechecked all the analysis and set the paper for submission.
(g) Consent to participate: Not applicable
(h) Consent for publication: Applicable
References
Breiman, L. (2001). Random forests. Machine Learning, 45(1), 5–32. https://doi.org/10.1023/A:1010933404324.
Chlingaryan, A., Sukkarieh, S., and Whelan, B. (2018). Machine learning approaches for crop yield prediction and nitrogen status estimation in precision agriculture: A review. Computers and Electronics in Agriculture, 151, 61–69. https://doi.org/10.1016/j.compag.2018.05.012.
Department of Agriculture, Jammu. (2025). Annual Agricultural Report 2025 – Jammu Division. Directorate of Agriculture, Jammu & Kashmir.
Everingham, Y., Sexton, J., Skocaj, D., and Inman-Bamber, G. (2016). Accurate prediction of sugarcane yield using a random forest algorithm. Agronomy for Sustainable Development, 36(2), 27. https://doi.org/10.1007/s13593-016-0354-z.
Fageria, N. K., Baligar, V. C., and Clark, R. B. (2002). Micronutrients in crop production. Advances in Agronomy, 77, 185–268. https://doi.org/10.1016/S0065-2113(02)77015-6.
Friedman, J. H. (2001). Greedy function approximation: A gradient boosting machine. Annals of Statistics, 29(5), 1189–1232. https://doi.org/10.1214/aos/1013203451.
Government of India. (2025). Agricultural Statistics at a Glance 2025. Ministry of Agriculture and Farmers Welfare. https://agricoop.nic.in.
Gonzalez-Sanchez, A., Frausto-Solis, J., and Ojeda-Bustamante, W. (2014). Predictive ability of machine learning methods for massive crop yield prediction. Spanish Journal of Agricultural Research, 12(2), 313–328. https://doi.org/10.5424/sjar/2014122-4690.
Gupta, V., Sharma, A., and Chauhan, R. (2022). Ensemble learning models for soil fertility and yield forecasting. Journal of Soil Science and Plant Nutrition, 22(4), 2571–2584.
Guyon, I., Weston, J., Barnhill, S., and Vapnik, V. (2002). Gene selection for cancer classification using SVMs. Machine Learning, 46(1), 389–422. https://doi.org/10.1023/A:1012487302797.
Guyon, I., and Elisseeff, A. (2003). An introduction to variable and feature selection. Journal of Machine Learning Research, 3, 1157–1182. http://www.jmlr.org/papers/volume3/guyon03a/guyon03a.pdf.
Khaki, S., and Wang, L. (2019). Crop yield prediction using deep neural networks. Frontiers in Plant Science, 10, 621. https://doi.org/10.3389/fpls.2019.00621.
Khaki, S., Wang, L., and Archontoulis, S. V. (2020). A CNN-RNN framework for crop yield prediction. Frontiers in Plant Science, 11, 1759. https://doi.org/10.3389/fpls.2020.01759.
Kumar, S., and Bhatia, H. (2021). Integration of soil and climatic variables for machine learning-based yield estimation. Precision Agriculture, 22(5), 1342–1360.
Kruseman, G., Borman, G., Nusser, C., Markovic, M., and Balkovic, J. (2025). What do we know about the future of wheat? FAO–AGRIS.
Kumar, R., Singh, S. K., and Pathak, R. (2022). Predictive modeling of wheat yield using Random Forest and soil nutrient data. Indian Journal of Agricultural Sciences, 92(6), 772–778.
Lamorski, K., Pachepsky, Y. A., Sławiński, C., and Walczak, R. T. (2008). Using support vector machines to develop pedotransfer functions for water retention of soils in Poland. Soil Science Society of America Journal, 72(5), 1243–1247.
LeCun, Y., Bengio, Y., and Hinton, G. (2015). Deep learning. Nature, 521(7553), 436–444.
Lundberg, S. M., Erion, G. G., and Lee, S.-I. (2018). Consistent individualized feature attribution for tree ensembles. arXiv preprint arXiv:1802.03888. https://arxiv.org/abs/1802.03888.
Merdun, H., Çnar, Ö., Meral, R., and Apan, M. (2006). Comparison of artificial neural network and regression pedotransfer functions for prediction of soil water retention and saturated hydraulic conductivity. Soil and Tillage Research, 90(1–2), 108–116.
Misra, R. K., Singh, A., and Sharma, V. (2016). Prediction of wheat yield using decision tree algorithms under different fertilization regimes. Journal of Agronomy, 15(2), 58–64.
Misra, P., and Srivastava, A. K. (2021). Soil fertility-based wheat yield prediction using feature selection and machine learning. Journal of the Indian Society of Soil Science, 69(1), 44–51.
Raza, M. M., Qureshi, W. S., and Khan, A. (2022). Feature optimization for wheat yield estimation using machine learning and remote sensing. Computers and Electronics in Agriculture, 198, 107048. https://doi.org/10.1016/j.compag.2022.107048.
Quinlan, J. R. (1986). Induction of decision trees. Machine Learning, 1(1), 81–106. https://doi.org/10.1007/BF0011625.
Raza, M., Qureshi, W., and Afzal, A. (2024). Hybrid feature selection techniques for improving crop yield prediction. Agricultural Systems, 219, 103894.
Singh, R., Mehta, P., and Kapoor, A. (2023). Machine learning approaches for soil nutrient-based yield prediction. Computers and Electronics in Agriculture, 204, 107596.
Singh, H., and Prasad, R. (2020). Micronutrient management for sustainable wheat productivity in semi-arid soils of India. Journal of Plant Nutrition, 43(12), 1805–1816.
Sharma, A., Chauhan, R., and Mehta, V. (2021). Role of manganese nutrition in improving wheat yield and quality in Indo-Gangetic Plains. Indian Journal of Agronomy, 66(3), 289–295.
Sundararajan, M., and Najmi, A. (2019). The many Shapley values for model explanation. arXiv preprint arXiv:1908.08474. https://arxiv.org/abs/1908.08474.
Tao, F., Xiao, D., Zhang, S., Zhang, Z., and Rötter, R. P. (2017). Wheat yield benefited from increases in minimum temperature in the Huang-Huai-Hai Plain of China in the past three decades. Agricultural and Forest Meteorology, 239, 1–14. https://doi.org/10.1016/j.agrformet.2017.02.033.
Vapnik, V. (1995). The Nature of Statistical Learning Theory. Springer. https://doi.org/10.1007/978-1-4757-2440-0.
Xu, X., Gao, P., Zhu, X., Guo, W., Ding, J., Li, C., and Wu, X. (2019). Design of an integrated climatic assessment indicator (ICAI) for wheat production: A case study in Jiangsu Province, China. Ecological Indicators, 101, 943–953.
Biographies

Afshan Tabassum is presently pursuing Ph.D. in Statistics at the Division of Statistics and Computer Sciences, Faculty of Basic Sciences, Sher-e-Kashmir University of Agricultural Sciences and Technology of Jammu (SKUAST-Jammu), J&K, India. She completed her B.Sc. from Sher-e-Kashmir University of Agricultural Sciences and Technology of Kashmir (SKUAST-Kashmir) and obtained her M.Sc. in Statistics from Sher-e-Kashmir University of Agricultural Sciences and Technology of Jammu (SKUAST-Jammu). Her research interests include statistical modeling, machine learning, and data analysis in agriculture. Her doctoral research is focused on “Machine Learning Methods and Feature Selection Techniques for Estimation of Wheat Production of Jammu Region.” Her work emphasizes the application of advanced statistical and machine learning techniques to improve prediction accuracy and identify key factors influencing wheat production.

Manish Sharma is working as Professor and Head in the Division of Statistics and Computer Sciences, Faculty of Basic Sciences, Sher-e-Kashmir University of Agricultural Sciences and Technology of Jammu (SKUAST-Jammu), J&K, India. He obtained his M.Sc. degree as a Gold Medalist and received fellowships during his M.Sc. program, including the IDP-NAHEP Fellowship and the Eurostat Fellowship. Dr. Sharma has more than 25 years of experience in teaching, research, and academic administration. His area of specialization is Sampling and Statistical Modeling. He has presented several research papers in national and international conferences, delivered numerous lectures and invited talks, and has also organized training programs and conferences. He has guided several M.Sc. and Ph.D. students as Major Advisor and has been actively involved in various administrative responsibilities at SKUAST-Jammu. Dr. Sharma also serves as a reviewer and executive member of statistics journals and has undertaken international academic visits to the University of Dodoma, Tanzania, and the University of Calabria, Italy.

Bupesh Kumar is working as Professor in the Division of Plant Breeding and Genetics, Faculty of Agriculture, Sher-e-Kashmir University of Agricultural Sciences and Technology of Jammu (SKUAST-Jammu), Chatha, J&K, India. He has more than 16 years of professional experience in teaching, research, and extension since June 2007. Dr. Kumar specializes in Cereal Breeding, and his research interests focus on the genetic enhancement of cereal crops through conventional and biotechnological approaches. He has published more than 55 research papers in referred journals and has been actively involved in several research projects as Co-Principal Investigator, including projects on molecular analysis of Basmati rice germplasm purity and evaluation of high-yielding farmer varieties in the Jammu region. He has guided postgraduate and doctoral students and has actively contributed to teaching several core courses in genetics and plant breeding. His research contributions include association with the development of cereal crop varieties, evaluation of rice hybrids, breeder seed production, and participation in national varietal trials. Dr. Kumar has also been actively involved in extension and capacity-building activities, promoting awareness on Intellectual Property Rights in Agriculture and disseminating improved agricultural technologies to farmers and field functionaries. In recognition of his academic and research contributions, he was conferred with the Excellence in Research/Teaching Award by the Indian Society of Genetics, Biotechnology Research and Development, Agra in 2020.

Sudhakar Dwivedi is working as Associate Professor in the Division of Agricultural Economics and Agribusiness Management, Faculty of Agriculture, Sher-e-Kashmir University of Agricultural Sciences and Technology of Jammu (SKUAST-Jammu), Chatha, J&K, India, and is presently serving as Director, Student Welfare at the university. He completed his B.Sc. (Ag.) and M.Sc. (Ag.) in Agricultural Economics from Agra University, Uttar Pradesh, securing first division, and obtained his Ph.D. in Agricultural Economics from Dr. B. R. Ambedkar University, Agra. Dr. Dwivedi has extensive experience in teaching, research, and academic administration, with long experience in postgraduate and undergraduate teaching. He has guided several postgraduate and doctoral students and has also served as a member of various research advisory committees. His research interests focus on agricultural economics, resource use efficiency, crop economics, and agricultural marketing. He has worked as Principal Investigator and Co-Principal Investigator in several externally funded and university research projects related to agricultural development, cropping patterns, and marketing management. He has also delivered radio talks on agricultural economics and farmer-related issues and has actively participated in extension activities. Dr. Dwivedi also contributes to academic publishing as Editor-in-Chief of Agro-Economist: An International Journal and as a member of editorial boards of reputed journals. In recognition of his academic and research contributions, he has received several honours including the Eminent Scientist Award, Scientist of the Year Award, and fellowships from ICSSR and Dr. B. R. Ambedkar University.

Lalit Mohan Gupta is working as Professor and Head in the Division of Forest Products and Utilization at Sher-e-Kashmir University of Agricultural Sciences and Technology of Jammu (SKUAST-Jammu), J&K, India. He holds a Ph.D. and has around 20 years of teaching and research experience. His areas of specialization include medicinal and aromatic plants and forest products utilization. Dr. Gupta has been actively involved in teaching several undergraduate and postgraduate courses related to forestry, plantation crops, medicinal and aromatic plants, seed technology, and post-harvest technology. He has contributed significantly to research with around 35 publications in national and international journals, along with book chapters, manuals, and extension publications. He has also handled several research projects as Principal Investigator and Co-Principal Investigator, funded by agencies such as the National Medicinal Plants Board, New Delhi. Dr. Gupta is actively associated with various professional bodies and is a life member of several scientific societies, including the Indian Society of Agroforestry, Medicinal and Aromatic Plant Association of India, Indian Ecological Society, SIDAVES, and the Society of Community Mobilization for Sustainable Development.

Sanjay Guleria is working as Professor and Former Head in the Division of Biochemistry and Dean, Faculty of Basic Sciences at the Sher-e-Kashmir University of Agricultural Sciences and Technology of Jammu (SKUAST-Jammu), Chatha, J&K, India. He completed his B.Sc. (Chemistry Honours) from H.P. University, Shimla, securing third rank, and obtained his M.Sc. degree as a Gold Medalist with merit scholarships. He also qualified the National Eligibility Test (NET) conducted by ICAR. Dr. Guleria has more than 24 years of teaching and research experience. His research specialization includes isolation and characterization of bioactive molecules from medicinal plants, green synthesis of nanoparticles, nano-encapsulation, biotransformation of plant extracts, and metabolic engineering of microbes for useful compounds. He has received several prestigious recognitions including the DST Young Scientist Award and the CREST Award of the Department of Biotechnology, Government of India. He has authored 10 books/book chapters/manuals, handled research projects as Principal Investigator, and serves as a reviewer for several reputed international journals. He has also worked as a Visiting Research Scientist at Rensselaer Polytechnic Institute, USA, and as a Visiting Professor at the University of Melbourne, Australia. In addition, he has held administrative responsibilities including In-charge of the Counselling and Placement Cell and HR Executive Officer at the Career Development Center, SKUAST-Jammu.
Journal of Reliability and Statistical Studies, Vol. 19, Issue 1 (2026), 215–240
doi: 10.13052/jrss0974-8024.19110
© 2026 River Publishers