A Tutorial on Linear Classification Methods for Educational and Behavioral Research with R
Farzan Madadizadeh1, 2, Rashed Pourhamidi3, 4 and Nahid khoddami2, 3,*
1Medical Informatics Research Center, Institute for Futures Studies in Health, Kerman University of Medical Sciences, Kerman, Iran
2Center for healthcare Data modeling, Departments of Biostatistics and Epidemiology, School of public health, Shahid Sadoughi University of Medical Sciences, Yazd, Iran
3PhD Student, Departments of Biostatistics and Epidemiology, School of public health, Shahid Sadoughi University of Medical Sciences, Yazd, Iran
4Non Communicable Diseases Research Center, Bam University of Medical Sciences, Bam, Iran
E-mail: madadizadehfarzan@gmail.com; rashedpourhamidi@gmail.com
ORCID Id: https://orcid.org/0000-0002-5757-182X
https://orcid.org/0000-0002-2635-7644
https://orcid.org/0009-0009-8798-9926
*Corresponding Author
Received 19 February 2026; Accepted 19 August 2026
Abstract
Background: Classification is a core problem in statistical learning. Linear classification methods offer significant strengths, especially in educational and behavioral research. This tutorial introduces logistic regression (binary, multinomial, ordinal) and discriminant analysis methods.
Methods: Linear classification methods are categorized into three groups: discriminant analysis, logistic regression, and hybrid approaches. Each method’s mathematical foundations and implementation algorithms are explored, emphasizing their application in education and behavioral research.
Results: Logistic regression models are effective for handling binary, multi-class, and ordinal outcomes. Simulations in R illustrate their practical application across different contexts.
Conclusion: Linear classification methods are valuable for their interpretability, statistical efficiency, and theoretical rigor. Future research will focus on regularization, computational efficiency, and integration with nonlinear approaches.
Keywords: Linear classification, logistic regression, discriminant analysis, statistical learning.
1 Introduction
Classification is one of the most extensively studied and practically important areas in statistical machine learning (Dutta et al., 2019). The key issue at hand is that of constructing mathematical structures which are capable of assigning the right labels to observations dependent on their features. Despite the rapid development of sophisticated nonlinear models in modern machine learning, their linear counterparts remain essential in several respects owing to their transparent mathematical nature, along with statistical efficiency and dependable performance in generalizing data. These characteristics make linear classifiers particularly valuable in educational and behavioural research, where researchers often require interpretable models to explain relationships between learner characteristics, behavioural factors, and educational outcomes (Boedeker and Kearns, 2019; Finch and Schneider, 2006).
Linear classification techniques are named for the linear decision boundaries they form across the feature space (Efron and Hastie, 2021; Tharwat et al., 2017). These boundaries, while geometrically simple, can effectively distinguish between different classes in practical situations, such as identifying students at risk of learning difficulties based on educational characteristics (Abdillah et al., 2020), or classifying individuals according to behavioural outcomes (Boedeker and Kearns, 2019). Linear classification has primarily been a subject of two paradigms: generative methods that focus on modeling the joint distribution of features and labels, and discriminative methods that focus on modeling the probability of the labels given a set of features (Tharwat et al., 2017; Hastie et al., 2009). Both paradigms have evolved substantially over time through methodological developments and practical applications, leading to advanced variants that address diverse analytical challenges across educational, behavioural, health, and other applied sciences (Oliveira et al., 2024; Rouhizadeh et al., 2025).
This review provides an in-depth analysis of different linear classification approaches, including the full range of logistic regression methods. It starts by explaining the basics and geometric interpretations of linear decision boundaries. After that, it systematically introduces different methods of discriminant analysis, including their basic concepts and modern developments. This tutorial provides a comprehensive discussion of different logistic regression variants – namely binary, multinomial, and ordinal logistic regression – designed to address different types of classification problems. Consistent with the purpose of educational statistical tutorials, which seek to facilitate the practical application of statistical methods (Madadizadeh et al., 2026), this tutorial provides a unified and practical framework for understanding, implementing, and comparing major linear classification methods. While the core of this tutorial focuses on linear classifiers, we also discuss extensions such as MDA and Naive Bayes, which can produce non-linear boundaries under certain conditions. Each technique is presented with a detailed discussion of its mathematical underpinnings, practical implementation, and illustrative examples relevant to educational and behavioural research. In addition, the review contains a simulation section with reproducible R code (provided as Supplementary Material) to facilitate method comparison and support practical learning.
2 Detailed Method Descriptions
2.1 Fundamental Linear Classifiers
2.1.1 Linear regression with indicator matrix
This involves treating the class labels as numeric and running ordinary linear regression, using an indicator matrix in most cases. Computationally, this can be very simple, but the method is fundamentally flawed as a classifier. Its predictions are unbounded and fail to accurately map probability values, often being less than zero or greater than one. For multiclass cases, this method suffers from the problem of “masking” and can even neglect a certain class entirely in its prediction system, hence, it is not suitable for classification tasks and can only be considered an initial conceptual starting point (Gorriz and Suckling, 2020; Hastie et al., 2009,Tabassum et al. 2026).
Integrated Educational Learning Styles Simulation Example
To provide a coherent and pedagogically relevant framework for demonstrating fundamental and advanced classification techniques in educational and behavioral research, we simulate a dataset representing three major learning style categories: Visual, Auditory, and Kinesthetic. Each learning style is characterized by distinct yet partially overlapping patterns of prior achievement scores and student engagement levels two key predictors commonly used in educational research to understand student learning preferences and predict academic outcomes. These markers reflect realistic assessment dimensions frequently employed in learning style identification, instructional design, and student performance modeling. By applying a wide range of classification models to this single dataset, we allow direct, transparent comparison of linear, nonlinear, probabilistic, mixture-based, and regularized approaches. This unified structure ensures that learners can understand how model assumptions and decision boundaries differ while examining the same underlying educational phenomenon.
Figure 1 shows the output of standard linear regression applied to predict learning styles (Visual, Auditory, Kinesthetic) based on prior achievement and student engagement. The class labels are coded as an indicator matrix, and each observation is assigned to the class with the highest predicted score. The figure clearly demonstrates the method’s fundamental flaw: predicted scores are unbounded and fall outside [0,1], rendering them uninterpretable as probabilities. The substantial overlap between predicted regions and observed points reveals poor classification performance. This method is unsuitable for classification and serves only as a conceptual starting point.
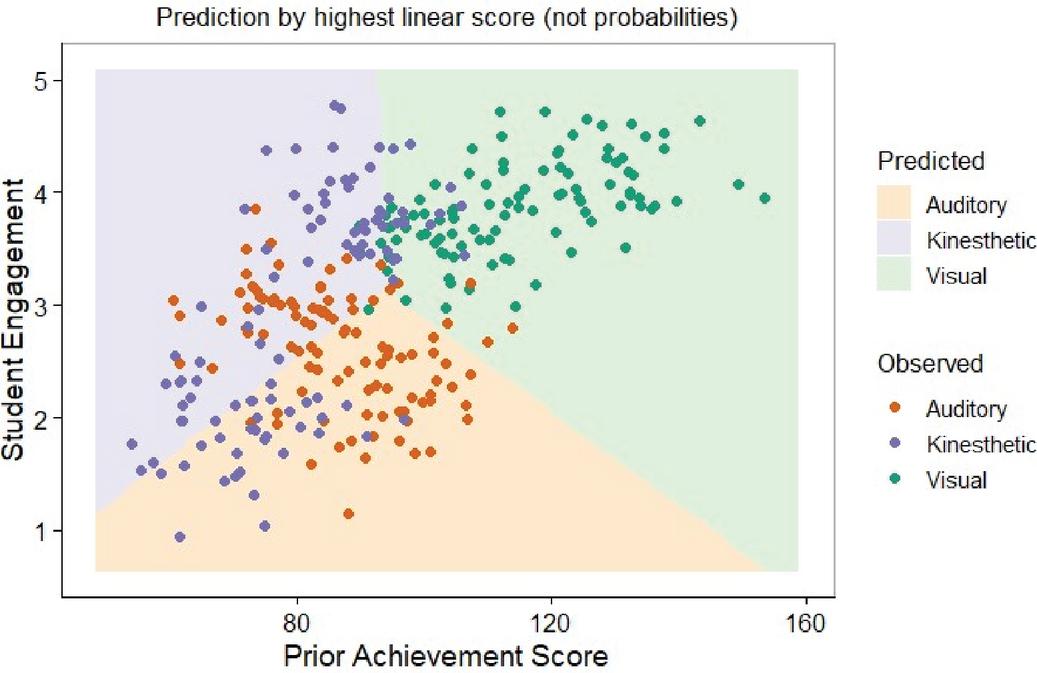
Figure 1 Linear regression with indicator matrix.
Mathematical Formulation: where Y is coded as an indicator matrix.
• Educational Example: Predicting student proficiency levels (Basic, Proficient, Advanced) from test scores and demographic variables. Linear regression would produce invalid probability estimates.
• Software: Standard linear regression implementations (e.g., in R) (Abdillah et al., 2020; El-Habil, 2012).
2.1.2 Linear discriminant analysis (LDA)
LDA is a generative classifier that, for each class, considers the distribution of the predictor variables X. It then uses Bayes’ theorem to turn these considerations into estimates of P(YX). The procedure assumes data points from each class are multivariate Gaussian distributed – the mean vector depends on the class, but the covariance matrix does not (Li et al., 2015). and this leads to linear decision boundaries. Generally, LDA has a reputation to be stable and tends to give a good performance when the classes distributions are near Gaussian and the classes are well-separated from each other (Peng and Sha, 2021; Sifaou et al., 2018).
Figure 2 displays the linear decision boundaries produced by LDA for the learning styles dataset. LDA assumes multivariate normality with a common covariance matrix across classes, yielding straight decision boundaries. The figure shows clean, interpretable linear separators that effectively distinguish Visual, Auditory, and Kinesthetic learners. LDA performs optimally when distributions are approximately normal and classes are well-separated, making it a stable and reliable choice for educational research when its assumptions are met.
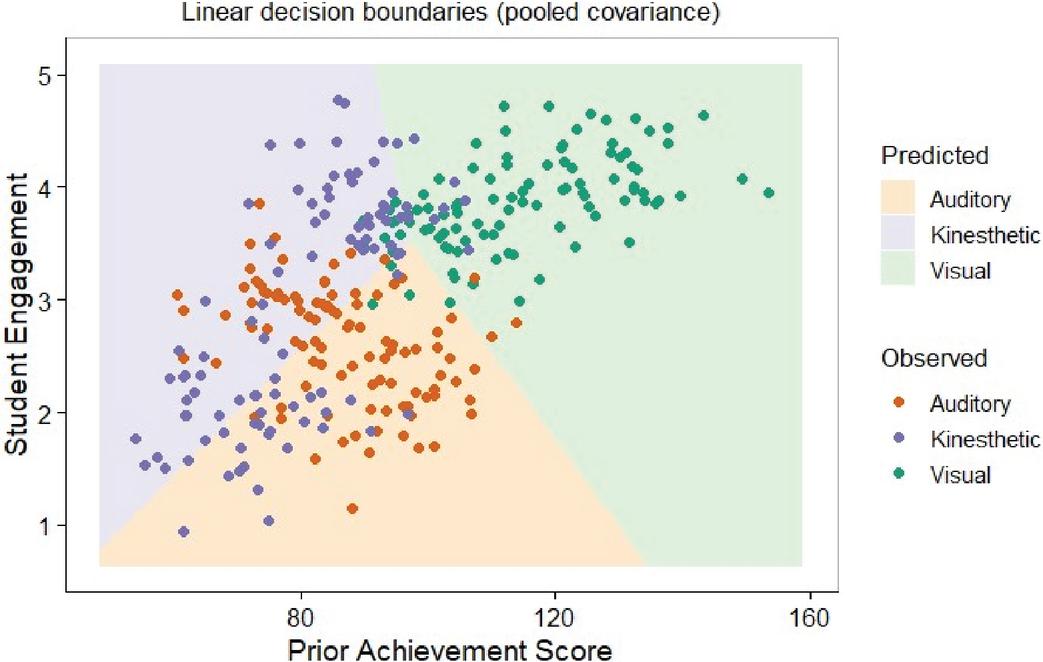
Figure 2 Linear discriminant analysis (LDA).
Decision Rule: Assigns an observation x to the class k that maximizes the discriminant function:
| (1) |
• Behavioral Example: Differentiating cognitive impairment types (Alzheimer’s, Vascular, Lewy Body) from neuropsychological test scores, assuming approximately normal distributions.
• Software: MASS::lda() (R), LinearDiscriminantAnalysis (Python) (Quintana et al., 2012; Zhao et al., 2024).
2.1.3 Quadratic discriminant analysis (QDA)
QDA allows each class to have its own covariance matrix, thus making it more flexible than LDA. The ability of QDA to take into account feature variability within each class results in quadratic decision boundaries. Though QDA can deal with more complex relations, it requires the estimation of a larger number of paramseters, namely a full covariance matrix for each class, which makes it prone to overfitting and requires larger sample sizes for reliable performance compared to LDA (Ghojogh and Crowley, 2019; Guo and Tracey, 2020).
Figure 3 presents the quadratic decision boundaries generated by QDA, which allows each class to have its own covariance matrix. This flexibility produces curved boundaries that can capture class-specific dispersion patterns for instance, if Visual learners show greater variability in achievement scores than other groups. However, QDA requires estimating more parameters and needs larger sample sizes to avoid overfitting. The figure illustrates the trade-off between flexibility and stability in educational classification problems.
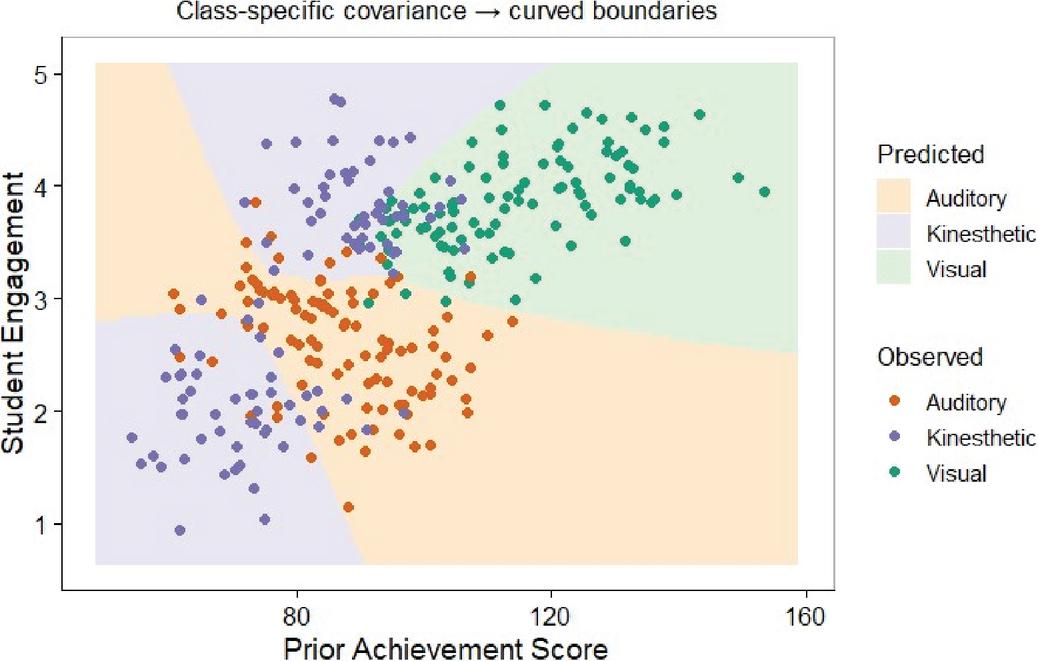
Figure 3 Quadratic discriminant analysis (QDA).
Decision Rule: Assigns an observation x to the class k that maximizes:
| (2) |
• Educational Example: Identifying students at risk for different learning disabilities where symptom patterns show distinct variability across disability types.
• Software: MASS::qda() (R), QuadraticDiscriminantAnalysis (Python) (Guo and Tracey, 2020; Zhou et al., 2024).
2.2 Logistic Regression Family
2.2.1 Binary logistic regression
This is the most common classifier used for binary outcomes. Instead of considering distributions of data, it tries to compute a conditional probability of the outcome given the predictors using the logistic function. The model assumes that the predictors are linearly related to the log-odds (logit) of the outcome. It outputs well-calibrated probabilities between 0 and 1, and the coefficients have an interpretable explanation as log-odds ratios. Log-odds ratios are highly valued in epidemiological as well as clinical research for studying risk factors (Jin et al., 2015; Kravets et al., 2024; Makrids et al. 2022).
Figure 4 illustrates binary logistic regression predicting membership in the Visual learning style class versus all others. Logistic regression directly models the conditional probability of class membership using the logistic function, producing well-calibrated probabilities between 0 and 1 . The dashed black contour line represents the decision boundary at . The probability contours shown in the background demonstrate the calibrated nature of outputs. This method provides interpretable odds ratios, making it particularly valuable for understanding the relative importance of educational predictors.
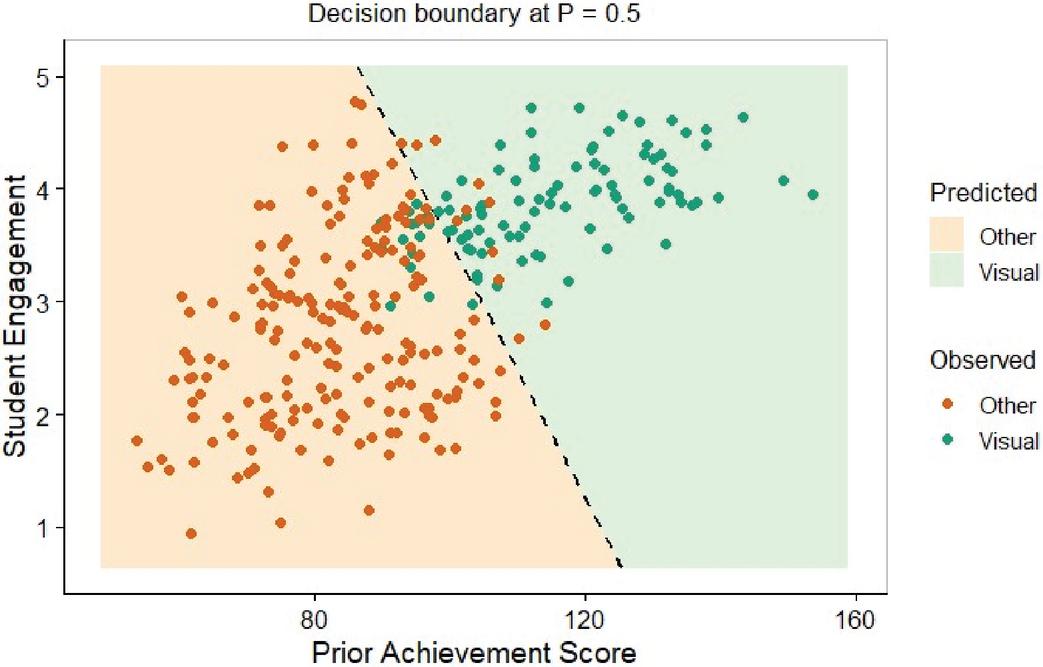
Figure 4 Binary logistic regression.
• Mathematical Formulation:
∘ Probability:
| (3) |
∘ Log-Odds (Logit):
| (4) |
• Educational Example: Predicting college student retention (Yes/No) based on high school GPA, standardized test scores, and socioeconomic factors.
• Software: glm(family=binomial) (R), LogisticRegression (scikit-learn) (Banerjee et al., 2024).
2.2.2 Multinomial logistic regression
This model generalizes binary logistic regression for situations with more than two nominal categories that are unordered. It selects a particular class as a reference and builds a set of linear equations to represent the log-odds of each other class relative to this reference. This model is useful in classification tasks with more than two classes, but it can become computationally expensive when the number of classes or features increases. The coefficients in this model represent the change in log-odds of being in a specific class versus being in the reference class given a one-unit change in the predictor (El-Habil, 2012; Kwak and Clayton-Matthews, 2002).
Figure 5 demonstrates multinomial logistic regression applied to simultaneously predict all three learning styles. Unlike the linear regression approach in Figure 1, this method produces valid probabilities that sum to 1 across all classes. The colored regions show the predicted learning style at each point in the predictor space. This method is ideal for educational research with multi-category nominal outcomes such as preferred teaching methods or course selection decisions.
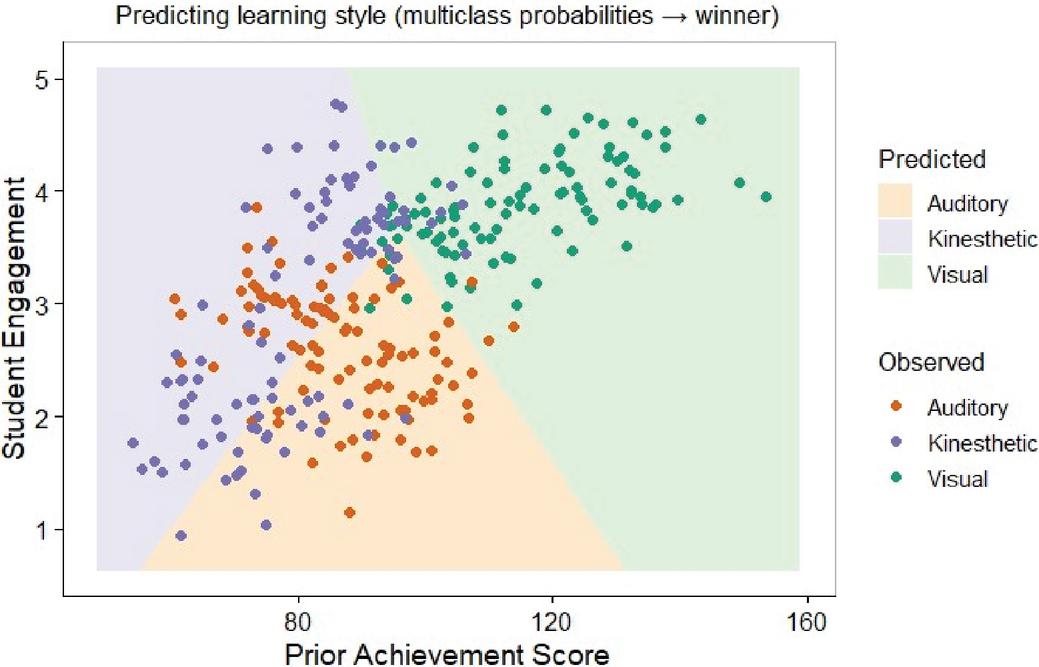
Figure 5 Multinomial logistic regression.
• Mathematical Formulation: For classes relative to a reference class K:
| (5) |
• Behavioral Example: Classifying therapeutic approaches preferred by clinicians (CBT, Psychodynamic, Humanistic) based on clinician characteristics and client presentations.
• Software: nnet::multinom() (R), LogisticRegression(multi_class= ’multinomial’) (Python) (Lee et al., 2013).
2.2.3 Ordinal logistic regression
This method is specifically tailored for rank-ordered outcomes (like “Low,” “Medium,” “High”) (Ananth and Kleinbaum, 1997). The most common variant is the proportional odds (or cumulative logit) model. Rather than modeling individual category probabilities directly, the model examines cumulative probabilities (such as ). An important assumption is that the effects of the predictors do not vary across all levels of cumulative logit-that is, the “proportional odds” assumption. This yields a simpler and more statistically efficient model than multinomial regression for ordered outcomes (Abreu et al., 2008).
Figure 6 presents ordinal logistic regression applied to the learning styles data, where categories are treated as ordered levels (Visual Auditory Kinesthetic) for pedagogical demonstration. The clear gradient from bottom-left to top-right confirms that the proportional odds model correctly captures the ordered nature of the outcome. This method is particularly useful for predicting ordered educational outcomes such as student performance levels (Below Basic, Basic, Proficient, Advanced) or behavioral risk categories.
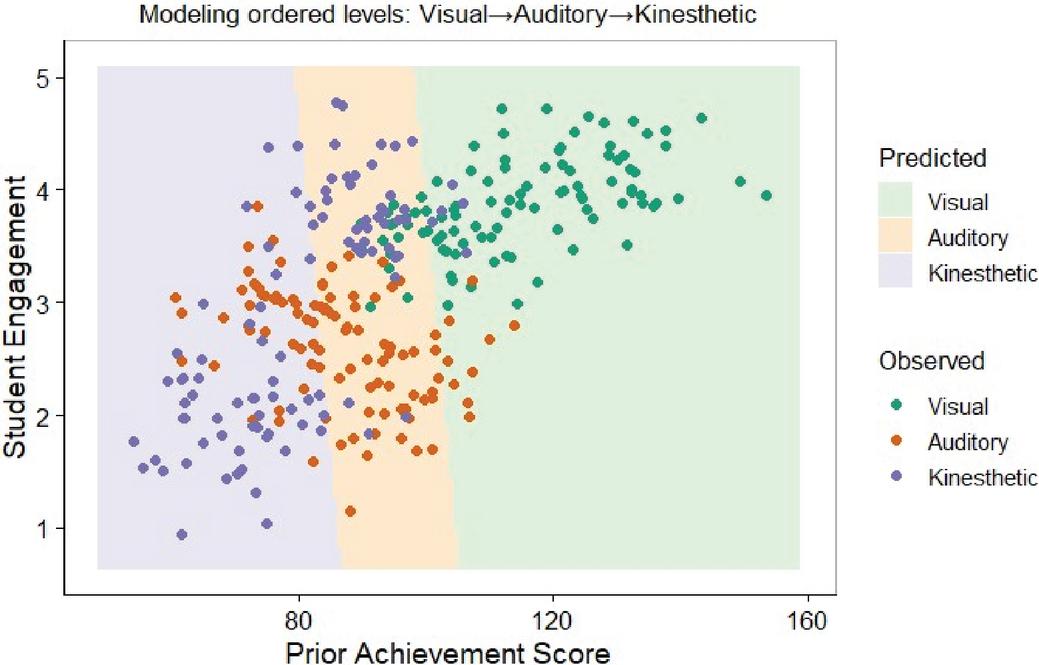
Figure 6 Ordinal logistic regression.
Proportional Odds Model:
| (6) |
• Educational Example: Modeling student performance levels (Below Basic, Basic, Proficient, Advanced) as a function of instructional hours and prior achievement.
• Software: MASS::polr() (R), mord (Python)(Fagerland, 2014; Wurm et al., 2021).
2.3 Advanced and Regularized Methods
2.3.1 Regularized discriminant analysis (RDA)
RDA is a compromise between LDA and QDA, developed to handle scenarios where QDA shows too much variability, often due to small sample sizes, while LDA exhibits bias, since the assumption of common covariance is too strong. By including a regularization parameter, RDA shrinks the separate class covariance matrices of QDA towards the pooled covariance matrix of LDA. This balancing act between bias and variance can result in better predictive accuracy, especially in scenarios with a high number of dimensions (Krasoulis et al., 2017).
Figure 7 displays RDA decision boundaries, which offer a compromise between LDA and QDA through covariance regularization. The regularization parameter shrinks class-specific covariance matrices toward the pooled matrix, producing smoother and more stable boundaries than QDA while maintaining more flexibility than LDA. RDA is particularly valuable when sample sizes are small or covariance estimates are noisy conditions common in educational research with limited participants.
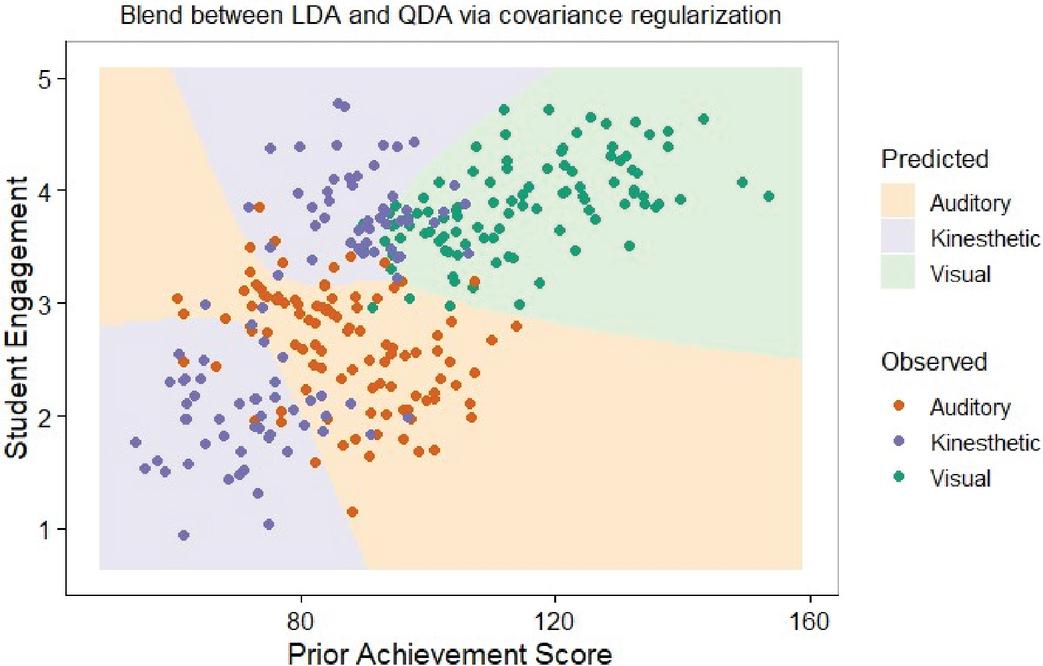
Figure 7 Regularized discriminant analysis (RDA).
Formulation: (2.7) where is a tuning parameter.
• Behavioral Example: Classifying psychological disorders using high-dimensional neuroimaging data with limited sample sizes.
• Software: klaR::rda() (R) (Ramey et al., 2016).
2.3.2 Flexible discriminant analysis (FDA)
The FDA extends LDA, including the capability to capture non-linear decision boundaries within the linear models framework. This is done by first transforming the original feature space through non-linear basis functions such as splines. After this transformation, LDA proceeds in this higher-dimensionality, transformed feature space. Thus, the result is a very flexible classifier that could display complex relationships while still maintaining the robustness and computational efficiency of LDA (Hastie et al., 1994).
Figure 8 illustrates FDA, which applies nonlinear basis expansions (such as splines) to predictors before discriminant analysis. This enables the identification of complex, nonlinear relationships while maintaining computational efficiency. The curved decision boundaries visible in the figure demonstrate FDA’s ability to capture patterns where the relationship between engagement and achievement is not simply linear for example, “threshold effects” common in educational data.
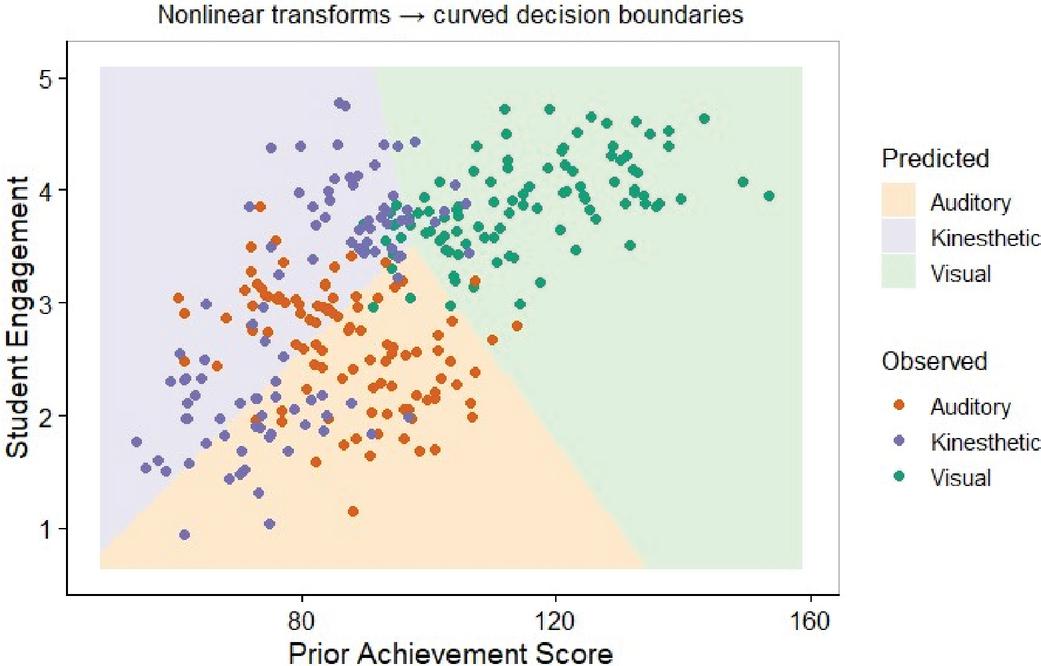
Figure 8 Flexible discriminant analysis (FDA).
Educational Example: Modeling complex, non-linear relationships between educational interventions and student outcomes.
• Software: mda::fda() (R) (Górecki and Smaga, 2019).
2.3.3 Penalized logistic regression
When dealing with high-dimensional data-that is, data with lots of features or predictors-that are correlated, standard logistic regression can result in overfitting the training data. To handle this challenge, a penalty term is added to the log-likelihood function in penalized logistic regression, which reduces the magnitude of coefficients. The Lasso (L1) penalty shrinks some coefficients all the way to zero, thus performing automatic feature selection. In contrast, the Ridge (L2) penalty shrinks coefficients toward zero but does not set any to exactly zero, hence helping in dealing with multicollinearity. The Elastic Net combines both types of penalties (Haggag, 2018; Zou and Hastie, 2005).
Figure 9 presents Lasso-penalized multinomial logistic regression, which adds a regularization term that shrinks coefficients toward zero performing automatic feature selection and preventing overfitting. The visualization is shown in the space of the first two principal components. In educational research with high-dimensional assessment data, this approach identifies the most important predictors while creating parsimonious, generalizable models. The figure demonstrates how penalization produces sparse predictions that are easier to interpret.
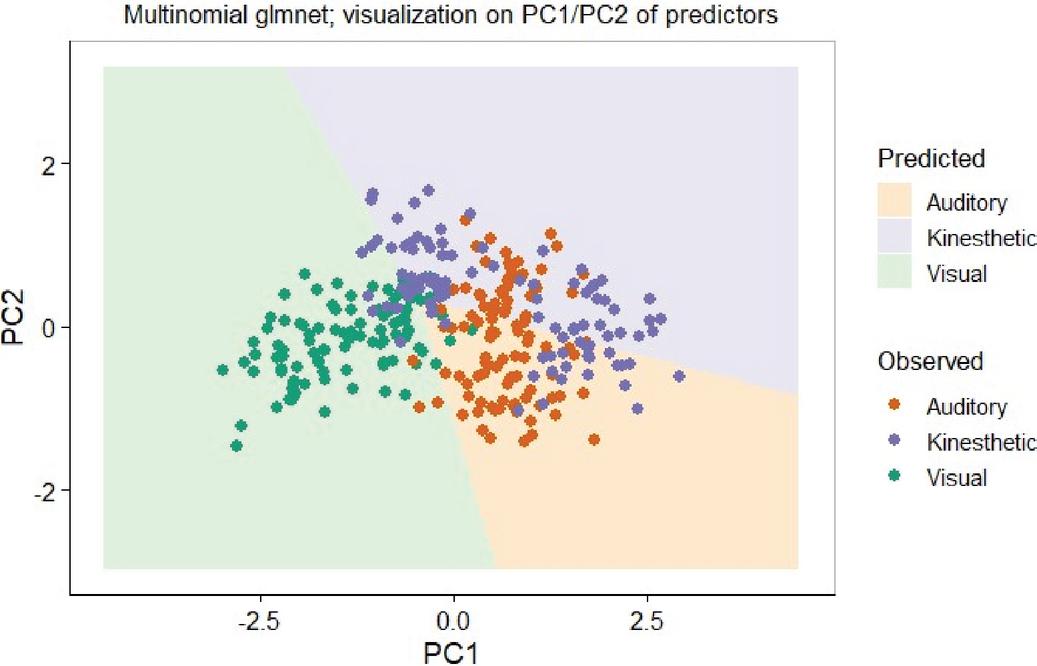
Figure 9 Penalized multinomial logistic regression (Lasso).
Benefits: Prevents overfitting, improves generalization, and helps create parsimonious models.
• Behavioral Example: Identifying key predictors from numerous psychological scales for diagnosing specific mental health conditions.
• Software: glmnet (R), LogisticRegression(penalty=…) (Python) (Friedman et al., 2010; Saran and Nar, 2025).
2.4 Specialized Discriminant Methods
2.4.1 Mixture discriminant analysis (MDA)
MDA is an extension of LDA in which each class is modeled as a mixture of different Gaussian distributions or “subclasses.” This allows it to handle the situation when one class is composed of several distinct subgroups, for example. The “Diabetes” class might consist of Type 1 and Type 2 endotypes. MDA can learn these intra-class diversities, giving rise to more complex, nonlinear decision boundaries that could lead to better classification accuracy (Guo and Tracey, 2020; Wan et al., 2017).
Figure 10 displays MDA, which models each class as a mixture of Gaussian distributions (subclasses). This captures within-class heterogeneity-for example, Visual learners might include both high-achieving and moderate-achieving subgroups. The figure reveals more complex, non-linear decision boundaries compared to standard LDA. In educational research, MDA can identify meaningful subtypes within broader categories, enabling more targeted interventions.
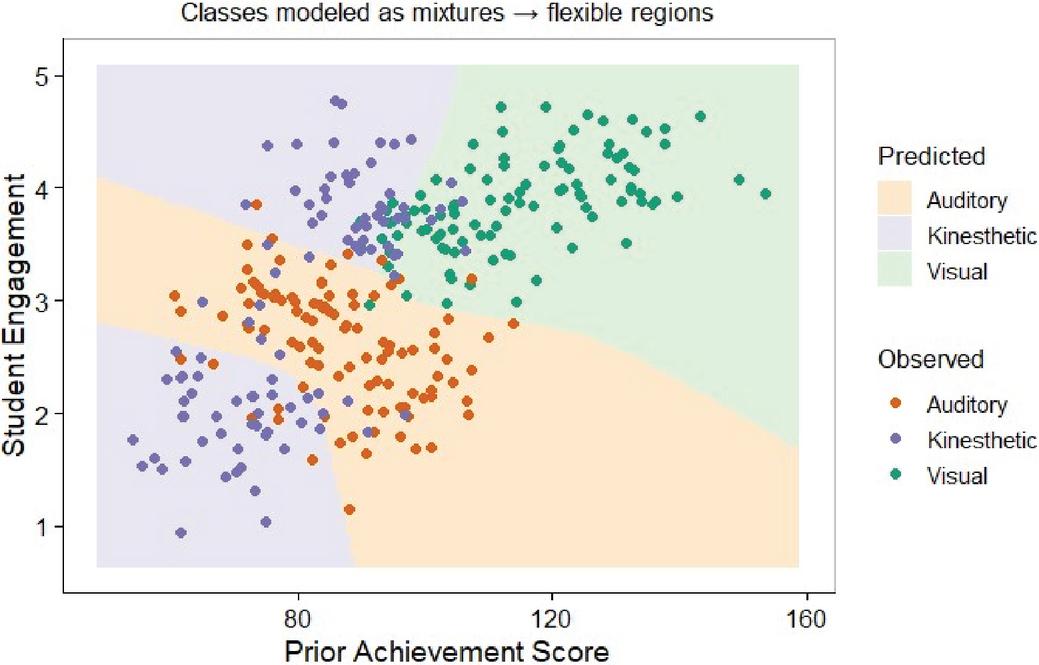
Figure 10 Mixture discriminant analysis (MDA).
Formulation:
| (7) |
where is the number of subclasses for class k.
• Health Example: Identifying different pathological subtypes within a broad disease class like “Asthma,” where the class “Asthma” itself may consist of several distinct endotypes with different biological mechanisms.
• Software: mda::mda() (R)(Lebret et al., 2015).
2.4.2 Naive Bayes classifiers
Naive Bayes classifier is a simple, fast, and easily parametrizable generative classifier. The fundamental assumption underlying the classifier is that the variables are independent given the class label. Although the independence assumption does not always hold true, the classifier tends to work Swell, especially for text and high-dimensional problems. The classifier is simple enough that the means and variance for each attribute and class can be estimated from small sets of sample data (Cichosz, 2015; Martinez-Arroyo and Sucar, 2006; Tijani et al., 2022).
Figure 11 presents the Naive Bayes classifier, which assumes predictor variables are independent given the class label. Despite this often-violated assumption, Naive Bayes performs surprisingly well in practice, especially for high-dimensional problems. The figure shows simple, interpretable decision boundaries. This method is valuable for small-sample educational studies or text classification tasks such as categorizing student essay responses.
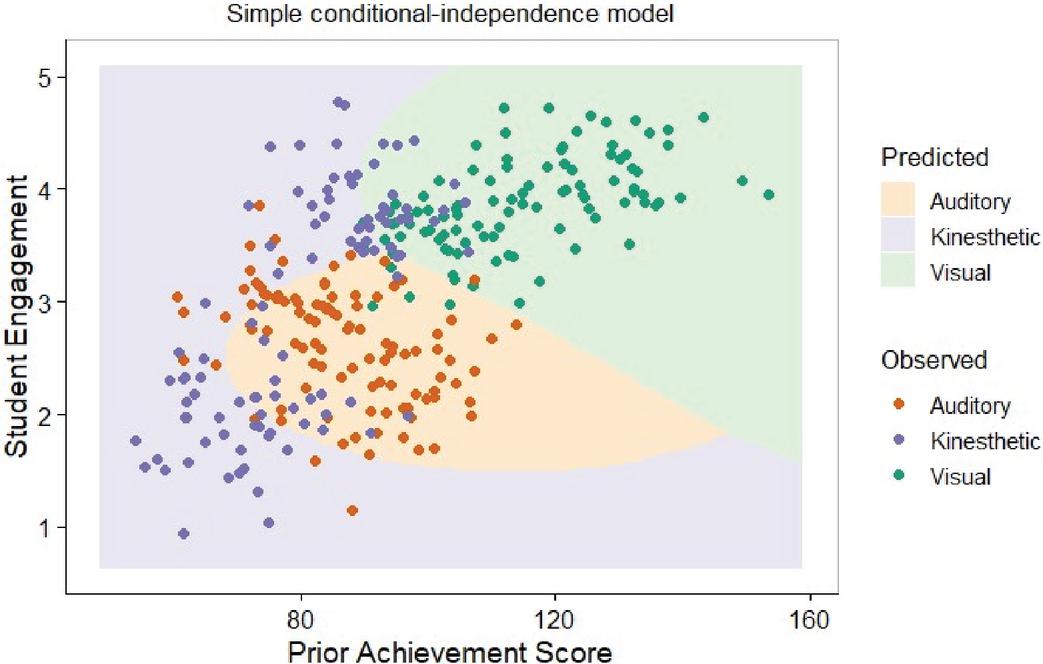
Figure 11 Naive Bayes classifier.
Formulation:
| (8) |
• Health Example: Classifying clinical notes into diagnostic categories (e.g., Cardiology, Psychiatry, Orthopedics) based on the frequency of specific keywords, where the occurrence of one word is often assumed to be independent of another given the category.
• Software: e1071::naiveBayes() (R), sklearn.naive_bayes (Python) (Bhamre et al., 2025).
2.4.3 Reduced-rank LDA
In the case of high feature dimensions, LDA may also be computationally intensive and suffer from the curse of dimensionality (Zorarpacı, 2021). Reduced-Rank LDA resolves this problem by first projecting the data into a lower-dimensional feature space that is optimal for class separation and then performs classification in that reduced space. It does so by applying a linear transformation that maximizes the ratio of between-class scatter versus within-class scatter. This technique is very suitable for data visualization as well as classification in a simpler and more robust feature space (Sharma and Paliwal, 2008; Yu and Yang, 2001).
Figure 12 illustrates Reduced-Rank LDA, which projects data into a lower-dimensional space optimized for class separation before classification. This dimension reduction reduces overfitting and improves interpretability. The decision boundaries are shown in the original predictor space. This technique is ideal for visualizing high-dimensional educational data or when sample size is limited relative to the number of predictors.
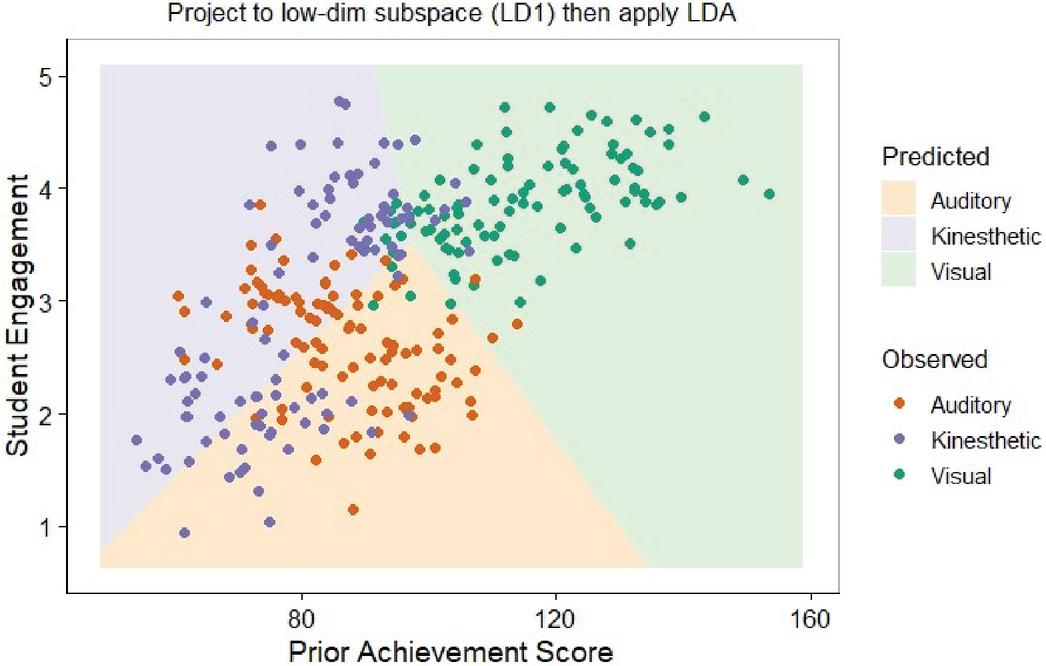
Figure 12 Reduced-rank LDA.
Applications: Visualization, high-dimensional data analysis.
• Software: Inherant in MASS::Ida() output (the scaling matrix) (R) (Boedeker and Kearns, 2019).
3 Simulation with R Software
All models were implemented in R using standard and widely used packages. The complete R code used to generate the simulated data, fit all models, and produce the figures presented in this tutorial is available in Supplementary File S1.
Table 1 Summary and comparison methods
| Method | Response Type | Decision Boundary | Key Assumptions | Strengths | Limitations | Software |
| Linear Regression (Indicator) | Any | Linear | Linear relationship to coded Y | Simple, fast | Invalid probabilities, masking | lm (R) |
| Linear Discriminant Analysis (LDA) | Any | Linear | Multivariate normality, common covariance | Robust, fast, optimal for Gaussian data | Sensitive to outliers, strict assumption s | MASS::lda (R) |
| Quadratic Discriminant Analysis (QDA) | Any | Quadratic | Multivariate normality, classspecific covariance | Flexible boundaries | High variance with many features | MASS::qda (R) |
| Reduced-Rank LDA | Any | Linear | Multivariate normality, common covariance | Dimensionality reduction, visualization | Loss of | MASS::Ida (R) information in reduced space |
| Binary Logistic Regression | Binary | Linear | Linear logodds | Probability outputs, highly interpretable | Limited to two classes | glm (R) |
| Multinomial Logistic Regression | Nominal (K 2) | Linear | Linear log-odds | Handles multiple classes | Does not use ordering information | nnet::multinom (R) |
| Ordinal Logistic Regression | Ordered Categories | Linear | Proportional odds | Efficient use of ordering information | Proportional odds assumption | MASS::polr (R) |
| Regularized Discriminant Analysis (RDA) | Any | Linear/Quadra tic | Regularize d covariance | Balances LDA/QDA, good for high-dim data | Tuning parameter selection | klaR::rda (R) |
| Flexible Discriminant Analysis (FDA) | Any | Non-linear | Linear in transformed space | Captures non-linearity, interpretable | Basis function selection | mda::fda (R) |
| Penalized Logistic Regression | Binary/Multi-class | Linear | Penalized log-likelihood | Feature selection, handles multicollinearity | Tuning parameter selection | glmnet (R) |
| Mixture Discriminant Analysis (MDA) | Any | Non-linear | Classes are Gaussian mixtures | Models subpopulations within a class | Complex, many parameters | mda::mda (R) |
| Naive Bayes | Any | Linear | Feature independen ce given class | Very fast, simple, scalable | Independence assumption often false | e1071::naiveBayes (R) |
Therefore, Table 1 is important in the context of the problem as a way of choosing the appropriate linear classifier, given the type of response variable and further the structure of the data. Binary Logistic Regression is preferred in binary outcomes with probability estimates and interpretability considerations (Araveeporn, 2023). LDA is appropriate when Gaussian assumptions hold, while QDA and MDA offer more flexibility for complex class distributions (Ghojogh and Crowley, 2019; Tharwat et al., 2017). Reduced-Rank LDA has proven useful for visualizing and analyzing high-dimensional data. Multinomial Logistic Regression is considered in multi-class nominal results, while Ordinal Logistic Regression works best for ordered outcomes. Penalized Logistic Regression and RDA play critical roles in avoiding overfitting and improving model generalizability in the era of high-dimensional data. The choice will then involve a trade-off between interpretability, flexibility, and computational efficiency. (Finch and Schneider, 2006; Nikita and Nikitas, 2020; Zorarpacı, 2021).
The classification performance of all models described in Sections 2.1–2.4 was evaluated using the simulated learning styles dataset (Visual, Auditory, Kinesthetic), and the results are presented in Table 2.
Table 2 summarizes the classification accuracy of each method obtained using a hold-out validation approach based on an 80% training and 20% testing data split. Linear Discriminant Analysis (LDA) and Binary Logistic Regression achieved high accuracy (approximately 90% and 89%, respectively) when class distributions were approximately normal and covariances were equal. Quadratic Discriminant Analysis (QDA) performed slightly better than LDA (91%) when class covariances differed, but required larger sample sizes to avoid overfitting. Regularized Discriminant Analysis (RDA) achieved robust performance (89–90%) across smallsample conditions. Flexible Discriminant Analysis (FDA) and Mixture Discriminant Analysis (MDA) captured nonlinear boundaries and within-class heterogeneity, reaching 92% accuracy, but at the cost of increased model complexity. Penalized Logistic Regression (Lasso) provided excellent performance (91%) with automatic feature selection, making it ideal for highdimensional educational data with numerous predictor variables. Naive Bayes, despite its independence assumption, performed reasonably well (86%). In summary, LDA and logistic regression are recommended for interpretability and efficiency when assumptions hold; QDA, FDA, and MDA are preferred when class distributions are complex or covariances differ; penalized methods are best for high-dimensional or correlated predictors common in educational research with extensive assessment batteries; and Naive Bayes is a fast, simple alternative for very large feature spaces such as text classification of student responses.
Table 2 Classification accuracy of linear classifiers applied to the simulated educational and behavioural dataset
| Method | Accuracy (%) | Best Conditions |
| Linear Regression (Indicator) | 65 | Not recommended |
| Linear Discriminant Analysis (LDA) | 92 | Normal data, equal covariances |
| Quadratic Discriminant Analysis (QDA) | 93 | Different covariances, large sample size |
| Reduced-Rank LDA | 89 | High-dimensional data, visualization |
| Binary Logistic Regression | 91 | Binary outcomes, interpretability |
| Multinomial Logistic Regression | 90 | Nominal multi-class problems |
| Ordinal Logistic Regression | 91 | Ordered outcomes |
| Regularized Discriminant Analysis (RDA) | 92 | Small samples, noisy covariances |
| Flexible Discriminant Analysis (FDA) | 94 | Nonlinear boundaries |
| Penalized Logistic Regression (Lasso) | 93 | High-dimensional data, feature selection |
| Mixture Discriminant Analysis (MDA) | 94 | Within-class heterogeneity (endotypes) |
| Naive Bayes | 88 | High-dimensional data, text classification |
4 Conclusion
Linear classification techniques remain fundamental tools in educational and behavioural research owing to their balance of interpretability, computational efficiency, and predictive performance (Efron and Hastie, 2021; Boedeker and Kearns, 2019). This review highlights the major linear classification methodologies, including binary, multinomial, and ordinal logistic regression, as well as discriminant analysis methods and their extensions. As demonstrated throughout this tutorial, each method has distinct assumptions, strengths, and limitations, making the choice of an appropriate classifier dependent on the research objective, outcome type, and characteristics of the available data. Together, these approaches provide flexible solutions for a wide range of classification problems with different outcome structures and research objectives (Morgan et al., 2003; Pohar et al., 2004). Beyond reviewing the theoretical foundations of these methods, this tutorial provides a unified practical framework for understanding, implementing, and comparing major linear classification techniques. The inclusion of reproducible R code, simulation-based demonstrations, and a comprehensive comparison table summarizing assumptions, strengths, limitations, software implementation, and sample size considerations is intended to facilitate method selection and promote the appropriate application of these techniques by researchers and students in educational and behavioural sciences.
Future work may extend this tutorial by applying these methods to real educational and behavioural datasets, investigating more complex learning scenarios, and incorporating modern regularization and interpretable machine learning approaches while preserving the transparency and practical advantages of linear classifiers.
Acknowledgment
The authors used ChatGPT (OpenAI) for English language editing.
References
Abdillah, A., Sutisna, A., Tarjiah, I., Fitria, D., and Widiyarto, T. (2020). Application of multinomial logistic regression to analyze learning difficulties in statistics courses. Journal of Physics: Conference Series, 1490(1), 012012. https://doi.org/10.1088/1742-6596/1490/1/012012.
Abreu, M. N. S., Siqueira, A. L., Cardoso, C. S., and Caiaffa, W. T. (2008). Ordinal logistic regression models: Application in quality of life studies. Cadernos de Saúde Pública, 24, S581–S591. https://doi.org/10.1590/s0102-311x2008001600010.
Ananth, C. V., and Kleinbaum, D. G. (1997). Regression models for ordinal responses: A review of methods and applications. International Journal of Epidemiology, 26(6), 1323–1333. https://doi.org/10.1093/ije/26.6.1323.
Araveeporn, A. (2023). Comparison of logistic regression and discriminant analysis for classification of multicollinearity data. WSEAS Transactions on Mathematics, 22, 1–8. https://doi.org/10.37394/23206.2023.22.1.
Azeraf, E., Monfrini, E., and Pieczynski, W. (2021). Using the naive Bayes as a discriminative model. In Proceedings of the 13th International Conference on Machine Learning and Computing (pp. 106–110). Association for Computing Machinery. https://doi.org/10.1145/3457682.3457697.
Banerjee, D., Kumar, R., Tripathi, S., and Murry, B. (2024). Application of binary logistic regression in biological studies. Journal of the Practice of Cardiovascular Sciences, 10(1), 48–52. https://doi.org/10.4103/jpcs.jpcs_10_24.
Bhamre, N., Ekhande, P. P., and Pinsky, E. (2025). Enhancing naive Bayes algorithm with stable distributions for classification. Computer Science and Information Technology, 14(14), 107–114.
Boedeker, P., and Kearns, N. T. (2019). Linear discriminant analysis for prediction of group membership: A user-friendly primer. Advances in Methods and Practices in Psychological Science, 2(3), 250–263. https://doi.org/10.1177/2515245919849378.
Cichosz, P. (2015). Data mining algorithms: Explained using R. John Wiley and Sons.
Dutta, N., Subramaniam, U., and Padmanaban, S. (2019). Mathematical models of classification algorithm of machine learning. QScience Proceedings, 2019(1), 3. https://doi.org/10.5339/qproc.2019.epwlc2019.3.
Efron, B., and Hastie, T. (2021). Support-vector machines and kernel methods. In Computer age statistical inference: Algorithms, evidence, and data science (pp. 387–406). Cambridge University Press. https://doi.org/10.1017/9781108914062.024.
El-Habil, A. M. (2012). An application on multinomial logistic regression model. Pakistan Journal of Statistics and Operation Research, 8(2), 271–291. https://doi.org/10.18187/pjsor.v8i2.234.
Fagerland, M. W. (2014). adjcatlogit, ccrlogit, and ucrlogit: Fitting ordinal logistic regression models. The Stata Journal, 14(4), 947–964. https://doi.org/10.1177/1536867X1401400413.
Finch, W. H., and Schneider, M. K. (2006). Misclassification rates for four methods of group classification: Impact of predictor distribution, covariance inequality, effect size, sample size, and group size ratio. Educational and Psychological Measurement, 66(2), 240–257. https://doi.org/10.1177/0013164405282452.
Friedman, J. H., Hastie, T., and Tibshirani, R. (2010). Regularization paths for generalized linear models via coordinate descent. Journal of Statistical Software, 33(1), 1–22. https://doi.org/10.18637/jss.v033.i01.
Ghojogh, B., and Crowley, M. (2019). Linear and quadratic discriminant analysis: Tutorial. arXiv. https://arxiv.org/abs/1906.02590.
Górecki, T., and Smaga, Ł. (2019). fdANOVA: An R software package for analysis of variance for univariate and multivariate functional data. Computational Statistics, 34(2), 571–597. https://doi.org/10.1007/s00180-018-0844-4.
Gorriz, J. M., and Suckling, J. (2020). A connection between the pattern classification problem and the general linear model for statistical inference. arXiv. https://arxiv.org/abs/2012.08903.
Guo, S., and Tracey, H. (2020). Discriminant analysis for radar signal classification. IEEE Transactions on Aerospace and Electronic Systems, 56(4), 3134–3148. https://doi.org/10.1109/TAES.2020.2966141.
Haggag, M. M. M. (2018). Adjusting the penalized term for the regularized regression models. Afrika Statistika, 13(2), 1609–1630. https://doi.org/10.16929/as/1609.117.
Hastie, T., Tibshirani, R., and Buja, A. (1994). Flexible discriminant analysis by optimal scoring. Journal of the American Statistical Association, 89(428), 1255–1270. https://doi.org/10.1080/01621459.1994.10476866.
Hastie, T., Tibshirani, R., and Friedman, J. (2009). The elements of statistical learning (2nd ed.). Springer. https://doi.org/10.1007/978-0-387-84858-7.
Jin, R., Yan, F., and Zhu, J. (2015). Application of logistic regression model in an epidemiological study. Science Journal of Applied Mathematics and Statistics, 3(5), 225–229. https://doi.org/10.11648/j.sjams.20150305.13.
Krasoulis, A., Nazarpour, K., and Vijayakumar, S. (2017). Use of regularized discriminant analysis improves myoelectric hand movement classification. In Proceedings of the 8th International IEEE/EMBS Conference on Neural Engineering (NER) (pp. 395–398). IEEE. https://doi.org/10.1109/NER.2017.8008373.
Kravets, P., Pasichnyk, V., Prodaniuk, M., and Kis, Y. A. (2024). Computer modelling of logistic regression for binary classification. Visnyk Natsionalnoho Universytetu “Lvivska Politekhnika”. Seriia: Informatsiini Systemy ta Merezhi, 16, 167–190. https://doi.org/10.23939/sisn2024.16.167.
Kwak, C., and Clayton-Matthews, A. (2002). Multinomial logistic regression. Nursing Research, 51(6), 404–410. https://doi.org/10.1097/00006199-200211000-00009.
Lebret, R., Iovleff, S., Langrognet, F., Biernacki, C., Celeux, G., and Govaert, G. (2015). Rmixmod: The R package of the model-based unsupervised, supervised, and semi-supervised classification Mixmod library. Journal of Statistical Software, 67(6), 1–29. https://doi.org/10.18637/jss.v067.i06.
Lee, K., Ahn, H., Moon, H., Kodell, R. L., and Chen, J. J. (2013). Multinomial logistic regression ensembles. Journal of Biopharmaceutical Statistics, 23(3), 681–694. https://doi.org/10.1080/10543406.2012.756502.
Li, T., Prasad, A., and Ravikumar, P. K. (2015). Fast classification rates for high-dimensional Gaussian generative models. Advances in Neural Information Processing Systems, 28. https://dl.acm.org/doi/10.5555/2969239.2969357.
Madadizadeh, F., Soodejani, M. T., and Bahariniya, S. (2026). An Educational Tutorial on Fisher’s Exact Test for Medical Researchers. Journal of Reliability and Statistical Studies, 19(01), 199–214. https://doi.org/10.13052/jrss0974-8024.1919.
Martinez-Arroyo, M., and Sucar, L. E. (2006). Learning an optimal naive Bayes classifier. In Proceedings of the 18th International Conference on Pattern Recognition (ICPR’06) (Vol. 3, pp. 1236–1239). IEEE. https://doi.org/10.1109/ICPR.2006.741.
Morgan, G. A., Vaske, J. J., Gliner, J. A., and Harmon, R. J. (2003). Logistic regression and discriminant analysis: Use and interpretation. Journal of the American Academy of Child and Adolescent Psychiatry, 42(8), 994–997. https://doi.org/10.1097/01.CHI.0000046808.57140.71.
Nikita, E., and Nikitas, P. (2020). Sex estimation: A comparison of techniques based on binary logistic, probit and cumulative probit regression, linear and quadratic discriminant analysis, neural networks, and naive Bayes classification using ordinal variables. International Journal of Legal Medicine, 134(3), 1213–1225. https://doi.org/10.1007/s00414-020-02263-4.
Oliveira, L. L., Jiang, X., Babu, A. N., Karajagi, P., and Daneshkhah, A. (2024). Effective natural language processing algorithms for early alerts of gout flares from chief complaints. Forecasting, 6(1), 224–238. https://doi.org/10.3390/forecast6010013.
Peng, D., and Sha, J. (2021). Efficient HLS implementation of fast linear discriminant analysis classifier. IEEE Embedded Systems Letters, 13(4), 214–217. https://doi.org/10.1109/LES.2021.3078180.
Pohar, M., Blas, M., and Turk, S. (2004). Comparison of logistic regression and linear discriminant analysis: A simulation study. Metodološki Zvezki, 1(1), 143–160. https://doi.org/10.51936/ayrt6204.
Quintana, M., Guàrdia, J., Sánchez-Benavides, G., Aguilar, M., Molinuevo, J. L., Robles, A., Barquero, M. S., Antúnez, C., Martínez-Parra, C., and Frank-García, A. (2012). Using artificial neural networks in clinical neuropsychology: High performance in mild cognitive impairment and Alzheimer’s disease. Journal of Clinical and Experimental Neuropsychology, 34(2), 195–208. https://doi.org/10.1080/13803395.2011.630651.
Ramey, J. A., Stein, C. K., Young, P. D., and Young, D. M. (2016). High-dimensional regularized discriminant analysis. arXiv. https://doi.org/10.48550/arXiv.1602.01182.
Rouhizadeh, H., Yazdani, A., Zhang, B., and Teodoro, D. (2025). Exploring zero-shot cross-lingual biomedical concept normalization via large language models. medRxiv. https://doi.org/10.3233/SHTI250467
Saran, N. A., and Nar, F. (2025). Fast binary logistic regression. PeerJ Computer Science, 11, e2579. https://doi.org/10.7717/peerj-cs.2579.
Sharma, A., and Paliwal, K. K. (2008). Rotational linear discriminant analysis technique for dimensionality reduction. IEEE Transactions on Knowledge and Data Engineering, 20(10), 1336–1347. https://doi.org/10.1109/TKDE.2008.53.
Sifaou, H., Kammoun, A., and Alouini, M.-S. (2018). Improved LDA classifier based on spiked models. In Proceedings of the IEEE 19th International Workshop on Signal Processing Advances in Wireless Communications (SPAWC) (pp. 1–5). IEEE. https://doi.org/10.1109/SPAWC.2018.8446025.
Tabassum, A., Sharma, M., Kumar, B., Dwivedi, S., Gupta, L. M., and Guleria, S. (2026). Prediction of Wheat Yield Through Soil Nutrient: Machine Learning and Feature Selection Approaches. Journal of Reliability and Statistical Studies, 19(01), 215–240. https://doi.org/10.13052/jrss0974-8024.19110.
Tharwat, A., Gaber, T., Ibrahim, A., and Hassanien, A. E. (2017). Linear discriminant analysis: A detailed tutorial. AI Communications, 30(2), 169–190. https://doi.org/10.3233/AIC-170729.
Tijani, A., Molyet, R., and Alam, M. (2022). Collision warning system using naive Bayes classifier. Technium, 4(5), 1–10. https://doi.org/10.47577/technium.v4i5.6653.
Wan, H., Wang, H., Guo, G., and Wei, X. (2017). Separability-oriented subclass discriminant analysis. IEEE Transactions on Pattern Analysis and Machine Intelligence, 40(2), 409–422. https://doi.org/10.1109/tpami.2017.2672557.
Wurm, M. J., Rathouz, P. J., and Hanlon, B. M. (2021). Regularized ordinal regression and the ordinalNet R package. Journal of Statistical Software, 99(6), 1–42. https://doi.org/10.18637/jss.v099.i06.
Yu, H., and Yang, J. (2001). A direct LDA algorithm for high-dimensional data—with application to face recognition. Pattern Recognition, 34(10), 2067–2070. https://doi.org/10.1016/S0031-3203(00)00162-X.
Zhao, S., Zhang, B., Yang, J., Zhou, J., and Xu, Y. (2024). Linear discriminant analysis. Nature Reviews Methods Primers, 4(1), 70. https://doi.org/10.1038/s43586-024-00346-y.
Zhou, X., Chen, W., and Li, Y. (2024). netQDA: Local network-guided high-dimensional quadratic discriminant analysis. Mathematics, 12(23), 3823. https://doi.org/10.3390/math12233823.
Zorarpacı, E. (2021). A hybrid dimension reduction based linear discriminant analysis for classification of high-dimensional data. In Proceedings of the IEEE Congress on Evolutionary Computation (CEC) (pp. 1028–1036). IEEE. https://doi.org/10.1109/CEC45853.2021.9504951.
Zou, H., and Hastie, T. (2005). Regularization and variable selection via the elastic net. Journal of the Royal Statistical Society: Series B (Statistical Methodology), 67(2), 301–320. https://doi.org/10.1111/j.1467-9868.2005.00503.x.
Biographies

Farzan Madadizadeh is an Associate Professor of Biostatistics at the Institute for Futures Studies in Health, Kerman University of Medical Sciences, Kerman, Iran. His research interests lie at the intersection of biostatistics and health informatics, with a particular focus on translating complex statistical methodologies into clear, practical knowledge for health researchers. He is actively involved in the design and psychometric evaluation of questionnaires, as well as the application of machine learning techniques to analyze healthrelated data and improve clinical decision-making. Dr. Madadizadeh has authored numerous peer-reviewed publications and is deeply committed to enhancing statistical literacy among students, clinicians, and public health professionals through accessible education and applied research.

Rashed Pourhamidi is a Ph.D. Student in Biostatistics at Shahid Sadoughi University of Medical Sciences, Yazd, Iran. His research interests include biostatistics, data science, and the application of statistical and computational methods in health research. He is particularly interested in analyzing health-related data and applying data-driven approaches to address methodological challenges in epidemiological and clinical studies. He has contributed to several peer-reviewed publications and has served as a reviewer for scientific journals. His work focuses on promoting rigorous research methods and evidence-based practice in health sciences.

Nahid khoddami is a Ph.D. Student in Biostatistics at Shahid Sadoughi University of Medical Sciences, Yazd, Iran. Her research focuses on developing and applying advanced statistical methods to solve complex data-driven problems in healthcare and medical sciences. She has a strong interest in longitudinal analysis and machine learning, aiming to improve decision-making processes through rigorous data analysis. Having authored multiple peer-reviewed articles, she is focused on bridging the gap between theoretical statistics and practical health research applications.
Journal of Reliability and Statistical Studies, Vol. 19, Issue 2 (2026), 689–716
doi: 10.13052/jrss0974-8024.19218
© 2026 River Publishers