An Econometric and Distributional Analysis of Determinants of Educational Delay Inequality
Gaurav Singh*, Vinod Kumar and Arun Kumar
Govind Ballabh Pant University of Agriculture and Technology, Pantnagar, Uttarakhand, India
E-mail: 55409@gbpuat.ac.in, vinod_kumarbcb@yahoo.com, arunkumar.bpm@gbpuat.ac.in
*Corresponding Author
Received 21 April 2026; Accepted 28 July 2026
ABSTRACT
Educational delay is an underexplored dimension of educational inequality, reflecting disparities in the timing and efficiency of academic progression. Using a dataset of 4,244 student observations from a Portuguese higher education institution, this study constructs a normalized Educational Delay Index and assesses its distribution through the Gini coefficient and Lorenz curve. A heteroskedasticity-robust (HC3) Ordinary Least Squares model shows that tuition fee compliance, scholarship holding, gender, and age at enrolment are the leading determinants of delay, with financial variables dominating both the regression and the inequality decomposition. Quantile regression further reveals that financial constraints intensify at higher levels of delay. The findings offer policy-relevant insights for strengthening financial support systems in higher education.
Keywords: Educational delay, educational inequality, delay index, Gini coefficient, Lorenz curve, higher education policy.
1 Introduction
Education is central to human capital formation and economic mobility (Becker, 1964). Despite expanding enrolment worldwide, disparities in educational outcomes persist, and most research on this inequality has focused on access, performance, and completion rates rather than on educational delay the extended time students take to complete their programs relative to the expected timeframe. Delay imposes real costs: it raises debt burdens, postpones labour market entry, and reduces lifetime earnings (Bound, Lovenheim and Turner, 2010; Oreopoulos and Petronijevic, 2013). Academic pathways are shaped jointly by demographic characteristics (age, gender), financial constraints (tuition obligations, scholarship access), and macroeconomic conditions (unemployment, inflation, GDP), yet few studies integrate these dimensions with formal inequality measurement to examine delay as a distinct facet of educational inequality.
This study addresses that gap by constructing a normalized Educational Delay Index, evaluating its distribution using the Gini coefficient and Lorenz curve, and identifying its determinants through robust regression, quantile regression, and Gini-based inequality decomposition. Specifically, the paper contributes by: (i) developing a scale-independent Delay Index comparable across students with different academic workloads; (ii) applying an inequality-measurement framework, borrowed from income-distribution analysis, to quantify disparities in academic progression; (iii) estimating a heteroskedasticity-consistent (HC3) regression model of demographic, financial, and macroeconomic determinants; and (iv) decomposing overall inequality into the contribution of each determinant, and examining heterogeneous effects across the delay distribution via quantile regression. Together, these components provide a distribution-sensitive account of the structural drivers of educational delay and generate policy-relevant insights for improving equity in academic progression.
1.1 Novelty and Positioning of the Study
The novelty of this study lies in three respects. First, it treats the timing and pace of academic progression rather than access or attainment as an independent dimension of educational inequality, a facet that has received little formal attention relative to enrolment and completion. Second, it transplants inequality-measurement tools developed for income distributions the Gini coefficient, Lorenz curve, and regression-based Gini decomposition into the domain of academic delay, an application that remains rare in the education literature (cf. Lesner et al., 2022; Tavares, 2015; Cowell, 2011). Third, it combines OLS, quantile regression, standardized variable-importance analysis, and inequality decomposition within a single coherent empirical pipeline, allowing both average and distributional drivers of delay to be identified within one framework.
Related Literature
The economics-of-education literature has traditionally centred on enrolment, attainment, and completion as indicators of human capital accumulation, building on the foundational humancapital framework (Becker, 1964; Becker and Tomes, 1986). Comparatively little attention has been paid to the pace of academic progression, even though prolonged time-to-degree raises opportunity costs and can depress lifetime earnings (Bound, Lovenheim and Turner, 2010; Oreopoulos and Petronijevic, 2013).
Demographic and socioeconomic characteristics are well documented as shaping educational transitions: age, gender, and family background influence the probability of progressing through schooling levels (Breen and Jonsson, 2005), and students from disadvantaged backgrounds face persistent barriers linked to limited financial resources (Corak, 2013; Chetty et al., 2014). Financial constraints in particular tuition costs, credit access, and financial aid are consistently shown to affect persistence and completion (Dynarski, 2003; Bettinger, 2004), with scholarships and financial aid programs found to reduce delays by easing the financial pressure that otherwise forces students to work or interrupt study (Kane, 2003). Macroeconomic conditions add a further layer: weaker labour markets can lower the opportunity cost of continued study and encourage persistence, while economic instability can simultaneously strain household finances (Bound, Lovenheim and Turner, 2010).
Methodologically, quantile regression has become a standard tool for capturing heterogeneity that mean-based models obscure (Koenker and Bassett, 1978; Koenker, 2005), and inequality-measurement tools such as the Gini coefficient and Lorenz curve widely used in income-distribution analysis have increasingly been applied to educational outcomes (Cowell, 2011), often alongside decomposition techniques that attribute observed disparities to specific explanatory factors (Shorrocks, 1982). Even so, few studies apply this combined toolkit to delay specifically: related work has examined the effect of term-time employment on cognitive and educational outcomes (Lesner et al., 2022) and the role of school management practices in student performance (Tavares, 2015), but the distributional dynamics of delay itself remain comparatively underexplored. The present study builds on this literature by integrating inequality measurement with econometric and quantile-based analysis to study educational delay as a distinct dimension of inequality.
2 Methodology
This study integrates inequality measurement with econometric modelling. A normalized Delay Index is constructed for each student, its distribution is examined via the Gini coefficient and Lorenz curve, and its determinants are estimated using OLS with HC3-robust standard errors, complemented by quantile regression, Gini decomposition, and standard diagnostic checks. All analysis was implemented in Python.
2.1 Data Source and Sample
The analysis uses a publicly available student-level dataset (https://www.kaggle.com/datasets/abdullah0a/student-dropout-analysis-and-prediction-dataset), comprising 4,244 observations. The underlying data were compiled by the Polytechnic Institute of Portalegre, Portugal, and cover students enrolled in 17 undergraduate degree programmes over the academic years 2008/2009 to 2018/2019, merging institutional enrolment records with national macroeconomic indicators. The dataset combines demographic variables (age at enrolment, gender), financial indicators (scholarship status, debtor status, tuition fee payment status), and macroeconomic factors (unemployment rate, inflation rate, GDP) at the level of the individual student.
Unless otherwise noted, gender is coded as 1 male and 0 female, following the coding convention of the source dataset, and scholarship holder, debtor, and tuition fees up to date are each coded as 1 yes and 0 no.
2.2 Construction of the Educational Delay Index
Let denote the total curricular units in which student i is enrolled, and the number successfully completed. The Educational Delay Index is defined as:
with . A value of 0 indicates no delay; values approaching 1 indicate substantial incompletion relative to enrolment. Normalizing by enrolled units makes the index scaleindependent and comparable across students with different course loads, and it serves as the dependent variable throughout the empirical analysis.
This index is grounded in the human-capital view of education as a cumulative investment process (Becker, 1964): the unapproved share of enrolled workload is treated as an empirical counterpart of unrealized human-capital investment. Three properties support its validity as a delay measure: it is bounded and dimensionless, making it comparable across students with heterogeneous course loads; it is defined relative to each student’s own enrolment, isolating the within-student non-completion rate rather than an absolute attainment level; and it aggregates naturally into a population distribution suitable for formal inequality measurement via the Gini coefficient and Lorenz curve.
2.3 Inequality Measurement: Gini Coefficient and Lorenz Curve
Distributional inequality in the Delay Index is quantified using the Gini coefficient, a standard summary measure of dispersion widely used in income-distribution analysis (Cowell, 2011), defined as , where n is the number of students and is the mean Delay Index. G ranges from 0 (perfect equality) to 1 (maximum inequality). The Lorenz curve complements this by plotting the cumulative share of total delay against the cumulative share of students, ordered from lowest to highest delay; deviation from the 45-degree line of equality visualizes the degree of concentration.
2.4 Determinants of Educational Delay: Regression Framework
Determinants of delay are estimated using Ordinary Least Squares (OLS):
where the regressors capture demographic (age, gender), financial (scholarship, debtor status, tuition compliance), and macroeconomic (unemployment, inflation, GDP) influences. Heteroskedasticity is tested with the Breusch-Pagan LM test ( from an auxiliary regression of squared residuals on the regressors); given evidence of heteroskedasticity, HC3-robust standard errors are used throughout, consistent with recent advances in robust-regression estimation (Noor-Ul-Amin et al., 2018). Multicollinearity is assessed via the Variance Inflation Factor, , with VIF 10 treated as indicative of severe collinearity (following standard practice, e.g. Cowell, 2011). Influential observations are screened using Cook’s Distance, with the conventional threshold of 4/n.
2.5 Quantile Regression and Inequality Decomposition
To capture heterogeneity that OLS averages away, quantile regression (Koenker and Bassett, 1978; Koenker, 2005) is estimated at , modelling . To identify the structural sources of the Gini coefficient itself, overall inequality is decomposed following the elasticity-based approach of Shorrocks (1982): , where the elasticity of delay with respect to determinant k is , and its contribution to inequality is . Finally, standardized (z-score) regression coefficients, , are used to rank the relative importance of determinants, with each variable’s percentage contribution given by . Quantile coefficients are estimated by minimizing the asymmetric (pinball) loss function via linear programming, with bootstrap standard errors (200 replications) and the pseudo-R2 fit measure of Koenker and Bassett (1978) reported at each quantile.
2.6 Choice of Estimator: OLS versus Beta Regression and Logit Alternatives
Because the Delay Index is a proportion bounded on [0, 1], beta regression (Ferrari and Cribari-Neto, 2004) and logit-type transformations (Long, 1997) are natural alternative estimators for this setting, and quantile-regression approaches have recently been applied to similarly bounded unit-interval educational outcomes (Korkmaz, Chesneau and Korkmaz, 2022). The linear OLS/HC3 specification is retained as the baseline here because it preserves interpretability of marginal effects in the original units of the Delay Index, is consistent with the linear-elasticity-based Gini decomposition and standardized variable-importance analysis used throughout, and is empirically stable under the diagnostic checks in Section 3.6. A formal comparison of OLS, beta regression, and logit specifications is left for future research (Section 4).
3 Results and Discussion
3.1 Descriptive Statistics and Correlations
Table 1 reports descriptive statistics. The Educational Delay Index has a mean of , indicating that, on average, students leave roughly 29% of enrolled curricular units incomplete, with substantial heterogeneity across the sample. Average age at enrolment is approximately 23 years, reflecting a mix of traditional and non-traditional students; 24.9% of students hold scholarships and 11.3% are classified as debtors. The average unemployment rate over the sample period is 11.56% and average inflation is 1.23%, indicating meaningful macroeconomic variation across cohorts.
Table 1 Descriptive statistics of variables
| Variable | Mean | Std. Dev. | Min | Max |
| Educational Delay Index | 0.292 | 0.341 | 0.00 | 1.00 |
| Age at enrolment | 23.398 | 7.684 | 17.00 | 70.00 |
| Gender | 0.343 | 0.475 | 0.00 | 1.00 |
| Scholarship holder | 0.249 | 0.432 | 0.00 | 1.00 |
| Debtor | 0.113 | 0.317 | 0.00 | 1.00 |
| Tuition fees up to date | 0.881 | 0.323 | 0.00 | 1.00 |
| Unemployment rate | 11.561 | 2.664 | 7.60 | 16.20 |
| Inflation rate | 1.229 | 1.378 | -0.80 | 3.70 |
| GDP | 0.021 | 2.273 | -4.06 | 3.51 |
Table 2 reports the correlation matrix among the Delay Index and its explanatory variables, presented in lower-triangular form to avoid repeating mirrored values, with significance stars on each coefficient. The Delay Index is significantly positively correlated with age at enrolment and gender, and significantly negatively correlated with scholarship holding and tuition fee compliance, consistent with the regression results that follow. Correlations among explanatory variables are moderate throughout, with the strongest being between debtor status and tuition compliance (0.41), suggesting multicollinearity is unlikely to be a serious concern a conclusion confirmed by the VIF analysis in Section 3.5.
Table 2 Correlation matrix of educational delay and explanatory variables (lower triangular)
| Delay | Tuition | Unemp. | Inflation | ||||||
| Variable | Index | Age | Gender | Scholarship | Debtor | Fees | Rate | Rate | GDP |
| Delay Index | 1.000 | ||||||||
| Age at Enrolment | 0.251*** | 1.000 | |||||||
| Gender | 0.230*** | 0.158*** | 1.000 | ||||||
| Scholarship Holder | 0.275*** | 0.194*** | 0.177*** | 1.000 | |||||
| Debtor | 0.178*** | 0.102*** | 0.051*** | 0.073*** | 1.000 | ||||
| Tuition Fees Up to Date | 0.358*** | 0.185*** | 0.107*** | 0.142*** | 0.410*** | 1.000 | |||
| Unemployment Rate | 0.038** | 0.028* | 0.030* | 0.053*** | 0.017 | 0.009 | 1.000 | ||
| Inflation Rate | 0.058*** | 0.024 | 0.001 | 0.030* | 0.025 | 0.004 | 0.031** | 1.000 | |
| GDP | 0.059*** | 0.070*** | 0.001 | 0.035** | 0.084*** | 0.010 | 0.340*** | 0.113*** | 1.000 |
| Note: ***; **; (two-tailed); unmarked coefficients are not statistically significant. | |||||||||
Figure 1 shows the distribution of the Delay Index, which is strongly right-skewed: a large concentration of students exhibit near-zero delay, alongside a distinct tail of students with substantial delay, including a secondary spike near the maximum value. This pattern of concentration motivates the inequality analysis in Section 3.2.
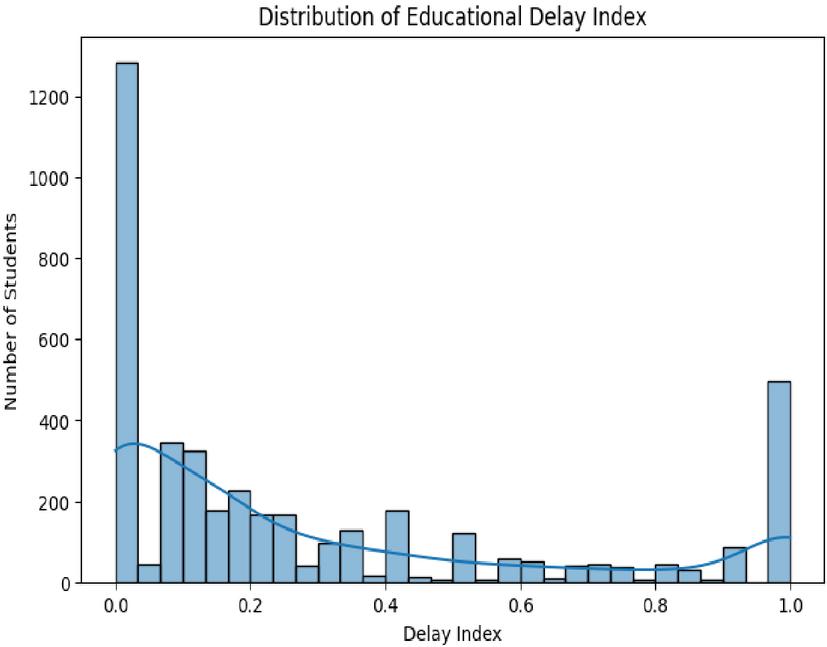
Figure 1 Distribution of the educational delay index.
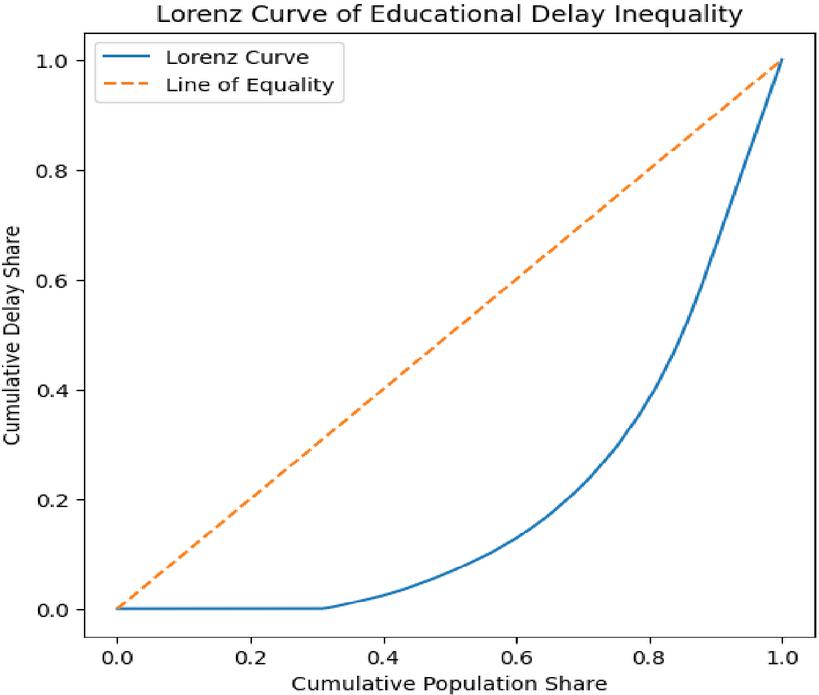
Figure 2 Lorenz curve of educational delay inequality.
3.2 Educational Delay Inequality
The Gini coefficient for the Educational Delay Index is , indicating substantial inequality: a relatively small share of students accounts for a disproportionately large share of total delay. Figure 2 presents the corresponding Lorenz curve, which deviates markedly from the line of equality, visually confirming that delay is concentrated rather than evenly spread across the student population. This indicates that educational delay should be understood as a systemic, distributional phenomenon rather than merely an individual outcome.
3.3 Determinants of Educational Delay: OLS Results
Table 3 reports the HC3-robust OLS estimates. The model is jointly significant () and explains 24.5% of the variation in the Delay Index (Table 4) a level of explanatory power consistent with micro-level educational data, where individual outcomes are shaped by many unobserved factors. The Durbin-Watson statistic (2.005) indicates no meaningful autocorrelation, and residual skewness (0.908) and kurtosis (3.293) fall within acceptable bounds given the sample size and the use of robust standard errors.
Table 3 OLS Regression Results for Educational Delay (HC3-robust))
| Variable | Coefficient | Robust S.E. | t-Stat | 95% CI | Sig. |
| Constant | 0.4427 | 0.035 | 12.748 | 0.375, 0.511 | *** |
| Age at enrolment | 0.0073 | 0.001 | 9.515 | 0.006, 0.009 | *** |
| Gender | 0.1128 | 0.011 | 10.625 | 0.092, 0.134 | *** |
| Scholarship holder | -0.1496 | 0.009 | -16.832 | 0.167, 0.132 | *** |
| Debtor | 0.0095 | 0.017 | 0.550 | 0.024, 0.044 | n.s. |
| Tuition fees up to date | -0.2898 | 0.018 | -16.097 | 0.325, 0.255 | *** |
| Unemployment rate | -0.0063 | 0.002 | -3.395 | 0.010, 0.003 | *** |
| Inflation rate | 0.0055 | 0.003 | 1.609 | -0.001, 0.012 | n.s. |
| GDP | -0.0077 | 0.002 | -3.487 | 0.012, 0.003 | *** |
| Note: ***; **; *; n.s. not significant. |
Table 4 Model diagnostics and goodness-of-fit statistics
| Statistic | Value |
| Observations | 4244 |
| 0.245 | |
| Adjusted | 0.243 |
| F-Statistic | 209.2 |
| Prob(F-Statistic) | 0.001 |
| Log-Likelihood | 874.96 |
| AIC | 1768 |
| BIC | 1825 |
| Durbin-Watson | 2.005 |
| Skewness | 0.908 |
| Kurtosis | 3.293 |
Financial variables show the largest effects. Tuition fee compliance has the largest coefficient in absolute magnitude (0.290, ): students who keep tuition payments current have a Delay Index roughly 0.29 units lower, holding other factors constant. Scholarship holding is similarly protective (0.150, ), consistent with financial aid easing the constraints that force students to work or interrupt study (Dynarski, 2003; Kane, 2003). Debtor status is positive but statistically insignificant , suggesting its effect is absorbed once tuition compliance is controlled for.
Among demographic variables, both age at enrolment (0.0073, ) and gender (0.113, ) are significant and positive: older entrants and the group coded 1 on gender experience greater delay, plausibly reflecting competing work or family responsibilities and structural differences in academic pathways. Macroeconomic variables show smaller but significant effects: unemployment (0.006, ) and GDP (0.008, ) are both negative, consistent with students substituting toward study when labour-market opportunities weaken; inflation is not significant .
3.4 Distributional Effects: Quantile Regression
Because OLS estimates only average effects, quantile regression was estimated at the 10th, 25th, 50th, 75th, and 90th percentiles of the Delay Index (Figure 3). The results show marked heterogeneity. At the 10th percentile, most variables are statistically indistinguishable from zero except tuition compliance (0.100), indicating that low-delay students are largely insulated from demographic and macroeconomic conditions. Effects strengthen steadily through the median and become most pronounced at the upper tail: at the 90th percentile, scholarship holding reaches its largest protective effect (0.513) and debtor status becomes significant (0.063), showing that financial stress disproportionately affects the most severely delayed students. Age and gender effects also increase in magnitude across quantiles, while the pseudo- rises from 0.012 at the 10th percentile to 0.221 at the 90th, indicating that the model’s explanatory power itself grows substantially for students experiencing the greatest delay.
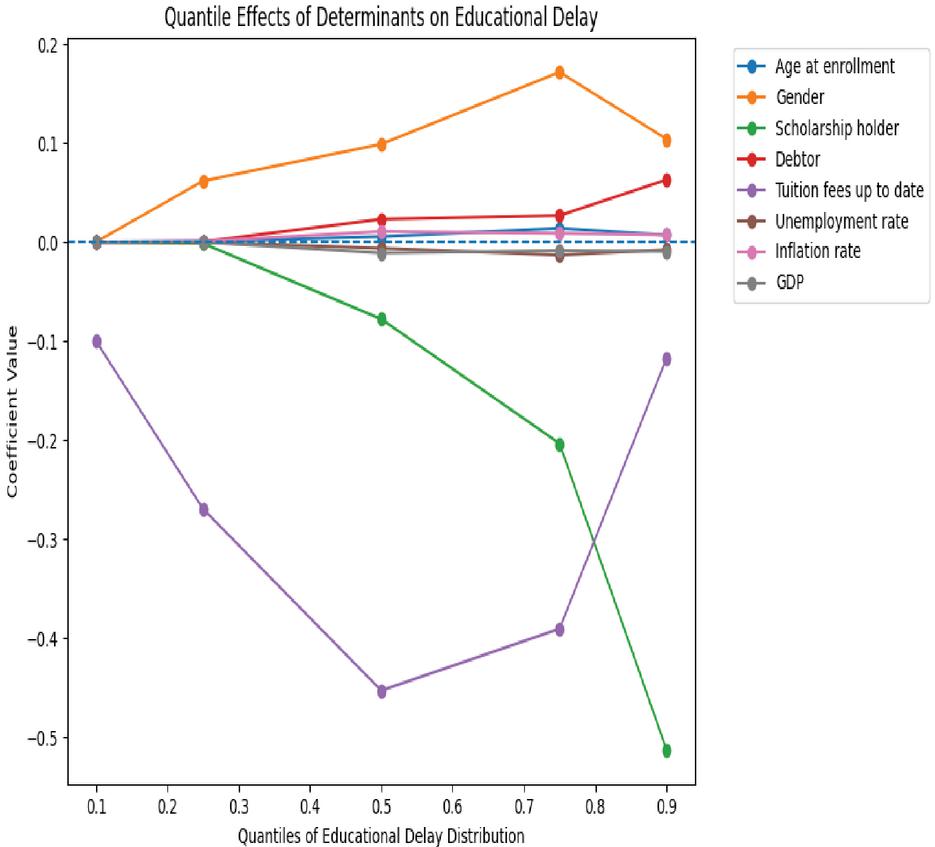
Figure 3 Quantile effects of determinants on educational delay.
Table 3a: Summary of quantile regression coefficients across
| Variable | |||||
| Age at enrolment | 0.0000 | 0.0007 | 0.0054 | 0.0138 | 0.0069 |
| Gender | 0.0000 | 0.0615 | 0.0988 | 0.1714 | 0.1039 |
| Scholarship holder | 0.0000 | 0.0000 | -0.0779 | -0.2036 | -0.5128 |
| Debtor | 0.0000 | 0.0000 | 0.0200 | 0.0250 | 0.0627 |
| Tuition fees up to date | -0.1000 | -0.2695 | -0.4530 | -0.3906 | -0.1120 |
| Unemployment rate | 0.0000 | 0.0000 | -0.0100 | -0.0150 | -0.0130 |
| Inflation rate | 0.0000 | 0.0000 | 0.0000 | 0.0050 | 0.0060 |
| GDP | 0.0000 | -0.0050 | -0.0100 | -0.0120 | -0.0080 |
| Pseudo-R2 | 0.012 | 0.061 | 0.128 | 0.187 | 0.221 |
| Note: coefficients of 0.0000 indicate a statistically insignificant effect at that quantile. The table complements Figure 3 by allowing direct comparison of coefficient magnitude and sign across the delay distribution. | |||||
3.5 Inequality Decomposition and Variable Importance
Table 5 decomposes the Gini coefficient into the contribution of each determinant. Age at enrolment is the largest positive contributor to inequality (0.290), followed by gender (0.076), indicating that delayed entry and gender-related differences widen disparities in academic progression. Financial variables act as equalizers: tuition fee compliance makes the largest negative contribution (0.537), scholarship holding also reduces inequality (0.071), and unemployment contributes negatively as well (0.170), consistent with students remaining more engaged academically when labour-market opportunities are scarce.
Table 5 Decomposition of educational delay inequality
| Variable | Beta | Mean | Elasticity | Contribution to G |
| Age at enrolment | 0.005965 | 23.3977 | 0.4778 | 0.2905 |
| Gender | 0.106113 | 0.3428 | 0.1245 | 0.0757 |
| Inflation rate | 0.010196 | 1.2291 | 0.0429 | 0.0261 |
| Debtor | 0.040479 | 0.1131 | 0.0157 | 0.0095 |
| GDP | -0.009543 | 0.0209 | -0.0007 | -0.0004 |
| Scholarship holder | -0.137194 | 0.2486 | -0.1167 | -0.0710 |
| Unemployment rate | -0.007057 | 11.5608 | -0.2793 | -0.1698 |
| Tuition fees up to date | -0.292572 | 0.8815 | -0.8828 | -0.5367 |
Table 6 reports standardized coefficients, which rank determinants by relative importance independent of measurement scale. Tuition fee compliance is the single most important determinant (30.1% of total standardized effect), followed by scholarship holding (20.8%), age at enrolment (17.5%), and gender (17.2%); macroeconomic factors contribute comparatively little (GDP 5.6%, unemployment 5.4%, inflation 2.4%), and debtor status is negligible (1%) once other financial variables are held constant.
Table 6 Relative importance of determinants (standardized regression)
| Variable | Standardized | Absolute Impact | Contribution (%) |
| Tuition fees up to date | -0.0946 | 0.0946 | 30.14 |
| Scholarship holder | -0.0654 | 0.0654 | 20.84 |
| Age at enrolment | 0.0549 | 0.0549 | 17.50 |
| Gender | 0.0538 | 0.0538 | 17.15 |
| GDP | -0.0176 | 0.0176 | 5.60 |
| Unemployment rate | -0.0170 | 0.0170 | 5.43 |
| Inflation rate | 0.0075 | 0.0075 | 2.39 |
| Debtor | 0.0030 | 0.0030 | 0.97 |
3.6 Robustness and Diagnostic Tests
The Breusch-Pagan test confirms the presence of heteroskedasticity (), justifying the use of HC3-robust standard errors throughout. Table 7 combines the Variance Inflation Factor and bootstrap-resampling results (200 iterations). All VIF values are close to 1, with a maximum of 1.275 for tuition compliance well below the conventional threshold of 10 confirming that multicollinearity is not a material concern. The bootstrap means closely track the baseline OLS coefficients with small standard deviations throughout (e.g., tuition compliance: 0.293 vs. 0.290 baseline), indicating the estimated relationships are stable and not driven by sampling variation.
Table 7 Variance inflation factor and bootstrap results
| Variable | VIF | Bootstrap Mean | Bootstrap Std. Dev. |
| Age at enrolment | 1.081 | 0.00594 | 0.00073 |
| Gender | 1.050 | 0.10619 | 0.01072 |
| Scholarship holder | 1.103 | -0.13669 | 0.00953 |
| Debtor | 1.247 | 0.04016 | 0.01782 |
| Tuition fees up to date | 1.275 | -0.29312 | 0.01928 |
| Unemployment rate | 1.158 | -0.00705 | 0.00179 |
| Inflation rate | 1.023 | 0.01014 | 0.00338 |
| GDP | 1.184 | -0.00944 | 0.00215 |
Cook’s Distance diagnostics (Figure 4) show that no observation exceeds the conventional influence threshold of 4/n, confirming that the estimated relationships are not driven by a small number of extreme observations.
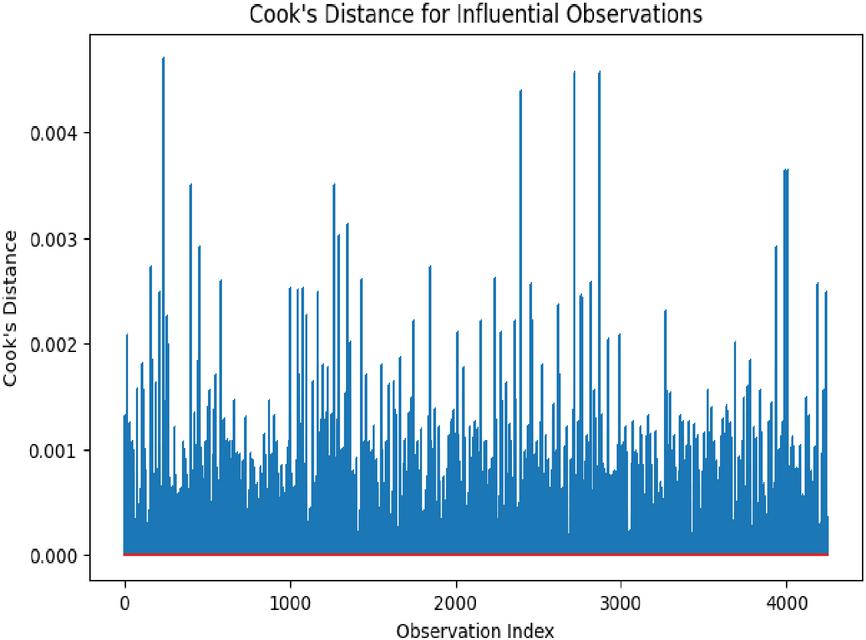
Figure 4 Cook’s distance for detection of influential observations.
3.7 Synthesis and Policy Implications
Taken together, the results show that educational delay is driven primarily by financial stability rather than by demographic or macroeconomic circumstances alone. Tuition fee compliance and scholarship access are consistently the strongest and most equalizing determinants across the OLS, quantile, decomposition, and standardized-importance results, with their protective effect intensifying among the most severely delayed students. Age at enrolment is the largest single contributor to inequality, suggesting that non-traditional, older entrants face structural barriers to timely progression, while gender differences point to unequal academic trajectories that merit further institutional attention. Macroeconomic conditions play a secondary but non-trivial role, operating largely through students’ opportunity cost of time. These findings point toward targeted financial-aid expansion, flexible arrangements for older and non-traditional students, and institutional support for tuition payment planning as priority levers for reducing both the level and the inequality of educational delay.
4 Conclusion
This study integrates econometric modelling with distributional and decomposition techniques to analyse the determinants and inequality of educational delay among 4,244 students. Educational delay is substantially unequal (Gini 0.608) and is driven by a combination of demographic, financial, and macroeconomic factors, with financial stability particularly timely tuition payment and scholarship access emerging as the most influential and most equalizing determinant, while older age at enrolment is the largest single contributor to inequality and its effects, along with those of gender and financial constraints, intensify markedly among the most severely delayed students. These results indicate that educational delay is best understood as a structural and financial phenomenon rather than a purely individual one, and they point toward strengthening scholarship programmes, improving institutional tuition-payment support, and offering flexible arrangements for older and non-traditional students as priority policy levers. The model omits parental education and family socioeconomic background (Coleman, 1988; Corak, 2013), prior academic performance, and institutional characteristics such as program type and advising intensity, so part of the estimated effect of age, gender, and financial status may reflect correlated, unobserved family- or institution-level factors, consistent with the moderate of 0.245 reported in Table 4; a formal comparison against beta regression and logit alternatives (Section 2.6) is likewise left to future work. The analysis is further limited by its reliance on cross-sectional data, which cannot capture how delay trajectories evolve over time; future work could extend this framework using longitudinal data and institution-level characteristics to further deepen understanding of the mechanisms driving educational delay.
Declarations
• AI has been used for language checking of this paper
• Authors declare that there is no conflict of interest
References
[1] Becker, G. S. (1964). Human Capital. University of Chicago Press.
[2] Becker, G. S., and Tomes, N. (1986). Human capital and the rise and fall of families. Journal of Labour Economics, 4(3, Part 2), S1–S39.
[3] Bettinger, E. (2004). How financial aid affects persistence. In College Choices: The Economics of Where to Go, When to Go, and How to Pay for It (pp. 207–238). University of Chicago Press.
[4] Bound, J., Lovenheim, M. F., and Turner, S. (2010). Why have college completion rates declined? An analysis of changing student preparation and collegiate resources. American Economic Journal: Applied Economics, 2(3), 129–157. https://doi.org/10.1257/app.2.3.129.
[5] Breen, R., and Jonsson, J. O. (2005). Inequality of opportunity in comparative perspective: Recent research on educational attainment and social mobility. Annual Review of Sociology, 31, 223–243.
[6] Chetty, R., Hendren, N., Kline, P., and Saez, E. (2014). Where is the land of opportunity? The geography of intergenerational mobility in the United States. The Quarterly Journal of Economics, 129(4), 1553–1623.
[7] Coleman, J. S. (1988). Social capital in the creation of human capital. American Journal of Sociology, 94, S95–S120.
[8] Corak, M. (2013). Income inequality, equality of opportunity, and intergenerational mobility. Journal of Economic Perspectives, 27(3), 79–102.
[9] Cowell, F. (2011). Measuring Inequality. Oxford University Press.
[10] Dynarski, S. M. (2003). Does aid matter? Measuring the effect of student aid on college attendance and completion. American Economic Review, 93(1), 279–288. https://doi.org/10.1257/000282803321455287.
[11] Ferrari, S., and Cribari-Neto, F. (2004). Beta regression for modelling rates and proportions. Journal of Applied Statistics, 31(7), 799–815.
[12] Kane, T. J. (2003). A quasi-experimental estimate of the impact of financial aid on college-going. NBER Working Paper No. 9703. https://doi.org/10.3386/w9703.
[13] Koenker, R. (2005). Quantile Regression. Econometric Society Monographs, Cambridge University Press.
[14] Koenker, R., and Bassett, G. (1978). Regression quantiles. Econometrica, 46(1), 33–50. https://doi.org/10.2307/1913643.
[15] Korkmaz, M. Ç., Chesneau, C., and Korkmaz, Z. S. (2022). The unit folded normal distribution: A new unit probability distribution with the estimation procedures, quantile regression modeling and educational attainment applications. Journal of Reliability and Statistical Studies, 15(1), 261–298.
[16] Lesner, R. V., Damm, A. P., Bertelsen, P., and Pedersen, M. U. (2022). The effect of school-year employment on cognitive skills, risky behavior, and educational achievement. Economics of Education Review, 88, 102241. https://doi.org/10.1016/j.econedurev.2022.102241.
[17] Long, J. S. (1997). Regression Models for Categorical and Limited Dependent Variables. Sage Publications.
[18] Noor-Ul-Amin, M., Asghar, S. U. D., Sanaullah, A., and Shehzad, M. A. (2018). Redescending M-estimator for robust regression. Journal of Reliability and Statistical Studies, 11(2), 69–80.
[19] Oreopoulos, P., and Petronijevic, U. (2013). Making college worth it: A review of research on the returns to higher education. The Future of Children, 23(1), 41–65.
[20] Shorrocks, A. F. (1982). Inequality decomposition by factor components. Econometrica, 50(1), 193–211. https://doi.org/10.2307/1912537.
[21] Tavares, P. A. (2015). The impact of school management practices on educational performance: Evidence from public schools in São Paulo. Economics of Education Review, 48, 1–15. https://doi.org/10.1016/j.econedurev.2015.05.002.
BIOGRAPHIES

Gaurav Singh is a Research Scholar in the Department of Mathematics, Statistics, and Computer Science at G.B. Pant University of Agriculture and Technology, Pantnagar. He is doing a Ph.D. in Agricultural Statistics from the Department of Mathematics, Statistics and Computer Science at G.B. Pant University of Agriculture and Technology, Pantnagar. His research focuses on Applied Statistics and Agricultural Statistics. He has published extensively in reputed journals and serves as a reviewer for several esteemed academic publications. He completed his B.Sc. from VCSGUUHF, Bharsar and M.Sc. from GBPUA&T, Pantnagar. Alongside his academic responsibilities, he remains actively engaged in research, contributing to advancements in his field.

Vinod Kumar is an esteemed Professor in the Department of Mathematics, Statistics, and Computer Science at G.B. Pant University of Agriculture and Technology, Pantnagar. With a distinguished career in academia, he has also held various administrative positions at the university. His research interests include Applied Statistics, Life Testing, Reliability and Bayesian Inference. He has published numerous research papers in reputed journals and actively contributes as a reviewer for many prestigious publications. Additionally, he serves as an Editor-in-Chief for Journal of Reliability and Statistical Studies further demonstrating his dedication to the advancement of statistical research.

Arun Kumar received the Ph.D. degree in Mathematics from Gurukul Kangri University, Haridwar, India, in 1997. His current research interests include Artificial Intelligence and Machine Learning, Fuzzy Multi-Criteria Decision Making (MCDM) and Multi-Objective Optimization. He has actively contributed to these research areas through scholarly publications in reputed international journals. Dr. Kumar also serves as a reviewer for several leading SCI-indexed journals, including Applied Soft Computing, Engineering Applications of Artificial Intelligence, IEEE Transactions on Fuzzy Systems and other high-impact international journals. His current research focuses on developing intelligent, uncertainty-aware, and optimization-driven methodologies for solving complex real-world decision-making problems.
Journal of Reliability and Statistical Studies, Vol. 19, Issue 2 (2026), 615–634
doi: 10.13052/jrss0974-8024.19215
© 2026 River Publishers