A Hybrid Reliability and Risk Assessment Framework for Sustainable Systems Using Markov Model and Fuzzy FMEA
Mohd Anas1, Mangey Ram2 and Shristi Kharola3,*
1Department of Mathematics, Graphic Era (Deemed to be University), Dehradun, India
2Department of Mathematics, Computer Science and Engineering, Graphic Era (Deemed to be University), Dehradun, India
3Department of Mathematics, University Institute of Sciences, Chandigarh University, Mohali, India
E-mail: manas6419@gmail.com; mangeyram@geu.ac.in; shristikharola@gmail.com
*Corresponding Author
Received 22 May 2026; Accepted 04 September 2026
Abstract
Renewable energy has emerged as a cornerstone of sustainable development. A sustainable engineering system progressively relies on renewable energy, due to minimal environmental impact and long-term economic benefits. A solar energy system is one of the most well-known engineering systems, which uses sunlight as the power source to convert it into electrical energy. The function of solar energy systems provides a sustainable and cost-effective solution for electricity generation. This study deeply performs reliability and risk analysis of the proposed Smart Water Supply (SWS) system powered by solar energy. The study uses Markov modeling technique to analyze the stochastic behaviour of the transition states of the proposed model and evaluate the reliability measures, such as availability, reliability, mean-time-to-failure (MTTF) and expected cost. Subsequently, the study uses fuzzy FMEA technique to assess potential failure modes by identifying and ranking the most significant failure modes that affect the system’s performance, efficiency and reliability. Using various data sources, 18 failure modes are identified and their criticality is evaluated using the Pareto-based fuzzy Risk Priority Number (RPN) to ensure a comprehensive and practically relevant analysis. The proposed methodology offers insights to enhance the overall performance, sustainability and reliability of the SWS system.
Keywords: Markov modeling, fuzzy FMEA, sustainable systems, renewable energy system, reliability, risk.
1 Introduction
This century has witnessed a rapid technological advancement. Both developed and developing countries now rely heavily on electrical energy for a wide range of applications. The electrical power consumption is increasing rapidly, which has become a major concern because fossil fuels, which cannot be renewed on their own, will eventually run out. Therefore, it is imperative to use alternative energy sources, such as sustainable/renewable energy sources, instead of more conventional ones, including gasoline, nuclear energy, coal, and so forth, which are demonstrably harmful to the environment. The major disadvantages of traditional energy sources include nuclear radiation risks and the generation of ash and other pollutants from coal-based power, which complicate waste management and cause environmental contamination of land and water (Kumar et al., 2023). Due to these negative environmental effects, there is an urgent need to shift toward energy options that are economically viable, reliable, pollution-free, and environmentally friendly. The alternative sources of energy include hydropower energy, solar photovoltaic energy, wind energy and so on. These sustainable sources fulfil the current need without compromising the future generation’s need by balancing economic, environmental, and social factors (Patil et al., 2024).
Solar energy is one of the most popular sources of energy, and is reliable, environmentally friendly and has nominal impact on the environment. This energy uses direct sunlight; it operates without the need for any other kind of fossil fuel. In this context, integrating renewable energy into other critical infrastructure systems, such as potable water supply, is essential. Water is one of the most vital natural resources for meeting the needs of humans, other living organisms, economic development, and ecosystem stability; however, less than of Earth’s water is accessible for human use. Groundwater is the primary source that responds to climate change, particularly through changes in groundwater recharge (Mishra, 2023). In recent decades, rapid changes in technology, urbanization, rising lifestyle, and climate-driven inconsistency in water facilities have fostered the need for efficient and reliable water supply facilities, specifically in urban areas. Urban Water supply systems are high-energy-demand infrastructures because they depend heavily on pumping stations and water storage backup tanks to maintain pressure and water supply to customers under certain demand conditions. Ensuring its reliable supply has become a major challenge due to rapid development. The water supply system is one of the most energy-intensive processes in the urban water cycle because it relies heavily on electrically driven pumps to supply water from the sources to end consumers. In this context, past studies based on operational control in water supply networks depict that operating cost and energy consumption are both strongly influenced by pump operation and scheduling, emphasizing the need for more intelligent pumping and efficient strategies (Abebe, 2024).
Traditional water supply and pumping installations are mostly operated with limited sensors, voltage and manual control, which leads to issues such as pressure fluctuation, improper pump run time, premature wear of mechanical components and high non-revenue water. Studies indicate that poorly operated pumps increase energy consumption and contribute to avoidable leakages and service disruptions, particularly in rapidly expanding water supply networks. In many multi-story buildings, consumers still depend on on-site visual inspection, and manual pumps being operated manually based on estimated tank levels, which are expensive and prone to human error (Abdelsalam and Gabbar, 2021). These limitations inspire the transformation from a traditional pump to a Smart Water Supply (SWS) system.
The proposed study evaluates a sustainable engineering system reliability with a primary emphasis on sustainability. Although various studies have been conducted on the reliability of traditional non-renewable systems, the growing need to address environmental issues requires a transition toward sustainable engineering solutions. In this century, engineering systems should be assessed not only in terms of operational performance and financial cost but also based on their long-term environmental sustainability. The present study introduces a Smart Water Supply (SWS) system and assesses its reliability in the context of Sustainable Development Goal (SDG), Goal number 7, Affordable and Clean Energy. Water is one of the most precious resources on Earth, and maintaining its sustainable and reliable supply has become a global research priority. Therefore, the presented model integrates renewable solar energy with smart water management to provide an energy-efficient, reliable and sustainable solution for water supply management.
Unlike the traditional water pumping system that heavily depends on conventional grid electricity, the proposed framework enables the function to operate autonomously, through continuous water monitoring, data storage and automatic startup or cutoff from the main electric signal according to predefined logic. By eliminating dependence on the grid, minimizing transmission losses, reducing human intervention and ensuring uninterrupted operation through battery-supported PV generation, the proposed framework offers a reliable, sustainable, and energy-efficient solution for a modern water supply system. The proposed integrated technique provides enhanced operational reliability, minimized energy consumption, improved water management, and supports the transition toward intelligent and sustainable water supply infrastructure.
Past studies emphasized the significance of monitoring and failure detection for water pumps, as electrical and mechanical faults can increase the disruptions and high maintenance costs when the fault is not detected at an early stage. To bridge this gap, this study proposes a wide risk and reliability framework for the SWS system. The Markov process and Fuzzy Failure Modes and Effects Analysis (FFMEA) technique are used to measure the outcomes and investigate the stochastic behaviour of the transition states by analyzing the possible failures and how they affect the safety, performance and reliability of the SWS system. FMEA is a systematic way to recognize and evaluate potential failures of a system, as well as its causes and effects. It also involves taking proactive steps to lower the risk of malfunctions that happen while a system is in operation. FMEA is often used in the automotive, aerospace, military, and semiconductor sectors to enhance quality, reliability, and safety while reducing costs and enhancing customer satisfaction. The proposed technique uses Risk Priority Number (RPN) to evaluate the risk parameters, primarily Occurrence (O), Severity (S) and Detection (D) (Kull et al., 2025). In addition, to assess the reliability characteristics, the Markov process technique is used to depict the stochastic transition between different functional states of the SWS system over time through the differential equation, enabling quantitative approximation of availability, reliability, cost analysis and MTTF; including the qualitative perception from FMEA. This advanced FMEA technique evaluates the possible failures, prioritizes and optimizes the overall reliability, efficiency and performance of the SWS system.
The remaining part of the study is arranged in the following sections. Section 2 provides the relevant literature on the application of FMEA and Markov processes in reliability engineering. Section 3 proposes the system with a complete description, including the model construction. Section 4 gives the mathematical formulation of the system based on the Markov process, comprising reliability measures, followed by the advanced FMEA methodology framework, including the data collection approach and criticality analysis of failure modes. Section 5 discusses and compares the results obtained from the two methodologies. Finally, Section 6 concludes the study.
2 Literature Review
As the demand for clean and renewable energy sources globally increases, solar energy is one of the most popular renewable energy sources, which plays a significant role in providing a sustainable way to fight climate change and reduce reliance on fossil fuels. People are investigating renewable energy for the production of electricity due to environmental concerns and the constant increase in power-producing costs. Solar energy provides a reliable and affordable source of energy throughout the year. This makes it ideal for water supply challenges. As worldwide water shortages worsen and energy prices rise, the increasing integration of solar energy with water delivery systems represents a critical step towards sustainable resource usage, making it a perfect fit for water supply concerns. Especially in isolated rural regions of poor countries, these solar-powered systems for pumping and water supply provide a flexible and low-emission alternative as compared to the conventional grid approach. In past studies, literature reveals that numerous research projects have worked on optimizing the reliability of solar energy systems and water supply systems. This segment reviews previous studies in these areas.
In their study, Al-Ali et al. (2025) addressed smart crystalline silicon thin-film and rising PV technologies, comprising bifacial modules with high-efficiency cell architecture. Also, the authors discussed smart PV battery storage systems and grid applications, highlighting how the battery storage improves reliability and power availability during poor weather. Obatola (2024) evaluated the reliability of large microgrid PV plants, incorporating failure rate modelling, MTTF, reliability, maintainability, and availability indices. The study also assessed significant failure components, such as inverter, transformer, photovoltaic modules, and changeover switch and emphasized which subsystem controls maintenance and unavailability under specific conditions. Alimi et al. (2022) analyzed PV module degradation statistics for components and used experimental methods to evaluate degradation rate and lifespan, offering yearly quantitative ranges for poor performance under different weather conditions. Verma et al. (2021) addressed the application and design of a PV energy water pump system for agriculture and water distribution. The author compared it with traditional diesel-based pumps and found that PV pump systems are more economical and environmentally friendly, and further discussed scheme incentives and subsidy support from the government.
Colli (2015) presented a microgrid system in which the system and subsystems, like the inverter, cabling, protection, and module are evaluated based on RPN and prioritized on the rank-based rating. Also, this study revealed risk-leading components, such as the inverter connections, and later proposed the mitigation strategies. Basu (2015) performed work on rooftop PV installation, including crystalline PV modules, inverters, batteries, and charger controllers and evaluated the reliability of the mechanism. The author specifies the failures like PV degradation, inverter malfunction, charger controller and battery sulfation; recognizes their effect, cause and impact on the system; and ranks the battery and controller as the most significant failure modes based on RPN. Patil et al. (2024) focused on PV panels and developed a detailed FMEA (Failure Modes and Effects Analysis) at the component level, such as glass, cell, encapsulant, junction box, and interconnects, through field survey data, testing literature, and expert judgment. Based on this, the authors found that delamination and soiling are the most significant failures with the highest RPN values, which contribute to risk, and encapsulant is the most significant failure in overall risk contribution. They also proposed maintenance strategies and concrete design recommendations. Pimpalkar (2024) performed FMEA on polycrystalline PV modules mounted in various regions in India with complex climates. Using field surveys from active plants as its main input, the author recognized failures and priorities, including hotspot, glass breakage, internal failures, junction box, and encapsulant discoloration issues, and ranked them based on RPN value.
Swain et al. (2024) proposed a fuzzy Markov model to evaluate the reliability of a smart microgrid, comprising a PV module, diesel generator, wind turbine, and battery backup. The authors constructed a Markov state transition diagram and incorporated a triangular fuzzy number to handle uncertainty in faults to assess system reliability measures. Gupta and Bhargava (2024) addressed multiple microgrid system configurations with PV arrays, wind energy, and applied the Markov process by reliability approach to select the optimal configuration, creating a space model for various combinations of equipment down/up states and assessing availability and reliability. Diamenu et al. (2022) addressed the crucial problem of managing uncertainty in renewable energy systems to maintain reliable power supplies in the face of fluctuating loads. By creating a single, coherent model, they independently mapped out the wind energy generating system (WEGS) and its various load patterns based on the Markov process.
Li (2023) proposed classical FMEA for PV plants by performing seven risk factors through rough set theory, cloud model theory and the MULTIMOORA approach to tackle the vagueness, expert opinions and subjectivity while ranking failures. This technique was applied to PV modules, which showed that hotspots and disconnection of cables are the most significant failure modes. Khalilzadeh et al. (2021) introduced a novel FMEA approach for risk evaluation in the planning stage of oil and gas construction projects in Iran, based on a fuzzy MCDM approach and multi-objective programming model. Li et al. (2021) established an integrated FMEA methodology for moving offshore wind turbines through coupling AHP with FMEA to assess criteria weights for O, S and D and evaluate a complex risk index for each failure. The proposed approach was applied to subsystems such as mooring, electrical system, tower blades and so forth, recognizing approximately 15 risk scenarios, highlighting drivetrain and tower failures as the most significant risks. Çıtıroğlu et al. (2022) presented an advanced FMEA-based analysis to evaluate potential risks, errors, and precautionary measures during the installation of a photovoltaic (PV) plant, integrating expert opinions with established methods such as FMEA, AHP, and Pareto analysis to assess causes, effects, and mitigation strategies.
In their study, Testik and Unlu (2023) addressed traditional and fuzzy FMEA techniques to prioritize risk in test calibration laboratories. The results demonstrate that fuzzy FMEA, which uses linguistic expert judgements, provides rankings that are highly consistent with conventional FMEA. Karanović et al. (2024) performed fuzzy FMEA to recognize and classify 47 failure modes in a ship’s four hydraulic steering systems based on experts’ judgment. The technique aids in maintenance planning, decreases downtime and enhances navigation safety and found that insufficient system pressure is significantly caused by faulty hoses, pipes and connectors. Alizadeh et al. (2022) applied conventional FMEA to a wastewater treatment plant screening/grit unit, where 96% of the 53 identified failure modes were classified as low risk. In contrast, fuzzy FMEA provided a more balanced prioritization, categorizing 9% as low, 81% as medium, and 9% as high risk, thereby demonstrating the superiority of fuzzy logic for expert-driven decision-making.
2.1 Failure Modes and Effects Analysis (FMEA): Concept and Evaluation
The FMEA technique was published in 1949 in the US military procedure document MIL-P-1629, which was revised in 1980 as MIL-STD-1629A (Bouti and Kadi, 1994). Initially, it was used to improve the safety and reliability of complicated military systems by proactively identifying and avoiding possible failures while designing the process. Later, in the 1960s, FMEA was applied in the nuclear and aerospace industries due to their stringent safety and reliability requirements, particularly during the Apollo missions. In the 1970s, the Ford Motor Company and the automobile industry adopted FMEA for safety and regulatory reasons. Additionally, it was also used to improve the production and design. Since then, the FMEA technique has been used in various industries, including mechanical, electrical, semiconductor and medical sectors (Sharma and Srivastava, 2018). As technology has enhanced over time, FMEA has become one of the most popular techniques globally for assessing possible failures, mitigation plans, and enhancing the safety, design and reliability of any system. Figure 1 depicts the different types of FMEA used to evaluate and identify possible failures at numerous levels of production and design, operational and manufacturing cycles.
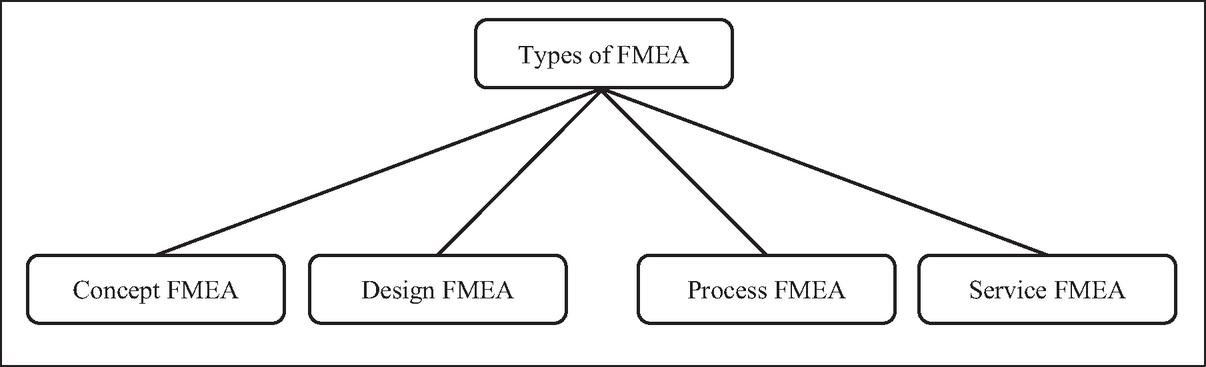
Figure 1 Different types of FMEA.
Conceptual FMEA (CFMEA), also known as System FMEA, assesses possible failure modes at the highest system level in the early stages of design, emphasizing general architecture, functions, and subsystem relationships of specific components. In order to prioritize risk before detailed design starts and inform architecture choice and interface definitions, it determines how system-level risk failure could impact performance, safety, or goal objectives. Design FMEA (DFMEA) focuses on sensing and mitigating potential product design failures. It seeks to guarantee that the finished design satisfies the required specification and performs dependably under anticipated operational conditions. It is also used to improve design robustness and reliability in the early stages of product development. Process FMEA (PFMEA) aids in identifying the possible failure modes, risks in manufacturing that might arise during manufacturing and impact the effectiveness or quality of the final product. Early in the process lifetime, PFMEA facilitates the introduction of preventive controls by proactively addressing these risks. Service FMEA (SER FMEA) examines how operational-related service, support activities, and customer-facing elements are incorporated. Also, it recognizes the possible failure modes that may happen during service delivery and assesses their effect on consumer satisfaction and operational performance and enhanced quality initiatives in service sectors by decreasing errors and inefficiencies (Rudov-Clarck and Stecki, 2009; Sharma and Srivastava, 2018). Table 1 provides the various applications of advanced FMEA and Markov processes in the field of reliability engineering. Emphasizing their methodologies, application areas and research limitations.
Table 1 Advanced FMEA and Markov application in reliability engineering
| References | Area of Application |
| Rawala et al. (2014) | Modelling and availability analysis of an Internet Data Centre with several maintenance strategies; created a stochastic model for IDC reliability based on a Markov process. |
| Ahmed et al. (2014) | Examined risk-based availability Markov model, a risk-based stochastic modeling technique that uses a Markov decision process to evaluate a processing unit’s availability. |
| Zaman et al. (2014) | Developed a formal safety assessment methodology for ship collision based on FMEA and fuzzy logic; recognized collision hazards and combined them with real sea traffic data from AIS installations in Japan and Malaysia. |
| Chanamool and Naenna (2016) | Proposed the application of Fuzzy FMEA for assessment and prioritization of failures that are likely to happen in the operational process of an emergency department. |
| Dağsuyu et al. (2016) | Applied both traditional and Fuzzy FMEA with a risk matrix to a hospital in the sterilization unit to recognize, quantify and prioritize procedure hazards. |
| Rawat et al. (2017) | Proposed a generic software reliability model for the agile procedure, which considered both permanent and persistent errors. |
| Najafi et al. (2015) | Presented a reliability and availability analysis of the sugarcane 7000 series shopper harvester at Iran Hakim Farabi agro-industry. |
| Brun and Savino (2018) | Proposed an improved FMEA using pairwise comparison and Markov chains for long-term risk evaluation; applied to the construction industry. |
| Balaraju et al. (2019) | Used Fuzzy FMEA for prioritization of risk in a critical underground mining loader for ore transport. |
| Godina et al. (2021) | Used the Fuzzy FMEA and traditional FMEA in an industrial manufacturing unit; the recognized failure modes were evaluated using fuzzy RPN. Results found the non-linear relationship between the variables. |
| El-Moumen et al. (2022) | Determined the reliability and performance indicators of a system with finite-state Markov chains and stochastic Petri nets. |
| Kadena et al. (2022) | Applied fuzzy FMEA to evaluate hardware and software failures in a typical smartphone and used consumers’ reported failure data and RPN structure to rank prioritized potential failures. |
| Rahimdel et al. (2022) | Optimized safety risk assessment, based on fuzzy FMEA and AHP, recognized the critical hazardous failure affecting labours and tools in Iran’s coal mine. |
| Shivani et al. (2023) | Enhanced the reliability of the complex series-parallel configuration system based on the Marko process with a supplementary variable approach, allowing for general as well as exponential distribution repair rates from failed to operational states. |
| Beiranvand (2024) | Worked on Eyvashan Dam and developed an advanced FMEA methodology to overcome the limitations and ambiguity of traditional FMEA in environmental risk calculation for dam projects. |
| Resende et al. (2024) | Performed Fuzzy FMEA and the traditional FMEA approach and observed variation in both the approaches by a case application in the aeronautical industry. |
| Chen et al. (2025) | Improved Fuzzy FMEA methodology to effectively manage expert uncertainty and automate fuzzy rules for offshore wind turbines, based on the Mamdani fuzzy inference system. |
| Torres and Silva (2026) | Created a novel approach that optimizes assertiveness in risk management and boosts the reliability of apron weigh feeders in the cement industry, including FMEA and fuzzy logic and the 5S criterion. |
| Julitz et al. (2025) | Compared a data-driven Markov-based risk assessment model with an enhanced FMEA for analyzing failures in complex systems; showed their complementary use, where Markov enables dynamic risk updates, but no direct integrated FMEAMarkov framework is developed. |
| Sobhani and Chountalas (2017) | Developed a Markov model for BLE functionality in hearing aids, where system states represent different operational modes and failures; FMEA is used to rank failure severity and define state transitions, forming a clear integrated FMEAMarkov framework. |
| Tavakoli et al. (2022) | Used weighted FMEA (via Fuzzy DEMATEL and BWM) to assess medical device risks and calculate risk priority scores; Steady-state probabilities were analyzed (Markov concept), but no explicit integrated FMEA-Markov modeling framework was established. |
| Kolek et al. (2015) | Applied FMEA to identify critical failures in a control system and used Markov chains, DFTA, and simulation for reliability evaluation. |
Previous studies have comprehensively investigated the reliability and risk assessment of sustainable engineering systems, particularly photovoltaic (PV), wind energy and renewable energy systems, using multiple techniques. However, a critical synthesis of the existing study reveals the need for an extensively sustainability-oriented farmwork, founding the research gap addressed in the proposed study.
Reliability indices, such as reliability, availability, maintainability, MTTF and microgrid, have been estimated using a Markov model through (Obatola, 2024; Swain et al., 2024; Gupta and Bhargava, 2024; Diamenu et al., 2022). Although this study primarily focused on reliability indices without methodically investigating the failure process causing system degradation, they provide insightful information about system performance under various operating conditions. In this context, Colli (2015), Basu (2015), Patil et al. (2024), Pimpalkar (2024), Li (2023), Testik and Unlu (2023); Karanović et al. (2024), and Alizadeh et al. (2022) emphasize risk assessment using conventional or fuzzy FMEA, which efficiently prioritizes failure modes and facilitates maintenance planning but does not measure long-term system availability and reliability. Furthermore, to enhance failure ranking under uncertainty, Li et al. (2021); Khalilzadeh et al. (2021), and Çıtıroğlu et al. (2022) integrated FMEA with advanced decision-making techniques such as AHP, Pareto analysis, fuzzy MCDM, and MULTIMOORA. Although these hybrid approaches enhance decision-making, they remain primarily focused on risk prioritization rather than comprehensive reliability evaluation. Similarly, Al-Ali et al. (2025), Alimi et al. (2022), and Verma et al. (2021) demonstrated improvement in PV degradation, efficiency behavior and economic viability, but they provide limited integration with risk assessment and reliability-based maintenance.
Overall, the literature shows that FMEA and Markov modelling have been used extensively for risk and reliability evaluation of renewable energy systems, both individually and in hybrid forms. However, existing studies generally address reliability estimation, failure prioritization, and degradation assessment. A unified framework that simultaneously integrates expert-driven Fuzzy FMEA, Markov reliability modelling, Pareto-based prioritization, and sustainability-oriented performance measures for a Smart Water Supply system remains limited. To bridge this gap, the proposed study introduced an integrated framework that integrates qualitative expert knowledge with quantitative mathematical modelling to assess significant failure modes, availability, reliability, mean time to failure (MTTF) and expected cost while explicitly including sustainability consideration. This integrated framework provides a more comprehensive evaluation of system performance and contributes to more effective maintenance and decision-making for sustainable renewable energy systems.
Table 2 summarizes existing studies, highlighting the critical components that significantly and associated failure components that reduce overall system efficiency, performance and reliability across different engineering applications. These studies identified the most critical failures, emphasizing their frequency, impact, and causes. It was observed that most of the failure data were extracted from the past literature. The critical components provide a systematic understanding of the system limitations and guide towards effective risk management and prioritization efforts.
Table 2 Critical components
| El-Banby et al. (2023) | Found various failures in PV panels, such as hot spots, soiling, and electrical connections, which can cause energy loss, performance, reliability, degradation and safety hazards. |
| Libra et al. (2023) | Recognized the actual life of the PV panel, which is roughly 20–30 years that were first promised and significant malfunctions start to occur around the 10–12 years. |
| Kull et al. (2025) | Observed the common failures in the solar system, including inverter failure, grid supply, PV degradation and electrical issues, which can affect the system’s reliability, performance and safety. |
| Basu (2015) | Identified critical failure modes in rooftop PV systems, such as batteries, inverters, and wiring issues. |
| Adam et al. (2021) | Introduced the most significant failures of the pump, such as impeller, bearing, shaft sleeve, gland packing and so forth, which can interrupt the whole system or shut down the whole system. |
| Mohamad et al. (2024) | Classified the mechanical and electrical failure modes of electrical submersible pumps, such as leakage, breakage, stator winding, bearing and impeller. |
| Hendricks et al. (2015) | Detected the degradation and mechanism failure of Li batteries and applied the stresses and used conditions to time to failure. |
| Jombo et al. (2024) | Introduced the sensor failures such as saturation, spike, drift, and so forth, which can be the cause of system malfunctioning and reduced performance. |
SWS systems powered by off-grid solar PV systems are becoming a more attractive option for offering sustainable, reliable water owing to their comprising automation, low operating costs, energy independence, social benefits, and clean environmental benefits. A key challenge is that all the subcomponents of the system are critical among which the PV array, inverter, battery bank, submersible pump, startup box, and water controller sensor are complicated to the system. Failure of one subsystem or component can lead to the whole system shutting down or being in degraded states, affecting cost-effectiveness, water service dependability, performance and long-term sustainability. Although the use of solar-powered SWS systems is growing, most of the research that has been done so far has focused on straightforward, standalone PV pumping configurations and frequently used outdated failure and repair data that do not match today’s smart components, materials, and monitoring technologies. Relying on such outdated data can lead to poor choices in misleading reliability assessment and mitigation strategies. There are still comparatively few studies that assess SWS in a fully hybrid way, taking into account economic outcomes, social environmental impact, and technical performance collectively.
By conducting a thorough reliability assessment of the SWS system, the current study fills in these gaps. In contrast to earlier studies, this work:
(a) Formulates Markov process-based stochastic reliability modeling for the proposed state transition diagram of the SWS system, based on Laplace transformation and the supplementary variable approach.
(b) Utilizes a combination of recent past published literature data, expert opinions, and field surveys to ensure more realistic failure information.
(c) Modifies the traditional FMEA as Pareto RPN-based FMEA by integrating fuzzy set theory to reduce uncertainty and vagueness from the study.
The innovation of the study lies in its integrated multi-technique methodology for recognizing and ranking significant failure modes in the SWS system, utilizing efficient, system-specific data. By including a Markov process with a state transition diagram and Pareto-based fuzzy FMEA, the proposed framework not only recognizes root causes and their associated failures, but also connects them directly to service continuity. To enhance operational reliability, design, and long-term sustainability of the proposed system, this research provides authentic data and a decision-oriented methodology, especially for operational reliability and long-term sustainability.
3 System Description of Smart Water Supply System
Solar energy has become increasingly attractive and popular, due to its standalone, modular and versatile functioning abilities, making it particularly well-suited to remote or grid-prone regions. These features of solar energy systems contribute directly to enhancing reliability, durability and robustness of solar energy by reducing dependence on fuel logistics and vulnerable grid infrastructure. In this context, the proposed Smart Water Supply (SWS) system is made up of various essential and critical components, comprising the PV array, inverter, battery bank, startup box, submersible pump and sensor, which work together in a coordinated way to ensure a smooth, secure and continuous water supply under changing environmental load conditions.
PV panels are one of the most crucial parts of the system, which uses the PV effect to transform sunlight into Direct Current (DC) power. Thin-film or crystalline silicon is typically used in the individual solar cells that compose a PV panel. The main function of these cells is to convert sunlight into DC through the PV effect. The encapsulation layer usually uses a transparent, anti-reflective material, such as tempered glass, to protect the solar cells from dust, moisture and physical damage while allowing maximum solar radiation to reach the cells. The PV panel’s rear layer, which functions as an electrical insulator and supplementary moisture protection. It is often made of a polymer material that has excellent electrical insulating properties (Libra et al., 2023). The system is an independent solar PV system that produces a sufficient amount of energy to guarantee a steady supply of power, since the PV panels are connected to the battery bank and the DC link enables both charging and discharging activities. When solar energy levels drop throughout the night or in extreme weather, it saves enough amount of energy generated by the PV panels during periods of intense sunlight.
System invert is one of the most critical component of the entire SWS system. It provides a highquality Alternating Current (AC) to the system. An inverter converts DC power into AC power and vice versa. The inverter printed circuit boards are referred to as boards, which are intended to reduce electrical noise, parasitic reduction and thermal management, heat sinks, and switching components, including Insulated Gate Bipolar Transistors (IGBTs), which are three-terminal solid-state semiconductor switches that enable efficient power transfer. These types of electric components, including a cooling fan, regulate the temperature. Capacitors are designed to deliver a stable DC rail voltage to the inverter input while storing energy to mitigate voltage fluctuation during operating conditions. Fuses consist of a low-resistance metallic element enclosed in non-flammable material and provide overcurrent protection. Ground Fault Interrupter (GFI) components are used to compare the current in the neutral and the ungrounded conductor and disconnect the circuit when a ground fault is detected (Kull et al., 2025).
The startup boxes are connected to the inverter, which delivers the rectified AC signal to the submersible pump. The startup box provides initial high torque for motor operation, while capacitors are used to spin up the submersible against water; a voltmeter and ammeter monitor the voltage and current to avoid damage from fluctuation.
A submersible pump is a multistage centrifugal pump operating on a vertical axis immersed in water. An electric motor rotates a shaft connected to a series of impellers, where the mechanical energy is converted into kinetic energy. Then, water enters the pump through an intake screen and is lifted by the pump through different stages. Other parts comprise the radial bearing distributed along the length of the shaft to provide radial support. An operational thrust bearing takes up part of the axial forces arising in the pump (Mohamad et al. 2024). The water level sensor is placed in the water tank and connected to the submersible startup boxes, which detect and measure the water level in the water tank. A mini controller chip is used to handle the overall system automatically, which reduces the design and control complexity. Usually, it measures the space between sensors and the existence of water in the tank and uses the information to detect the water level, trigger the alarm, control the pumps and provide input data to the automatic cutoff system, which ensures suitable water management to prevent overflow or water shortage. Figure 2 shows a comprehensive diagram of the proposed SWS system, illustrating its five major subsystems and eight critical components that constitute the basis for the reliability assessment and failure modes analysis.
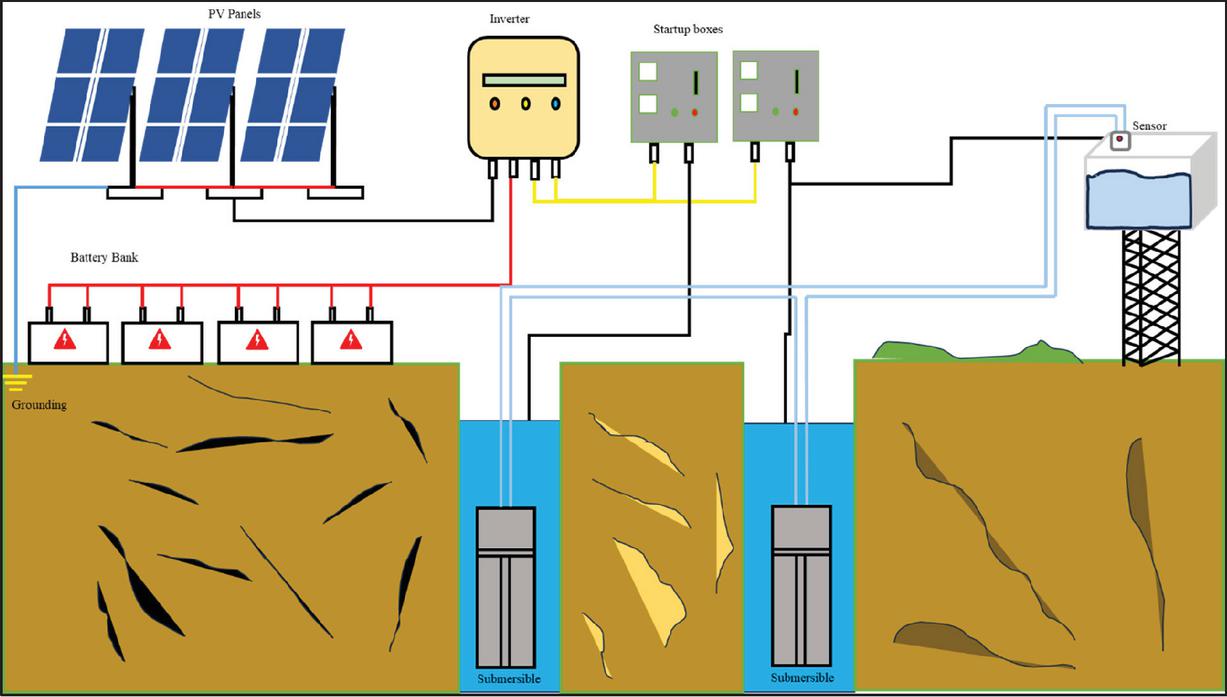
Figure 2 Smart water supply (SWS) system.
4 Proposed Methodological Framework
In this study, the proposed system initially examines the reliability using the Markov Process. After analyzing reliability indices, the study further identifies the critical failure modes using fuzzy FMEA and Pareto analysis.
4.1 Markov Model and System Circuit Diagram
In this study, the proposed SWS system model comprises five interconnected subsystems, which are connected in a series configuration: A1, A2, A3, A4 and A5. However, subsystem A1 consists of a parallel connection of PV panels (C1) and batteries (C2), ensuring energy storage and continued power supply. Subsystem A2 contains one component, i.e the inverter (C3), which is arranged in a series configuration with subsystem A1 to provide a smooth conversion of DC power into AC power. Furthermore, subsystem A3 controls two components, i.e., the startup boxes (C4) and (C5), respectively, configured in a parallel configuration to optimize operational redundancy and controlled reliability. Similarly, subsystem A4 comprises two submersible pumps in parallel configuration (C6) and (C7) to maintain an uninterrupted water supply system even with one of the components failing. The last subsystem, A5, operates the water level using an auto cut-off sensor (C8), which regulates the system water supply and offers automated protection against dry run conditions and overflow of water. Figures 3 and 4 depict the SWS system circuit block diagram and the transition state diagram, respectively. Figure 3 illustrates a series-parallel configuration of the proposed system, including five major subsystems (A1), (A2), (A3), (A4) and (A5) and eight critical components (C1), (C2), (C3), (C4), (C5), (C6), (C7) and (C8).
The following assumptions have been considered before solving the Transition state diagram.
(a) At the initial stage, all the components are functioning perfectly.
(b) At any time, the system can be in one of the nine states, such as good, degraded, and failed states.
(c) All failure rates and repair rates are supposed to be constant with time.
(d) Only one change is allowed at a time in the transition.
(e) Sufficient repair is available.
(f) The system may work with low efficiency.
(g) The system has completely failed if any one subsystem has failed.
(h) The system works satisfactorily after repair.
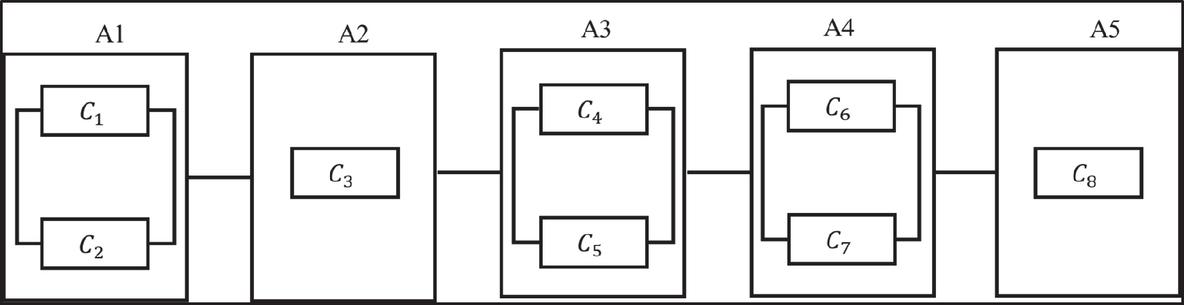
Figure 3 SWS system block diagram.
The description of all transition states, repair rate, failure rates, functional and breakdown states probability of the proposed SWS system, listed symbols and notations are given in Table 3.
Table 3 Notations
| Notation | Description |
| All states are in working condition | |
| Degraded states due to the failure of one component of the subsystem – | |
| Degraded states due to the failure of one component from the subsystem – | |
| Degraded states due to the failure of one component from the subsystem – | |
| Failed states, due to a completely failed subsystem – | |
| Failed states, due to a completely failed subsystem – | |
| Failed states, due to a completely failed subsystem – | |
| Failed states, due to a completely failed subsystem – | |
| Failed states, due to a completely failed subsystem – | |
| Laplace Transform variable | |
| Failed states of the system, , where | |
| Laplace transformation of failed states as well as degraded states and | |
| Repair rate for all completely broken-down states, i.e. | |
| Failure rate for PV panels, inverter, pumps startup box, pumps, sensor, human failure, failure rate of subsystem i.e., pump failure, failure rate of the whole subsystem i.e., PV and battery bank, respectively. | |
| Probability of all functional states, degraded as well as fully functional states | |
| Probability of all breakdown states, failed states only |
4.1.1 Mathematical formulation of the proposed model
The Russian mathematician, Andrey Andreyevich Markov, developed the idea of a stochastic process now called Markov chain, a mathematical model of how a system varies over time between different states, such as good, degraded and failed. The process demonstrates the memoryless property, which means that the probability of transitioning to the next state is only dependent on the present state. This technique takes into account the repair and failure rates of each component to evaluate the system’s performance and reliability. The mathematical formulation of the proposed system is presented using the Markov process. Further, the mathematical formulation of the SWS system transition states model is provided below and Figure 4 illustrates the nine different types of transition states of the SWS system, in which circle shape represent fully functional state, rhombuses denote partially working states, and rectangle shapes indicate fully failed states. All transition states show the system’s degradation and recovery behavior over time.
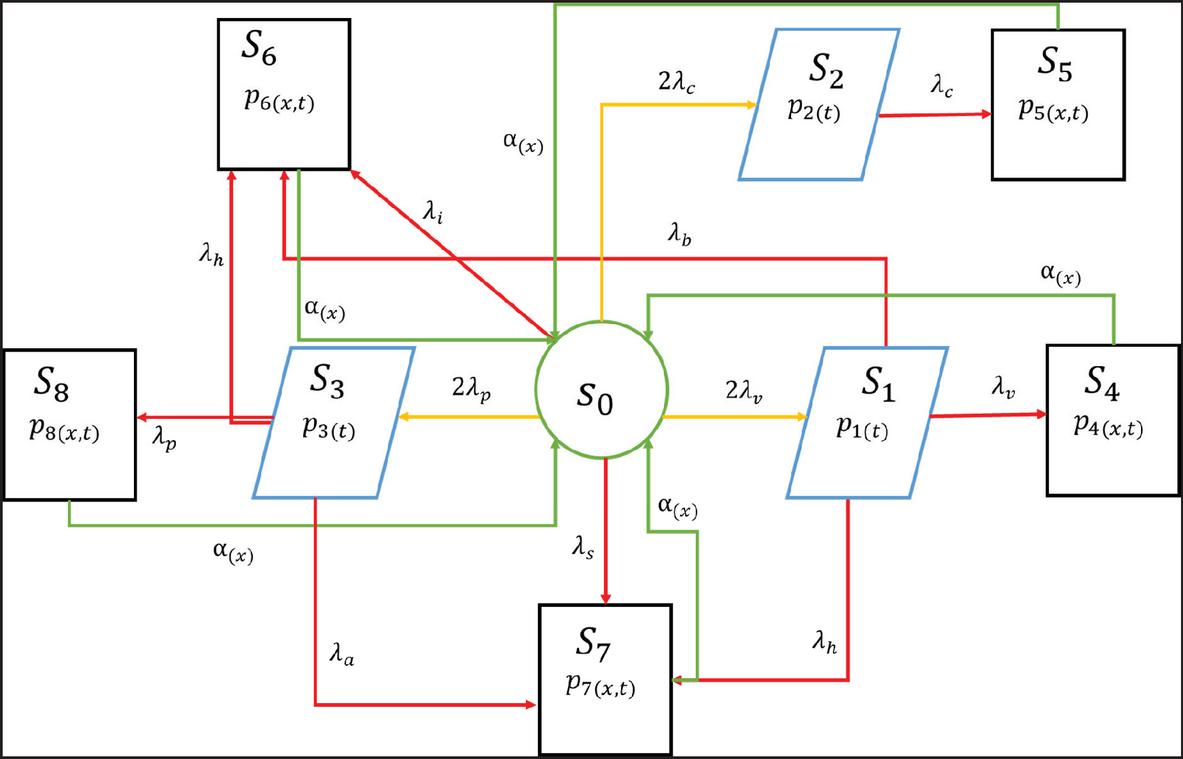
Figure 4 Transition state diagram of the SWS system.
The mathematical formulation for the proposed SWS system is based on the state transition diagram. The following differential equations are derived using techniques such as the Markov process and supplementary variable technique to represent the behavior of the proposed SWS system.
Equations (1), (2), (3) and (4) represent the state probabilities differential equations of a fully operational and degraded states of the system, respectively.
| (1) | ||
| (2) | ||
| (3) | ||
| (4) |
And now, Equations (5), (6), (7), (8) and (9) represent the state probabilities differential equation of a failed state of the system.
| (5) | |
| (6) | |
| (7) | |
| (8) | |
| (9) |
Boundary conditions:
| (10) | |
| (11) | |
| (12) | |
| (13) | |
| (14) |
At the initial condition and after . All other state probabilities are zero.
Applying Laplace Transformation from Equations (1)–(14), we get Equations (15)–(23).
| (15) | ||
| (16) | ||
| (17) | ||
| (18) | ||
| (19) | ||
| (20) | ||
| (21) | ||
| (22) | ||
| (23) |
Boundary Conditions with Laplace Transformation:
| (24) | |
| (25) | |
| (26) | |
| (27) | |
| (28) |
After solving Equations (15)–(23) with the help of Equations (24)–28, we get –
| (31) | ||
| (32) | ||
| (33) | ||
| (34) | ||
| (35) | ||
| (36) | ||
| (37) | ||
| (38) | ||
| (39) |
The Laplace transformation of the system’s up states (i.e good and degraded states) probability is thus obtained as follows:
| (40) |
And the Laplace transformation for the probability of the down states corresponding to the failed state is determined as:
| (41) |
4.1.2 Overall reliability assessment of the SWS system
The reliability, availability, MTTF, and expected cost analysis have been carried out for the overall reliability assessment of the SWS system.
I. Reliability Analysis
Reliability is the probability that a system performs its best operation under a given situation for a given interval of time (Patil et al., 2024). To assess the reliability of the proposed system, the failure rates are considered as , and , and the repair rate is set as . Putting it in Equation (40) and applying the Laplace transformation, the reliability of the system is computed as:
| (42) |
Now, simulating time between units in Equation (42), the system reliability obtained is enumerated in Table 4, followed by its graphical representation in Figure 5. The reliability table and graph show that the probability of the system operating without repair decreases extensively as time progresses. Initially, a sharp fall in reliability can be seen in Figure 5, suggesting a relatively high failure rate. Subsequently, the rate of degradation becomes more gradual, showing a slower reduction in reliability as the SWS system’s lifespan. Ultimately, the reliability almost tends to zero for the given time interval.
Table 4 System reliability
| Time (t) | Reliability |
| 0 | 1.0000 |
| 2 | 0.7384 |
| 4 | 0.5538 |
| 6 | 0.4233 |
| 8 | 0.3308 |
| 10 | 0.2650 |
| 12 | 0.2180 |
| 14 | 0.1842 |
| 16 | 0.1597 |
| 18 | 0.1417 |
| 20 | 0.1284 |
II. Availability Analysis
After assessing the reliability of the system over time to units, the availability for the overall system is observed for the same time period. Availability is defined as the probability that a system performs satisfactorily at any given point in time (Li, 2014). Considering the same failure rates as, , and (Kumar et al., 2022; Nagarajan et al., 2019), and repair rate , in Equation (40), the availability of the system is calculated as:
| (43) |
Again, simulating time units in Equation (43), the system availability is listed in Table 5, followed by its graphical representation in Figure 5 compared with reliability. Initially, the system performs its intended function at . As operating time increases, the availability decreases slightly, reaching its minimum value at (), due to system instability or initial component failures. After some time, the availability shows a consistent rising trend starting from () and approaches a nearly constant value over the time interval, this behaviour indicating that the system reaches a stable long-term functioning state.
Table 5 System availability
| Time (t) | Availability |
| 0 | 1.0000 |
| 2 | 0.8821 |
| 4 | 0.8743 |
| 6 | 0.8772 |
| 8 | 0.8808 |
| 10 | 0.8844 |
| 12 | 0.8877 |
| 14 | 0.8909 |
| 16 | 0.8938 |
| 18 | 0.8966 |
| 20 | 0.8992 |
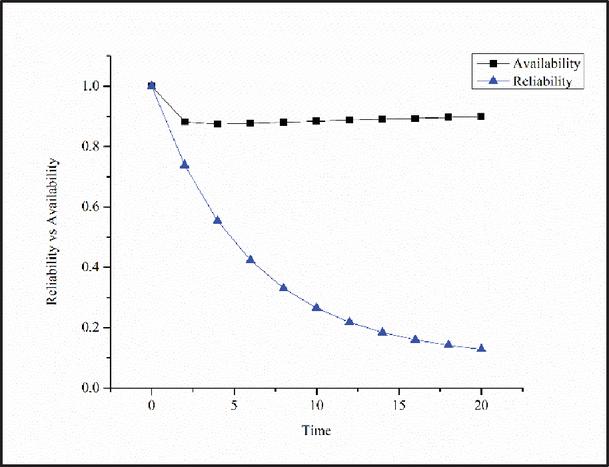
Figure 5 Reliability and availability graph.
III. Mean-Time-to-Failure (MTTF) Analysis
MTTF is that characteristic of reliability which represents the average time of how long the system works before it breaks down before each failure (Shivani et al., 2023; Toraman, 2023). To evaluate the MTTF of the system, the repair rate is assumed to be zero, and the limit as is applied to Equation (40). The resultant MTTF formula is given by,
| (44) |
Now, varying the failure rates as – 0.10, 0.15, 0.20, 0.25, 0.25, 0.30, 0.35, 0.40, 0.45 and 0.50 in Equation (44), the MTTF values are computed as shown in Table 6; graphically represented in Figure 6. The given figure and table show the behaviour of each failure rate with time.
Table 6 MTTF values
| Variation in Failure Rates | ||||||||
| 0.10 | 9.3727 | 8.8843 | 10.0393 | 11.4630 | 8.9301 | 10.2701 | 8.4606 | 9.4931 |
| 0.15 | 8.0490 | 7.6345 | 8.0417 | 10.0393 | 8.0417 | 10.2649 | 8.4373 | 9.4751 |
| 0.20 | 7.0504 | 6.6890 | 6.7071 | 8.9301 | 7.3140 | 10.2623 | 8.4256 | 9.4660 |
| 0.25 | 6.2714 | 5.9506 | 5.7524 | 8.0417 | 6.7071 | 10.2608 | 8.4185 | 9.4605 |
| 0.30 | 5.6472 | 5.3585 | 5.0357 | 7.3140 | 6.1932 | 10.2597 | 8.4138 | 9.4568 |
| 0.35 | 5.1358 | 4.8733 | 4.4777 | 6.7071 | 5.7524 | 10.2590 | 8.4104 | 9.4542 |
| 0.40 | 4.7092 | 4.4686 | 4.0311 | 6.1932 | 5.3702 | 10.2584 | 8.4079 | 9.4522 |
| 0.45 | 4.3470 | 4.1258 | 3.6665 | 5.7524 | 5.0357 | 10.2580 | 8.4059 | 9.4507 |
| 0.50 | 4.0383 | 3.8319 | 3.3607 | 5.37029 | 4.7403 | 10.2576 | 8.4043 | 9.4494 |
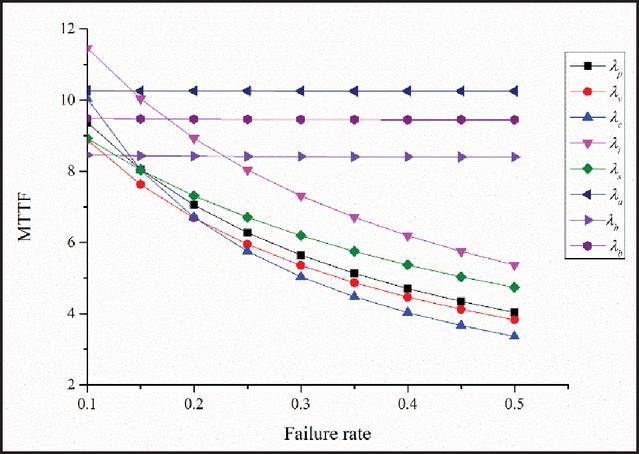
Figure 6 MTTF graph.
IV. Cost Analysis
It is the systematic process of analyzing and estimating the associated costs of the system. If the service facility is thought to be always accessible, the expected profit accounting for service expenses for the time range (0, t] is,
| (45) |
Utilizing Equation (40) in Equation (45) and setting and varying , or 0.5, respectively, the expected profit is calculated as seen in Table 7; the graphical trend can be seen in Figure 7. Here, represents the revenue per unit time and represents the service cost per unit time. The prediction is that each curve initially climbs as time passes, depicting that the system continues to produce revenue as long as it is operational, prior to the accumulation of service expenses having a critical impact.
Table 7 Expected profit of the system
| Time (t) | |||||
| 0 | 0 | 0 | 0 | 0 | 0 |
| 1 | 0.8326 | 0.7326 | 0.6326 | 0.5326 | 0.4326 |
| 2 | 1.6060 | 1.4060 | 1.2060 | 1.0060 | 0.8060 |
| 3 | 2.3679 | 2.0679 | 1.7679 | 1.4679 | 1.1679 |
| 4 | 3.1309 | 2.7309 | 2.3309 | 1.9309 | 1.5309 |
| 5 | 3.8978 | 3.3978 | 2.8978 | 2.3978 | 1.8978 |
| 6 | 4.6683 | 4.0683 | 3.4683 | 2.8683 | 2.2683 |
| 7 | 5.4420 | 4.7420 | 4.0420 | 3.3420 | 2.6420 |
| 8 | 6.2181 | 5.4181 | 4.6181 | 3.8181 | 3.0181 |
| 9 | 6.9961 | 6.0961 | 5.1961 | 4.2961 | 3.3961 |
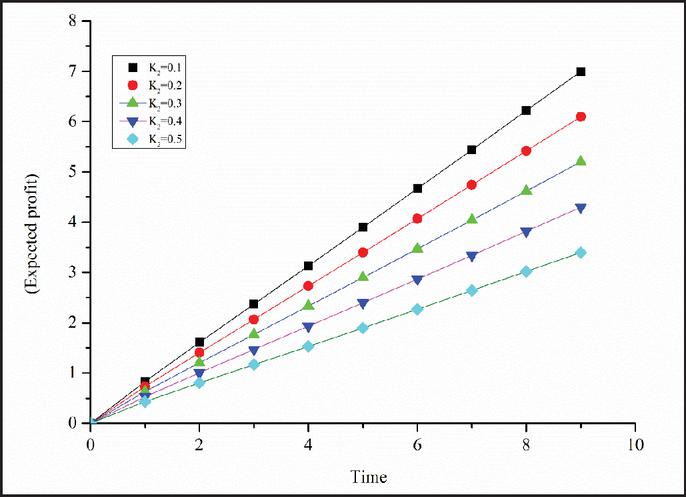
Figure 7 Expected profit representation.
4.2 FMEA Analysis
The FMEA is a structured approach that includes a series of systematic steps. Firstly, a cross-functional team is formed, including various experts from different fields (see Appendix A), such as researchers, engineers, and field experts, to accurately recognize and analyze possible failures. The proposed system is further decomposed into subsystems at the component level to understand interdependencies within the system, which is immensely crucial. To ensure both practical and theoretical validation, failure modes, their causes, and effects are observed through the collected data from previously published literature, expert opinions and field surveys. Subsequently, each failure mode is assessed in terms of three risk parameters, namely Occurrence (O), Severity (S) and Detection (D), based on a numerical crisp scale/fuzzy scale. Then, a Risk Priority Number (RPN) is calculated and used to examine the critical failure modes of the system, using the product of the three risk parameters i.e.
| (46) |
In this study, a thorough examination of the failure modes was performed using the literature on reliability and FMEA applications in similar technologies. Initially, a list of 25 possible failure modes was identified, covering subsystem levels, component levels and system operational issues related to the investigated system. This first extraction of the failure modes from the published literature and standards led to the preliminary set that contained both commonly reported and less evident but highly consequential failures. These 25 failure modes were validated by experts to enhance the practical application to the proposed system. In order to determine which failure modes are actually significant in the current operational environment, a cross-functional team of domain experts examined the failure modes. After this screening, 18 failure modes were identified and finalized for further examination, while 7 were removed as either obsolete, redundant, or insignificant in practice. For each of the 18 selected failure modes, the experts then gave their views on the traditional FMEA risk parameters O, S and D utilizing the linguistic scales. Finally, the RPN values and risk for each mode was calculated using the traditional FMEA formula. In this study, a different approach including fuzzy metrics was involved in calculating the RPN. Figure 8 gives a complete flowchart of the FMEA methodology employed in this study.
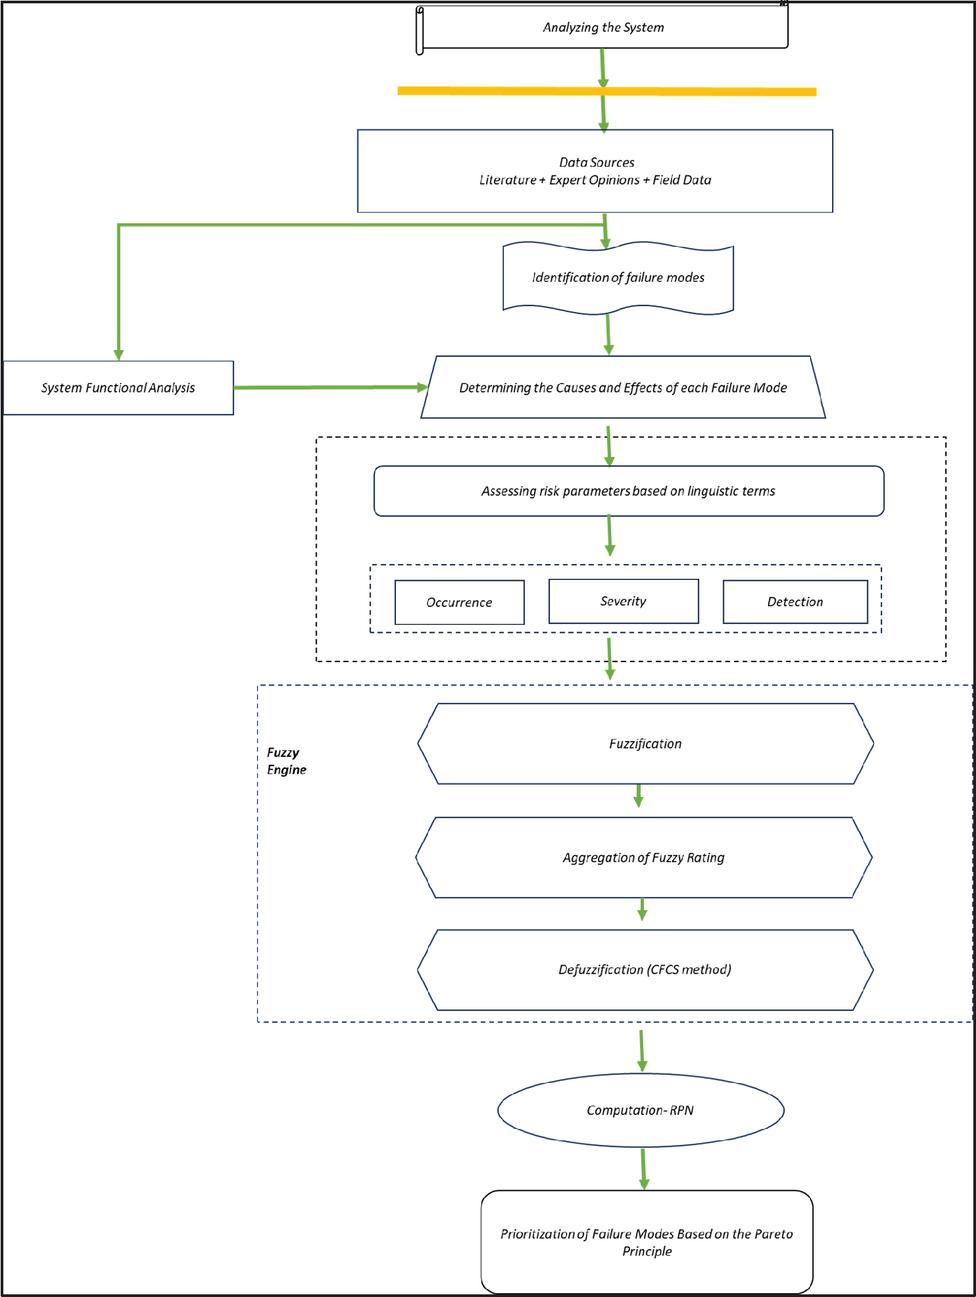
Figure 8 FMEA flow chart.
Table 8 presents the 18 significant failure modes recognized by a comprehensive review of the published literature and experts’ consultations, as recommended.
Table 8 18 significant failure modes identified
| S. No. | Failure Modes | Cause | Effects | References |
| PV Panel | ||||
| Breakage of glass or physical damage | External stress, improper handling during installation | Reduction in output power, cell damage | Basu (2015) | |
| Soiling and dust accumulation | Bird dropping, dirt accumulation | Decreased light penetration, reduced power output | Mustafa et al. (2020) | |
| Hotspot | Manufacturing defects, partially shading | Potential fire hazard, heating, and cell delamination | El-Banby et al. (2023) | |
| Battery Storage | ||||
| Bulging or swelling of the battery | Thermal runaway, overcharging, internal short circuit | Electrolyte may be leakage, reduced battery life, fire | Naccon (2025) | |
| Insufficient ventilation causing overheating | High ambient temperature, battery enclosure design flow | Reduction in backup, reduced battery life, explosion | Kirana et al. (2023) | |
| Terminal corrosion loose connection | Humidity and moisture ingress, poor terminal coating | Voltage drops, insufficient power supply | Sonawane et al. (2023) | |
| Hybrid Inverter | ||||
| Overheating and derating | Maximum load operation, inadequate cooling system, high ambient temperature | System shutdown, power reduction, reduced power conversion | Basu (2015) | |
| Internal hardware failure | Critical components failure, PCB damage | Whole system shutdown, no power conversion, erratic behaviour | Wang et al. (2026) | |
| Corroded or burnt terminal | Over current heating, loose connection causing arcing, humidity | Fire hazard, increased resistance and heating, components damage | Wang et al. (2025) | |
| Earth fault or insulation failure | Improper cable routing, voltage surge | Electric risk, fire risk, ground fault trip | Osmani et al. (2023) | |
| Submersible Pump | ||||
| Mechanical wear of impeller or bearing | Abrasive particles in water, lack of lubrication, material fatigue | Shaft damage, whole pump failure, bearing seizure, noise and vibration | Mohamad et al. (2024) | |
| Motor winding failure or burnt-out | Voltage imbalance, poor insulation, overloading | Pump failure, low efficiency | Pietrzak and Wolkiewicz (2021) | |
| Shaft seal leakage | Corrosion of shaft, thermal expansion differential | Pump failure, bearing corrosion, low efficiency | Mohamad et al. (2024) | |
| Clogging of pump inlet or impeller | Debris accumulation, suspended solid in water | Reduced in flow rate, pump overheating | Sunal et al. (2022) | |
| Water Level Sensor and Controller | ||||
| Saturation fault | Electrical interference, component saturation, water level sensor range | Inaccurate reading, pump fails to start, overflow | Pérez-Padillob et al. (2022) | |
| Float switch mechanical jam or blockage | Cable tangling, corrosion causing sticking, debris accumulation in sump | Overflow or dry running, pump fails to start, wastage of water | Sadeghioon et al. (2014) | |
| Wiring and Interconnection | ||||
| Improper installation or loose connection | Unexperienced mechanic, vibration loosening connection | Components damage, fluctuation in voltage, system shutdown | Tariq et al. (2018) | |
| Fuse or circuit breaker failure | Moisture ingress, overcurrent from short circuit, aging of fuse element | Fire hazard, inability to isolate faults, protection device failure | Nagarajan et al. (2019) | |
Further, these 18 failure modes are evaluated based on their occurrence (O), severity (s) and detection (D). ‘O’ represents the probability of the failure happening, ‘S’ represents how severe the failure may harm the system and ‘D’ represents how likely the failure can be detected (Balaraju et al., 2019). Later, each expert assigns numerical values to each risk parameter based on a given linguistic scale proposed by the authors after a deep systems functional analysis. Relatively higher RPNs represent critical failure modes that need attention and require immediate fixing. Similarly, failure modes with relatively lower RPNs have lower risk or are less critical for the system.
The RPN technique possesses the strength to recognize the most critical failures in the system and suggest appropriate mitigation strategies to enhance performance reliability and design. However, the traditional RPN technique is criticized by many researchers working in this field for the following reasons. Firstly, RPN can give identical results, such as if the values of O, S, and D, are (2, 3, 1) and (1, 2, 3), both products will yield the same RPN of 6. But this does not accurately predict how RPNs of different failure modes differ for each risk parameter. Secondly, there is a lack of understanding or ambiguity; sometimes it is challenging for experts to provide a crisp number for risk parameters. These two limitations are the ones that have been mostly criticized in the past literature and continue to limit the technique’s sensitivity in distinguishing between risk parameters.
Table 9 Rating scale for occurrence
| Rating Scale | Symbol | Expected Frequency |
| (1,1,3) | VL | Very rare, once in 10-15 years |
| (1,3,5) | L | Unlikely, roughly occurring once in 5-10 years |
| (3,5,7) | M | Occasionally, about once in 1-5 years |
| (5,7,9) | H | Frequently, few times in a year |
| (7,9,10) | VH | Extremely frequent or chronic, many times per year |
To bridge this gap, the proposed study uses an integrated framework that associates crisp numbers to fuzzy numbers, so that it becomes easier for the experts to rate the risk parameters. This way, the technique enhances experts’ ability to express their opinions using fuzzy linguistic phrases. Linguistic terms are verbal labels such as very low (VL), low (L), medium (M), high (H) and very high (VH), considered as the values of linguistic terms in fuzzy logic. Each linguistic term is denoted mathematically by a fuzzy set (often used as a triangular or trapezoidal fuzzy number) based on a numerical scale. The concept of linguistic terms was developed by Lotfi A. Zadeh, providing a formal approach to computing with words rather than exact numbers (Zadeh, 1965). The linguistic terms avoid the inherent vagueness in expert evaluations and focus on more realistic and precise integer ratings (Zadeh, 1975). The rating scales based on the fuzzy linguistic terms for each parameter, O, S and D, are provided in Tables 9, 10 and 11, respectively.
Scale for ‘O’ is based on the likelihood of a particular failure occurring in the system. The evaluation is conducted using a time range that spans from 1 year to 10-15 years. A ‘very high’ rating depicts high failure frequency, while a ‘very low’ rating depicts very low failure frequency (number of times per year), as shown in Table 9 (Chang et al.,2025).
Scale for ‘S’ is defined based on disruption or impact of that particular failure mode on the overall system. The evaluation is conducted based on the unavailability of the system (long outage). A ‘very high’ score depicts non-availability of water supply to the whole community (long outage), while a ‘very low rating depicts short disruptions. (1 hour), as shown in Table 10.
Table 10 Rating scale for severity
| Rating Scale | Symbol | Expected Disruption |
| (1,1,3) | VL | Very short disruption (minutes-1 hour) |
| (1,3,5) | L | Short interruption (up to a few hours) |
| (3,5,7) | M | Interruption for 24 hours or more; noticeable inconvenience |
| (5,7,9) | H | Non availability of water supply for one more day; people are affected |
| (7,9,10) | VH | Long or large-scale outage; non-availability of water (affects whole community) |
Scale for ‘D’ is defined based on the detection rate for that particular failure mode. The evaluation is conducted using the detection capability. A ‘very high’ rating means very difficult to detect, while a ‘very low’ rating depicts very easy to detect (visually), as shown in Table 11.
Table 11 Rating scale for detection
| Rating Scale | Symbol | Expected Detectability |
| (1,1,3) | VL | Can be visually detected immediately |
| (1,3,5) | L | Usually detected by routine check-up or standard alarms |
| (3,5,7) | M | Requires planned inspection or data analysis |
| (5,7,9) | H | Unlikely to be found in normal check-up; special team needed |
| (7,9,10) | VH | Almost impossible to detect before impact; no effective monitoring |
Thereafter, 8 questionnaires were developed by the authors for the experts to rate each of the 18 failure modes according to the three rating scales of O, S, and D. The RPN was then calculated for each of the failure modes, and the ratings were analyzed for the final risk assessment. A defuzzification technique known as the CFCS method (Converting Fuzzy Data into Crisp Scores) was used for converting fuzzy numbers into crisp numbers. This approach was established in the early 2000s by S. Opricovic and G.-H. Tzeng. It was developed to convert triangular fuzzy numbers (TFNs) into precise, non-fuzzy scores, specifically for use in Multi-Criteria Decision Making (MCDM) models, to better represent the form, distribution and location of a fuzzy number on the real line. In the CFCS approach, the right and left scores of linguistic terms are calculated by utilizing the fuzzy min and fuzzy max operators. By calculating a weighted average based on the membership function. (Opricovic and Tzeng, 2003; Kazancoglu et al., 2018). The following steps are used in the CFCS approach:
Step (1): Normalization
Step (2): Determine left and right normalized score Left score
Right score
Step (3): Total normalized crisp value
Step (4) Final crisp value
Table 12 shows the results of the final calculated RPN and Risk% for each failure mode in decreasing order.
Table 12 Pareto-Based RPN
| Failure Modes | O | S | D | RPN | Risk% | Cumulative % |
| 4.14 | 5.60 | 5.00 | 115.95 | 7.55 | 7.55 | |
| 4.48 | 5.49 | 4.67 | 114.59 | 7.46 | 15.02 | |
| 6.91 | 5.51 | 2.96 | 112.77 | 7.35 | 22.36 | |
| 4.71 | 5.04 | 4.33 | 102.99 | 6.71 | 29.07 | |
| 4.19 | 5.35 | 4.39 | 98.33 | 6.40 | 35.47 | |
| 5.00 | 4.79 | 4.00 | 95.83 | 6.24 | 41.71 | |
| 4.13 | 4.88 | 4.71 | 94.80 | 6.17 | 47.89 | |
| 3.90 | 5.75 | 4.00 | 89.80 | 5.85 | 53.74 | |
| 4.76 | 5.00 | 3.72 | 88.60 | 5.77 | 59.51 | |
| 4.43 | 4.75 | 4.06 | 85.30 | 5.56 | 65.06 | |
| 3.62 | 4.85 | 4.67 | 81.86 | 5.33 | 70.40 | |
| 4.48 | 4.29 | 4.00 | 76.83 | 5.00 | 75.40 | |
| 3.86 | 4.85 | 4.06 | 75.82 | 4.94 | 80.34 | |
| 4.14 | 4.76 | 3.78 | 74.53 | 4.85 | 85.19 | |
| 3.14 | 5.86 | 3.57 | 65.79 | 4.29 | 89.48 | |
| 3.57 | 4.64 | 3.39 | 56.13 | 3.66 | 93.14 | |
| 3.57 | 4.00 | 3.72 | 53.17 | 3.46 | 96.60 | |
| 2.81 | 4.29 | 4.33 | 52.23 | 3.40 | 100.00 |
4.3 Pareto Analysis
In the Table, the Pareto distribution was applied next. The Pareto distribution with a 60% threshold limit represents a few vital failure modes that may contribute to extreme disruption in the overall system. The distribution showed that out of 18 failure modes, 9 failure modes – , are the most critical ones affecting the complete SWS system performance and reliability. These 9 critical failure modes collectively depict the key area requiring priority attention for reliability enhancement and maintenance optimization.
Pareto analysis is a statistical decision-making technique in reliability engineering and quality control that is used to examine and rank the most significant risk factors contributing to system failures. This analytical technique is based on the Pareto principle, typically known as the 80/20 rule, which states that about 80% of a system’s issues or flows are caused by just 20% of the underlying causes. The noticeable point is that the sum of assumed values must be 100 (Çıtıroğlu et al., 2022). The American Society for Quality (ASQ) has recognized the Pareto principle, sometimes referred to as the rule of 80/20 (Alkiayat, 2021). The perception of the Pareto principle was established in the century by Vilfredo Pareto. In this analysis, a single ratio is applied throughout: the (60/40) ratio, which represents that 40% of the failure modes create 60% of the major problems.
Figure 9 represents the Pareto chart that ensures a clear distribution of the critical failure modes. A Pareto chart is a bar graph with contributing factors grouped in descending order by frequency on the x-axis and y-axis and percentage on the z-axis. A significant section of the Pareto chart is the line that represents the cumulative percentage of the variables; when the line crosses a set threshold limit, all the previously added factors show causes for these factors (the vital few).
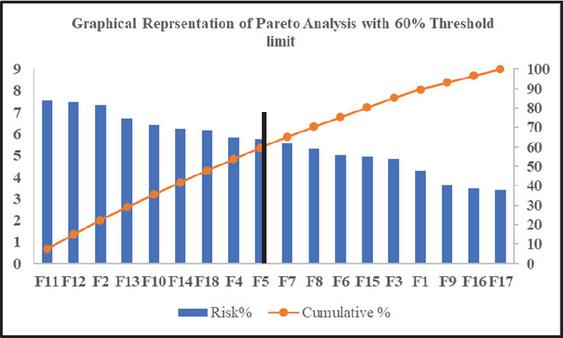
Figure 9 Pareto chart.
For better understanding, Table 13 provides the list of the most critical potential failure modes with a threshold. The 9 failure modes, namely and , jointly account for 59.51% of the total contribution; the majority of the total that requires immediate attention.
Table 13 Identified critical failure modes
| S. No. | Failure modes | Cumulative % |
| Mechanical wear of impeller or bearing | 7.55 | |
| Motor winding failure or burnt out | 15.02 | |
| Soiling and dust accumulation | 22.36 | |
| Shaft seal leakage | 29.07 | |
| Earth fault or insulation failure | 35.47 | |
| Clogging of pump inlet or impeller | 41.71 | |
| Fuse or circuit breaker failure | 47.89 | |
| Bulging or swelling of the battery | 53.74 | |
| Insufficient ventilation causing overheating | 59.51 |
The primary contributor, (mechanical wear of impeller or bearing), suggests that a critical flaw in the pump subsystem is the long-term mechanical deterioration of spinning components. This result usually arises from continuous operation under varied loading, misalignment, or insufficient lubrication, which increases clearance and speeds up surface fatigue, ultimately decreasing hydraulic efficiency and raising the risk of breakdown. The second most critical failure is (motor winding failure or burnt out), which reflects weakness in the electrical drive unit. Partial discharge and subsequent turn-out, or phase-to-phase faults in the stator windings, can be caused by overloading, voltage imbalance, prolonged overheating, or insulation aging. This can result in an abrupt loss of drive torque and unscheduled downtime. (soiling and dust accumulation) is a major surface contamination issue that is especially related to solar-powered outdoor installations. Dust, mud, and other particle deposits on panels, enclosures, or cooling routes degrade component life by reducing effective heat dissipation and energy conversion efficiency. They may also encourage corrosion and isolated hotspots.
(shaft seal leakage), indicates weak sealing integrity at the pump-motor interface. Leakage of the working fluid might result from poor installation, progressive loss of mechanical seals, or brief pressure surges. This can lower discharge pressure, allow pollutants to enter, and further deteriorate bearings and windings due to moisture intrusion. (earth fault or insulation failure) captures electrical insulation failure between live conductors. In addition to disrupting regular system operation, aging, mechanical damage to cables, moisture intrusion, or frequent heat cycling can lower insulation resistance, resulting in leakage currents, protection-device tripping, and possible safety risks. (clogging of pump inlet or impeller) reflects hydraulic obstructions brought on by suspended solids, sludge, or debris entering the suction side. A partial or whole blockage of the impeller eye or inlet lowers flow rate, increases vibration and suction losses, and may cause cavitation, which speeds up wear on the impeller and related components. (fuse and circuit breaker failure) indicates that protection devices are malfunctioning or operating improperly. The entire electrical protection mechanism can become unreliable due to nuisance tripping, contact welding, erroneous rating selection, or end-of-life aging, which can either hinder real fault clearing or cause needless disruptions.
(bulging or swelling of the battery), is usually caused by overcharging, excessive internal temperature, gas buildup, or electrolyte imbalance. If left untreated, bulging is an outward sign of interior structural stress and capacity loss that can lead to leakage or catastrophic battery collapse. Similarly, (insufficient ventilation causing overheating) captures inadequate thermal management in enclosures, control panels, or battery banks. Elevated internal temperatures may result from poor airflow, blocked vents, or dense component arrangements. This condition can accelerate the aging of batteries, insulation, and electronic components, thereby increasing the risk of temperature-related failures.
The aggregated ratings of each risk parameter O, S, D according to the 8 experts are presented in Figures 10–12.
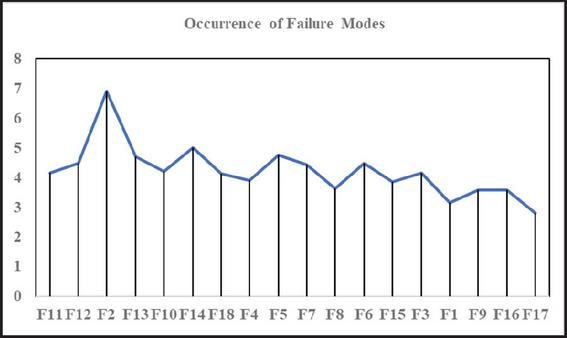
Figure 10 Occurrence ratings.
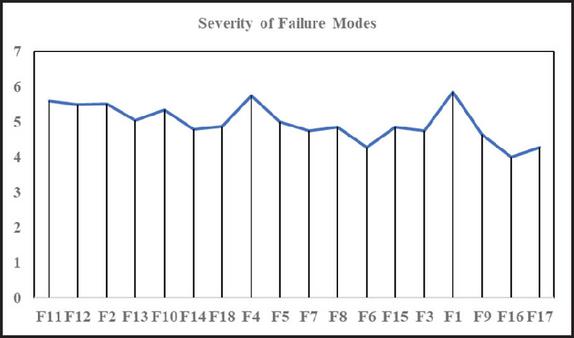
Figure 11 Severity ratings.
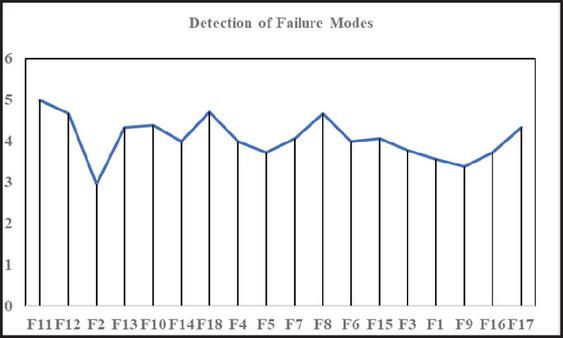
Figure 12 Detection ratings.
4.4 Criticality Analysis of the Subsystems
This section discusses those highly sensitive components (individual subsystems) and the failures of the SWS system, which cause high interruption in the whole operation.
(a) Submersible Pump
Figure 13 illustrates the criticality ranking of the submersible pump components based on RPN, Risk % and Cumulative % contribution. Among all the failure modes, (mechanical wear of impeller or bearing) arises as the most significant failure with highest RPN value 115.95 (Risk % 7.55, and Cumulative ) followed closely by (motor winding failure or burnt out) at RPN value 114.59 (Risk , Cumulative ), (shaft leakage) with RPN value 102.99, (Risk , and Cumulative ). Similarly, (clogging of pump inlet or impeller) with RPN value 95.83 (Risk , Cumulative ). Similarly, (fuse and circuit breaker failure) at RPN value 94.80 (Risk , Cumulative ).
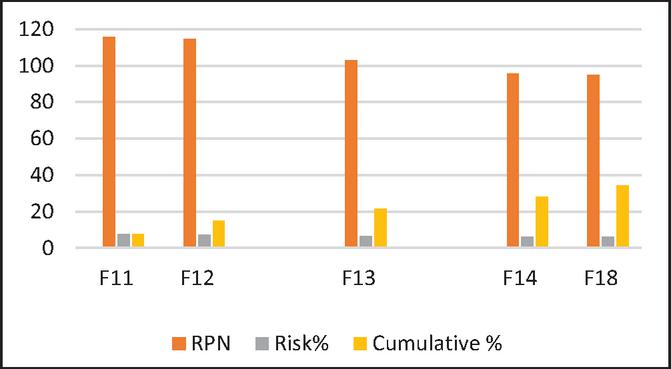
Figure 13 RPN, Risk % and Cumulative % of the Submersible pump.
(b) PV Subsystem
The PV system major failures include (soiling and dust accumulation), (earth fault or insulation failure – included as the part of the PV circuit), (bulging of battery-included as the part of the PV circuit) and (insufficient ventilation causing overheating) at RPN values 112.77, 98.33, 89.80, 88.60 (Risk 7.35, 6. 40, 5.85, 5.77, Cumulative 7.35, 13.75, 19.6, 25.37). The PV subsystem is the second most sensitive in the SWS system, accounting for 25.37% of the overall system risk, as shown in Figure 14.
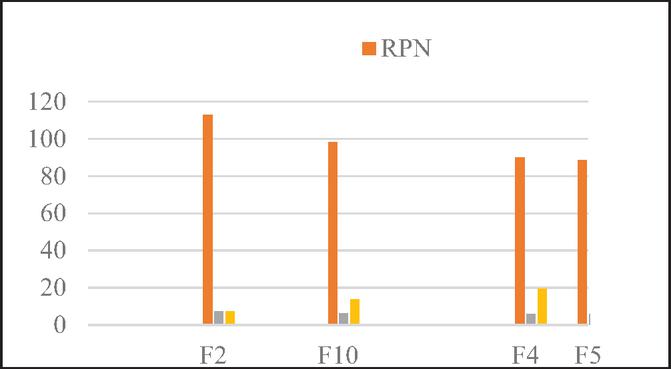
Figure 14 RPN, Risk % and Cumulative % of PV subsystem.
5 Results and Discussions
The overall study is based on the failure analysis of a sustainable water system assessed based on its two major subsystems: the submersible pump and the PV system. The methodologies, the Markov process and Pareto-based fuzzy FMEA technique, have been employed to study the most critical failure modes of the SWS system. Markov modelling has been employed in the study to predict “how long the system will survive.” Whereas the Pareto-based fuzzy FMEA has been employed to answer “which specific parts of the system are most likely to fail (vital few) or cause the system breakdown.” Both techniques answer different questions, yet the results can be compared meaningfully.
When looking at the individual subsystems, the two methodologies reasonably agree with the results. For the PV subsystem, has the steepest MTTF drop, which shows the PV panel failure rate, indicating that failure in the PV panels has the greatest influence on reducing the operational lifespan of the SWS system. In the RPN results, (dust/soiling), (battery swelling) and (overheating) are among the top 9 critical failure modes in third, eighth and ninth position. These failures directly affect the power generation and power bank efficiency, thereby increasing reliability degradation and the likelihood of system interruption. Similarly, has the next steepest MTTF drop, associated with the inverter failure rate, which represents the inverter as another critical component, enabling sudden failure in the system. The FMEA also agrees when it comes to the criticality analysis of the inverter’s failure modes and shows that , and are among the critical modes that contribute to high risk.
When comparing the submersible pump subsystem, contributes to the degraded state and failed state , illustrating that pump reliability highly influences the water supply continuity. Although the parallel redundancy improves resilience by delaying complete system failure, the high RPN value failure modes and indicates that pump-related failures remain the dominant contributors to the operational system risk. Therefore, prioritizing maintenance of PV panels, the inverter and the submersible pump is likely to improve system reliability, availability, extend MTTF and long-term sustainability of the SWS system.
In contrast, the Markov model helped assess the performance of the system over time, especially the reliability drops, pointing out that the system is most vulnerable at the beginning. The FMEA cannot yet answer this alone. Markov process focuses on the overall failure mechanism, whereas FMEA was totally conducted on expert-based analysis, pointing to the specific failures that lead the system to fail. Both techniques agree that the submersible pump and PV panel system are the two highest priority subsystems that require immediate maintenance and improvement. From both perspectives – the reliability-mathematical modeling and the FMEA practical perspective – the results explain the need for early-stage preventive maintenance for the submersible pump and the PV panel system. Thus, the conclusion supports the significance of the proposed integrated framework with well-informed decision-making for system maintenance, operational planning and design optimization by enabling both quantitative and quantitative reliability evaluation and systematic risk prioritizing.
In past studies, several researchers performed traditional reliability assessments, including risk assessments and reliability analyses of sustainable engineering systems. Balaraju et al. (2019) performed Root Cause Analysis (RCA) of an underground mining machinery – a Load-Haul-Dumper (LHD). The authors used an integrated fuzzy FMEA approach to evaluate and prioritize significant failure modes, thereby enhancing the accuracy of risk assessment under uncertain conditions. In this context, Libra et al. (2023) assessed the actual lifetime and degradation of crystalline silicon PV panels by analyzing long-term operational data from 85 photovoltaic power plants in Central Europe. The study employed a monitoring system to track inverter failures, PV failures and maintenance expenses over more than one decade. The economic impact of PV panel reduction was studied through techno-economic analyses incorporating Payback Period, Net Present Value and Internal Rate of Return. Similarly, Swain et al. (2024) performed reliability measures evaluation for an integrated microgrid by modelling the PV, wind and battery energy storage subsystem utilizing an eight-state Markov model and its equivalent two-state model. The framework estimated failure rates, repair rates and availability while incorporating a fuzzy Markov reliability model to avoid uncertainties from the failure and repair rates.
In the present study, the authors’ primary focus is to ensure the reliability and practical relevance of the proposed system, incorporating both qualitative and quantitative data by integrating insights from highly experienced domain experts. Markov modelling is used to estimate the reliability indices, such as availability, reliability, mean time to failure (MTTF) and expected cost. Each significant failure mode of the system is systematically identified, assessed, and prioritized using the Fuzzy FMEA technique, informed by expert knowledge and engineering insights. Furthermore, the Pareto analysis is employed to figure out the vital few significant failure modes. Unlike the past studies that focused on traditional reliability, risk prioritization and component degradation, the proposed framework employs multiple techniques with sustainability considerations. This integrated framework provides a more realistic evaluation of the system and contributes to the development of reliable and sustainable renewable energy systems.
6 Conclusion
This study assesses risks and failure modes involved in a sustainable engineering system with the help of integrated techniques of reliability engineering: Markov modeling and Pareto-based Fuzzy FMEA. The techniques provide a robust framework for risk assessment of a smart water supply system. While the Markov model captures system-level dynamics, the Pareto-based Fuzzy FMEA technique identifies critical failure modes (vital few) at the component level. Both methods consistently highlighted the importance of targeted maintenance strategies, particularly for the pump and PV panel subsystems. The study demonstrates that combining probabilistic and fuzzy approaches leads to more informed decision-making and improved system reliability. The proposed integrated framework successfully pinpointed the failures, (mechanical wear of impeller or bearing), (Motor winding failure or burnt out), (Soiling and dust accumulation), (Shaft seal leakage), (Earth fault or insulation failure), (Clogging of pump inlet or impeller), (Fuse and circuit breaker failure), (bulging of battery) and (insufficient ventilation causing overheating) as the 9 most critical failure modes from several perspectives.
Despite these contributions, the proposed methodology has some limitations. The Markov model considers constant failure and repair rates, which may not fully capture the time-dependent degradation of the components under fluctuating operating and environmental conditions. Furthermore, the failure rates of the components were drawn from past literature and expert consultations due to the unavailability of long-term operational data. Subsequently, the fuzzy FMEA results heavily depend on expert opinions that may introduce a degree of subjectivity, even though fuzzy logic is incorporated. In addition, factors such as weather unpredictability, component aging and real-time operational uncertainty that could affect system performance are not specifically taken into account by the proposed framework.
In the future, the proposed research may overcome these limitations by combining time-dependent or condition-based failure and repair rates through actual operational data from solar water supply systems. The proposed framework can be integrated with other stochastic techniques and advanced multi-criteria decision-making techniques, namely, DEMATEL, TOPSIS, Bayesian Networks, Dynamic Bayesian Networks, etc., to capture intricate failure dependencies, enhance the robustness of failure rankings and the comparative validation of failure modes. Additionally, including IoT-enabled condition monitoring and predictive maintenance strategies would improve the practical applicability of the proposed framework and contribute to the development of more resilient, reliable, and sustainable renewable energy engineering systems.
Declarations
Conflict of Interest
The authors confirm no conflict of interest.
Acknowledgement
The authors would like to express their sincere gratitude to the domain experts who generously contributed their time and expertise by participating in the structured questionnaire and field survey process.
Appendix A.
Table 14 Expert data
| Experts | Designation | Year of Experience | Email-Id |
| A | Executive Engineer | 15 years | intkhab.aalam1@gmail.com |
| B | Instructor | 14 years | priti.dhyani08@gmail.com |
| C | Associate Professor, Mechanical Engineering | 8 years | ashwanikharola.me@geu.ac.in |
| D | Assistant Professor, Electrical Engineer | 7 years | sanjaykumar506070@gmail.com |
| E | Assistant Professor, Electrical Engineer | 7 years | raj.13dec90@gmail.com |
| F | Field experts (Engineer) | 26 years | gourborwell@gmail.com |
| G | Field experts (Engineer) | 33 years | galibhassan54274@gmail.com |
| H | Field experts (Electrical Engineer) | 10 years | priyanshgoyal12@gmail.com |
References
Abebe, A. (2024). Internet of Things (IoT) enabled water distribution system for smart water management. International Journal of Wireless Communications and Mobile Computing, vol. 11, no. 1, pp. 1–10.
Abdelsalam, A. A., and Gabbar, H. A. (2021). Energy saving and management of water pumping networks. Heliyon, vol. 7, no. 8.
Al-Ali, S., Olabi, A. G., and Mahmoud, M. (2025). A review of solar photovoltaic technologies: developments, challenges, and future perspectives. Energy Conversion and Management: X, p. 101057.
Obatola, S. O. (2024). Reliability Overview of Grid-Connected Solar PV System: A Review. Archives of Advanced Engineering Science, pp. 1–10.
Alimi, O. A., Meyer, E. L., and Olayiwola, O. I. (2022). Solar photovoltaic modules’ performance reliability and degradation analysis – A review. Energies, vol. 15, no. 16, p. 5964.
Verma, S., Mishra, S., Chowdhury, S., Gaur, A., Mohapatra, S., Soni, A., and Verma, P. (2021). Solar PV powered water pumping system–A review. Materials Today: Proceedings, vol. 46, pp. 5601–5606.
Colli, A. (2015). Failure mode and effect analysis for photovoltaic systems. Renewable and Sustainable Energy Reviews, vol. 50, pp. 804–809.
Basu, J. B. (2015). Failure modes and effects analysis (FMEA) of a rooftop PV system. International Journal of Scientific Engineering and Research (IJSER), vol. 3, no. 9.
Patil, R. B., Khalkar, A., Al-Dahidi, S., Pimpalkar, R. S., Bhandari, S., and Pecht, M. (2024). A reliability and risk assessment of solar photovoltaic panels using a failure mode and effects analysis approach: A case study. Sustainability, vol. 16, no. 10, p. 4183.
Pimpalkar, R., Sahu, A., Yadao, A., and Patil, R. B. (2024). Failure modes and effects analysis of polycrystalline photovoltaic modules exposed to the composite climate of India. Journal of The Institution of Engineers (India): Series C, vol. 105, no. 2, pp. 339–355.
Swain, K., Cherukuri, M., Samanta, I. S., Pati, A., Giri, J., Panigrahi, A., … & Mallik, S. (2024). Fuzzy Markov model for the reliability analysis of hybrid microgrids. Frontiers in Computer Science, vol. 6, p. 1406086.
Gupta, M., and Bhargava, A. (2024). Optimal selection and analysis of microgrid energy system using Markov process. Sustainable Energy Technologies and Assessments, vol. 62, p. 103623.
Diamenu, G., Attachie, J. C., and Amuzuvi, C. K. (2022). Reliability analysis of wind energy generation system using stochastic method. Journal of Power and Energy Engineering, vol. 10, no. 8, pp. 26–44.
Li, J., Zhang, Y., Fang, H., and Fang, S. (2023). Risk evaluation of photovoltaic power systems: An improved failure mode and effect analysis under uncertainty. Journal of Cleaner Production, vol. 414, p. 137620.
Li, H., Díaz, H., and Soares, C. G. (2021). A failure analysis of floating offshore wind turbines using AHP-FMEA methodology. Ocean Engineering, vol. 234, p. 109261.
Kull, K., Asad, B., Khan, M. A., Naseer, M. U., Kallaste, A., and Vaimann, T. (2025). Faults, Failures, Reliability, and Predictive Maintenance of Grid-Connected Solar Systems: A Comprehensive Review. Applied Sciences, vol. 15, no. 21, p. 11461.
Çıtıroğlu, H. K., Arca, D., and Can, E. (2022). A comparison of risks assessment for the project phase of solar power plant installation with FMEA Pareto and AHP methods. Bitlis Eren Üniversitesi Fen Bilimleri Dergisi, vol. 11, no. 4, pp. 1059–1072.
Testik, O. M., and Unlu, E. T. (2023). Fuzzy FMEA in risk assessment for test and calibration laboratories. Quality and Reliability Engineering International, vol. 39, no. 2, pp. 575–589.
Karanović, V., Ceylan, B. O., and Jocanović, M. (2024). Reliable ships: A fuzzy FMEA based risk analysis on four-ram type hydraulic steering system. Ocean Engineering, vol. 314, p. 119758.
Alizadeh, S. S., Solimanzadeh, Y., Mousavi, S., and Safari, G. H. (2022). Risk assessment of physical unit operations of wastewater treatment plant using fuzzy FMEA method: a case study in the northwest of Iran. Environmental Monitoring and Assessment, vol. 194, no. 9, p. 609.
Mishra, R. K. (2023). Fresh water availability and its global challenge. British journal of multidisciplinary and advanced studies, vol. 4, no. 3, pp. 1–78.
Khalilzadeh, M., Ghasemi, P., Afrasiabi, A., and Shakeri, H. (2021). Hybrid fuzzy MCDM and FMEA integrating with linear programming approach for the health and safety executive risks: a case study. Journal of modelling in management, vol. 16, no. 4, pp. 1025–1053.
Sharma, K. D., and Srivastava, S. (2018). Failure mode and effect analysis (FMEA) implementation: a literature review. Journal of Advance Research in Aeronautics and Space Science, vol. 5, no. 1, pp. 1–17.
Rudov-Clark, S. D., and Stecki, J. (2009, March). The language of FMEA: on the effective use and reuse of FMEA data. In Sixth DSTO International Conference on Health & Usage Monitoring, pp. 9–12.
Balaraju, J., Raj, M. G., and Murthy, C. S. (2019). Fuzzy FMEA application for risk assessment of loader-brattice mining system. Journal of Sustainable Mining, vol. 18, no. 4, pp. 257–268.
Rawala, D. K., Ram, M., and Singh, V. V. (2014). Modeling and availability analysis of internet data center with various maintenance policies. Ije transactions A: Basics, vol. 27, no. 4, pp. 599–608.
El-Banby, G. M., Moawad, N. M., Abouzalm, B. A., Abouzaid, W. F., and Ramadan, E. A. (2023). Photovoltaic system fault detection techniques: a review. Neural Computing and Applications, vol. 35, no. 35, pp. 24829–24842.
Libra, M., Mrázek, D., Tyukhov, I., Severová, L., Poulek, V., Mach, J., … & Sedláček, J. (2023). Reduced real lifetime of PV panels–Economic consequences. Solar Energy, vol. 259, pp. 229–234.
Adam, M. Y., Osman, H. K., and Shukri, M. I. (2021). Analysis of major centrifugal pumps failures (with application to irrigation pumps in Sudan). International Journal of Scientific Research & Engineering Trends, vol. 7, no. 2, pp. 632–639.
Mohamad, S. N. F., Afrizal, N., Daud, M. Z., and Awal, M. R. (2024). Review on electrical submersible pump failures detection and monitoring system. International Journal of Advances in Applied Sciences ISSN, vol. 2252, no. 8814, p. 8814.
Hendricks, C., Williard, N., Mathew, S., and Pecht, M. (2015). A failure modes, mechanisms, and effects analysis (FMMEA) of lithium-ion batteries. Journal of Power Sources, vol. 297, pp. 113–120.
Jombo, G., Zhang, E., and Lu, N. (2024, June). Sensor fault detection and diagnosis: Methods and challenges. IFAC Proceedings.
Ahmed, Q., I. Khan, F., and A. Raza, S. (2014). A risk-based availability estimation using Markov method. International Journal of Quality & Reliability Management, vol. 31, no. 2, pp. 106–128.
Rawat, S., Goyal, N., and Ram, M. (2017). Software reliability growth modeling for agile software development. Int. J. Appl. Math. Comput. Sci., vol. 27, no. 4, pp. 777–783.
Najafi, P., Asoodar, M. A., Marzban, A., and Hormozi, M. A. (2015). Reliability analysis of agricultural machinery: A case study of sugarcane chopper harvester. Agricengint: CIGR journal, vol. 17, no. 1, pp. 158–165.
El-Moumen, H., Akchioui, N. E., and Zerrouk, M. H. (2022). Reliability analysis by Markov model and stochastic estimator of stochastic Petri nets. International Journal of Reliability and Safety, vol. 16, no. 1-2, pp. 110–123.
Shivani, S., Ram, M., Goyal, N., and Kumar, A. (2023). Analysis of series–parallel system’s sensitivity in context of components failures. RAIRO-Operations Research, vol. 57, no. 4, pp. 2131–2149.
Kumar, A., Saini, M., Patil, R. B., Al-Dahidi, S., and Mellal, M. A. (2022). Fuzzy FMEA application for risk assessment of loader-brattice mining system. Advances in mechanical engineering, vol. 14, no. 8, p. 16878132221115931.
Chanamool, N., and Naenna, T. (2016). Fuzzy FMEA application to improve decision-making process in an emergency department. Applied Soft Computing, vol. 43, pp. 441–453.
Dağsuyu, C., Göçmen, E., Narlı, M., and Kokangül, A. (2016). Classical and fuzzy FMEA risk analysis in a sterilization unit. Computers & industrial engineering, vol. 101, pp. 286–294.
Godina, R., Silva, B. G. R., and Espadinha-Cruz, P. (2021). A DMAIC integrated fuzzy FMEA model: a case study in the Automotive Industry. Applied sciences, vol. 11, no. 8, p. 3726.
Zaman, M. B., Kobayashi, E., Wakabayashi, N., Khanfir, S., Pitana, T., and Maimun, A. (2014). Fuzzy FMEA model for risk evaluation of ship collisions in the Malacca Strait: based on AIS data. Journal of Simulation, vol. 8, no. 1, pp. 91–104.
Beiranvand, B. (2024). Development of modified fuzzy FMEA method in environmental risk assessment of earth dams. Scientific Reports, vol. 14, no. 1, p. 17585.
Kadena, E., Koçak, S., Takács-György, K., and Keszthelyi, A. (2022). FMEA in smartphones: A fuzzy approach. Mathematics, vol. 10, no. 3, p. 513.
Rahimdel, M. J., Aryafar, A., and Vaziri, S. (2022). Fuzzy FMEA for the safety risk analysis of underground coal mining (a case study in Iran). Mining Technology, vol. 131, no. 2, pp. 104–114.
Resende, B. A. D., Dedini, F. G., Eckert, J. J., Sigahi, T. F., Pinto, J. D. S., and Anholon, R. (2024). Proposal of a facilitating methodology for fuzzy FMEA implementation with application in process risk analysis in the aeronautical sector. International Journal of Quality & Reliability Management, vol. 41, no. 4, pp. 1063–1088.
Torres, V. R., and Silva, I. P. (2026). Fuzzy FMEA approach with 5S criterion to improve the reliability of apron weigh feeder in a cement plant. International Journal of Quality & Reliability Management, pp. 1–20.
Chen, E., Luo, X., Ma, X., Bai, X., and Luo, J. (2025). Weight-embedded fuzzy FMEA framework for enhanced risk prioritization of offshore wind turbines. Ocean Engineering, vol. 341, p. 122649.
Zadeh, L. A. (1965). Fuzzy sets. Information and control, vol. 8, no. 3, pp. 338–353.
Sunal, C. E., Dyo, V., and Velisavljevic, V. (2022). Review of machine learning based fault detection for centrifugal pump induction motors. IEEE access, vol. 10, pp. 71344–71355.
Pietrzak, P., and Wolkiewicz, M. (2021, April). Application of Support Vector Machine to stator winding fault detection and classification of permanent magnet synchronous motor. In 2021 IEEE 19th International Power Electronics and Motion Control Conference (PEMC), pp. 880–887. IEEE.
Wang, L., Brown, B. F., Ursino, M., Russell, M., Jin, S., and Zhang, Z. (2026). Reliability Assessment of Cooling Fans for PV Inverters: Testing, Modeling, and Case Studies. IEEE Journal of Photovoltaics.
Wang, L., Brown, B. F., Siraj, A., Das, A. K., Jin, S., and Zhang, Z. (2025, June). PV Inverter Reliability Assessment: Methodology and Case Study. In 2025 IEEE 53rd Photovoltaic Specialists Conference (PVSC), pp. 1490–1495. IEEE.
Tariq, M. S., Butt, S. A., and Khan, H. A. (2018). Impact of module and inverter failures on the performance of central-, string-, and micro-inverter PV systems. Microelectronics Reliability, vol. 88, pp. 1042–1046.
Nagarajan, A., Thiagarajan, R., Repins, I. L., and Hacke, P. L. (2019). Photovoltaic inverter reliability assessment (No. NREL/TP–5D00-74462). National Renewable Energy Laboratory (NREL), Golden, CO (United States).
Pérez-Padillo, J., Puig, F., Morillo, J. G., and Montesinos, P. (2022). IoT platform for failure management in water transmission systems. Expert Systems with Applications, vol. 199, p. 116974.
Sadeghioon, A. M., Metje, N., Chapman, D. N., and Anthony, C. J. (2014). SmartPipes: Smart wireless sensor networks for leak detection in water pipelines. Journal of sensor and Actuator Networks, vol. 3, no. 1, pp. 64–78.
Kirana, R. C., Purwanto, N. A., Azis, N. A., Joelianto, E., Santosa, S. P., Budiman, B. A., … & Turnip, A. (2023). Failure assessment in lithium-ion battery packs in electric vehicles using the failure modes and effects analysis (FMEA) approach. Journal of Mechatronics, Electrical Power, and Vehicular Technology, vol. 14, no. 1, pp. 94–104.
Sonawane, P. R., Bhandari, S., Patil, R. B., and Al-Dahidi, S. (2023). Reliability and criticality analysis of a large-scale solar photovoltaic system using fault tree analysis approach. Sustainability, vol. 15, no. 5, p. 4609.
Chang, J., Kim, H., Lalonde, R., Doraisamy, E., and Vargo, J. (2025). Fuzzy Analytical Hierarchy Process-based Risk Priority Number Approach in Failure Modes and Effects Analysis for Magnetic Resonance Imaging-guided High-dose-rate Brachytherapy for Gynecologic Cancer. Advances in Radiation Oncology, vol. 10, no. 4, p. 101731.
Zadeh, L. A. (1975). The concept of a linguistic variable and its application to approximate reasoning – I. Information sciences, vol. 8, no. 3, pp. 199–249.
Alkiayat, M. (2021). A practical guide to creating a Pareto chart as a quality improvement tool. Global Journal on Quality and Safety in Healthcare, vol. 4, no. 2, pp. 83–84.
Osmani, K., Haddad, A., Lemenand, T., Castanier, B., Alkhedher, M., and Ramadan, M. (2023). A critical review of PV systems’ faults with the relevant detection methods. Energy nexus, vol. 12, p. 100257.
Kazancoglu, Y., Kazancoglu, I., and Sagnak, M. (2018). Fuzzy DEMATEL-based green supply chain management performance: application in cement industry. Industrial Management & Data Systems, vol. 118, no. 2, pp. 412–431.
NACCON. (2025, April 8). Main reasons for bulging (swelling) of polymer lithium batteries. Available: https://www.naccon.com/Main-Reasons-for-Bulging-swelling-of-Polymer-Lithium-Batteries
Brun, A., and Savino, M. M. (2018). Assessing risk through composite FMEA with pairwise matrix and Markov chains. International Journal of Quality & Reliability Management, vol. 35, no. 9, pp. 1709–1733.
Julitz, T. M., Schlüter, N., and Löwer, M. (2025, July). Validation of a Data-Driven Markov-Based Methodology for Failure and Risk Analysis. In 2025 International Conference on Control, Automation and Diagnosis (ICCAD), pp. 1–6. IEEE.
Sobhani, S., and Chountalas, I. (2017, January). FMEA driven Markov for bluetooth 4.0+ connectivity devices: A practical approach for quantitative reliability prediction. In 2017 Annual Reliability and Maintainability Symposium (RAMS), pp. 1–4. IEEE.
Tavakoli, M., Mesbahi, R., Nayeri, S., and Jolai, F. (2022). Risk assessment of medical devices used for COVID-19 patients based on a Markovian-based weighted failure mode effects analysis (WFMEA). Sci Iran, vol. 10.
Kolek, L., Ibrahim, M. Y., Gunawan, I., Laribi, M. A., and Zegloul, S. (2015, July). Evaluation of control system reliability using combined dynamic fault trees and Markov models. In 2015 IEEE 13th International Conference on Industrial Informatics (INDIN), pp. 536–543. IEEE.
Opricovic, S., and Tzeng, G. H. (2003). Defuzzification within a multicriteria decision model. International Journal of Uncertainty, Fuzziness and Knowledge-Based Systems, vol. 11, no. 05, pp. 635–652.
Toraman, S. (2023). System reliability analysis of large capacity electric mining trucks used in coal mining. Journal of Reliability and Statistical Studies, pp. 81–98.
Kumar, A., Pant, S., and Ram, M. (2023). Cost optimization and reliability parameter extraction of a complex engineering system. Journal of Reliability and Statistical Studies, pp. 99–116.
Li, J. (2014). A novel three-state model of markovian approach to reliability prediction for public transit train systems. Journal of Reliability and Statistical Studies, pp. 19–28.
Bouti, A., and Kadi, D. A. (1994). A state-of-the-art review of FMEA/FMECA. International Journal of reliability, quality and safety engineering, 1(04), 515–543.
Mustafa, R. J., Gomaa, M. R., Al-Dhaifallah, M., and Rezk, H. (2020). Environmental impacts on the performance of solar photovoltaic systems. Sustainability, 12(2), 608.
Biographies

Mohd Anas obtained his master’s degree in Mathematics from Shri Guru Ram Rai PG College, Dehradun, Uttarakhand, India. He is currently a research scholar in the Department of Mathematics at Graphic Era (Deemed to be University), Dehradun, Uttarakhand, India. He is pursuing his Ph.D. in Reliability theory, operations research, and Applied mathematics. His areas of interest include multi-criteria decision-making (MCDM) techniques for sustainability and sustainable engineering systems. His current work focuses on the reliability, risk assessment, and decision-making analysis of integrated energy and transportation systems, including solar energy systems and electric vehicles. He has attended two international conferences and published one book chapter in his field of research.

Mangey Ram is Professor and Dean at Graphic Era (Deemed to be University), Dehradun, India. He is Editor-in-Chief of the International Journal of Mathematical, Engineering and Management Book Series Editor with Elsevier, CRC Press-A Taylor and Frances Group, De Gruyter Brill, River Publishers; and Guest Editor and Editor for various journals. His fields of research are reliability theory and applied mathematics. Prof. Ram is a Senior Member of the IEEE, Senior Life Member of ORSI India, Life Member of SREQOM India, the Indian Society of Industrial and Applied Mathematics. He was conferred the many awards like Young Scientist Award, Emerging Mathematician of Uttarakhand Award, Best Faculty Award, Research Excellence Award, Outstanding Researcher Award, Excellence in Research Award, and Distinguished Service Award.

Shristi Kharola is an Assistant Professor at Chandigarh University, Punjab, India. She holds a Ph.D. in Mathematics and works in the areas of applied mathematics, reliability engineering, decision-making, sustainable systems, and energy systems. Her research interests include reliability and risk assessment, stochastic modelling, fuzzy systems, uncertainty modelling, and multi-criteria decision-making (MCDM), particularly for sustainable engineering and renewable energy systems. She has published several research articles in international publications and has contributed as an editor to academic books in mathematics and soft computing. She has presented her research at several international conferences and serves as an editor and reviewer for journals and conferences. Her academic experience also includes organizing conferences and workshops and mentoring Ph.D. scholars.
Journal of Reliability and Statistical Studies, Vol. 19, Issue 2 (2026), 733–784
doi: 10.13052/jrss0974-8024.19220
© 2026 River Publishers