Registered Fleet Composition and Port Goods Throughput in Greece: Preliminary Aggregate Evidence and an Illustrative Scenario
Ioannis Sitzimis1 and Gianluca Egidi2
1Department of Business Administration & Tourism, Hellenic Mediterranean University, Greece
2Department of Agriculture and Forest Sciences, Tuscia University, Italy
Corresponding Author: Ioannis Sitzimis; E-mail address: isitzimis@hmu.gr
Received 27 August 2025, Accepted 17 October 2025; Published Online: 26 August 2026.
Sustainability Research in the Mediterranean, 1(3), 179–190. https://doi.org/10.13052/srm2795-0514.013
Abstract
The makeup of a national merchant fleet can be interpreted as the distribution of its vessels among various classes of ships. However, there is very little research that has addressed this topic concerning overall cargo operations. The current study aims to find out whether the composition of the Greek merchant fleet is associated with the total amount of cargo handled in Greek ports. The methodology used is based on aggregated statistics extracted from the Hellenic Statistical Authority for the period from 2015 to 2025 in order to analyze the correlation between the proportion of cargo ships and tankers in the overall fleet and the volume of cargo passing through Greek ports. According to the basic model, there is a positive relationship between the variables under consideration; however, the estimate is statistically imprecise and depends on the alternative specifications used. Based on the assumption of a constant short-term correlation, maintaining the share of cargo ships and tankers at the level observed in 2023 would correspond to a difference of about 0.26 million tonnes in 2025, equivalent to about 0.7% of total goods throughput. The results suggest that fleet composition can be used as a preliminary monitoring indicator, although more detailed data at the port, ship and cargo levels are needed before stronger operational or policy conclusions can be drawn.
Keywords: Maritime transport, merchant fleet, cargo ships, counterfactual analysis, monitoring indicator, official statistics..
1 Introduction
The efficiency of maritime transport depends largely on the total size of available transport capacity and on the way in which it is allocated between different categories of ships (Stopford, 2023). Cargo ships and tankers constitute the cargo part of a maritime fleet, while passenger ships serve a different market with different demand conditions. The distribution between different ship categories means that each fleet has its own operational structure, even when the total number of ships remains unchanged. In recent years, gradual changes have been observed in the composition of the registered Greek merchant fleet. The number of cargo ships and tankers has decreased, while the number of passenger ships has increased (ELSTAT, 2024a). Between 2015 and 2025, the share of cargo-carrying vessels decreased from 0.548 to 0.413, while the total number of ships remained at around 1,840. The question that follows naturally is whether all these changes indicate trends in the amount of goods handled by Greek ports. The existing studies either concentrate on general shipping capacity or on the relationship between fleet size and trade volumes (Stopford, 2023; UNCTAD, 2023), with the latest review showing that the makeup of national fleets is comparatively overlooked as an aspect of shipping capacity (Lau et al., 2024).
In this context, the aim of the present study is to examine a research question, namely to what extent the recorded structure of the Greek merchant fleet, as reflected in the share of cargo-carrying vessels, is associated with the total movement of goods in Greek ports over the period 2015–2025. We approach the issue using a short-term descriptive design consisting of a simple counterfactual exercise that reflects the logic of the potential outcomes approach (Imbens & Rubin, 2015). The main objective is to assess whether an empirical correlation exists and to measure its magnitude, while clearly acknowledging that the design only allows for the identification of covariation between the phenomena under consideration.
The contribution of this analysis is rather limited, as it neither attempts to quantify a causal effect nor measures the operational capacity of the national fleet serving Greek ports, given that part of the registered fleet operates in international markets and part of the cargo handled in Greek ports is carried by foreign-flagged vessels. The aim is to examine whether the fleet structure provides a simple aggregate signal that is correlated with the movement of goods in the short term, in the same way that other aggregate measures derived from official statistics are used to monitor national economic performance.
2 Literature Review
Port throughput and fleet composition have largely been investigated as separate research objects (Notteboom et al., 2021; UNCTAD, 2023). Empirical evidence connecting the composition of a national merchant fleet to total port throughput remains scarce, and it is consequently unclear whether changes in fleet structure carry any informational content for aggregate port outcomes.
One area of research studies the factors affecting port activities. UNCTAD (2023) published a report that discussed the close relationship between global trade and sea transport and pointed to changes in the volume of cargo in different regions. Regarding ports, Notteboom et al. (2021) pointed to the importance of integration with supply chains, connection to the hinterlands, and operational efficiency, while automation and new technologies have changed the terminals substantially (OECD/ITF, 2021). At the same time, the analysis of ports within the logistics system has become common practice and is performed according to sophisticated multi-criteria evaluation methods, which were used in Ragazou et al. (2026) when analyzing companies’ strategies in servitization. Kamoun and Abdelmohsen (2023) mentioned the role of structural and operational features in European ports’ efficiency and throughput performance, while Caldas et al. (2024) show that performance in seaports also depends on external factors such as the regional economic situation, water depth, commodity specialization, management, and location.
Parola et al. (2021) review the subject of port traffic forecasting, while Mudunkotuwa et al. (2025) observe that throughput displays significant persistence during periods of disruption. Eskafi et al. (2021) demonstrate that port throughput changes systematically over time and that these changes can enhance probabilistic forecasting. Similarly, Guo et al. (2025) use spatial econometric techniques to uncover how the determinants of port traffic activity vary depending on location. All these studies indicate the influence of economic conditions, port characteristics and management practices on cargo volumes, while factors related to the supply side of the fleet are rarely examined in this context.
A different part of the literature examines how the international shipping market functions. Stopford (2023) explains that capital is allocated among vessel categories according to expectations about freight rates, technological change and market conditions. Psaraftis and Kontovas (2021) focus on the way decarbonization policies and regulation influence investment and fleet renewal. Shipping decisions are also increasingly made within a wider sustainability and governance context, which has developed substantially during the last two decades (Angelaki et al., 2025; Passas, 2024).
Within this discussion, the distribution of a fleet among cargo ships, tankers and passenger vessels is usually treated as the result of market conditions rather than as a separate empirical question. Its relationship with aggregate port throughput at the country level has received much less attention. This is the gap examined in the present study.
A large part of recent maritime research describes relationships, disruptions and resilience patterns without attempting to establish causality, as also noted by Lau et al. (2024). Methodological work makes a clear distinction between descriptive evidence and causal inference, with the latter requiring an explicit identification strategy (Angrist & Pischke, 2009; Imbens & Rubin, 2015).
The analysis used here is therefore descriptive. It examines how the two aggregate variables move together over a limited period. The counterfactual exercise in Section 5 simply applies the estimated model to an alternative value of the fleet-composition variable; it is not intended to show what would actually have happened under a different historical path.
In more detail, the present paper examines the share of cargo-carrying vessels and compares it with the total volume of goods handled, making use of the available official aggregate data on fleet structure and port throughput (ELSTAT, 2024a, 2024b). Measuring economic progress in Greece makes substantial use of indicators based on official statistics, along with other measures combining value-added information (Xanthos et al., 2020).
Fleet composition is defined in similar terms. It shows the composition of the national vessel register but does not provide a measure of the actual operational capacity of the fleet serving Greek ports. The objective here is only to check whether this particular indicator and throughput are correlated over a short annual data series.
3 Data
The dependent variable is the total volume of goods handled through Greek ports, measured in tonnes. The measure corresponds to the overall account of total goods in the quarterly statistical bulletins of the Hellenic Statistical Authority (ELSTAT), which collects the data at the port level and publishes them in aggregate form (ELSTAT, 2024b). Official statistics of this kind provide a consistent and regularly updated basis for monitoring economic activity over time (Salvucci et al., 2025). Annual totals are used so that the series is compatible with the frequency of the fleet data. Table 3 reports the total volume of goods handled for the years 2015 to 2025.
Table 1. Total volume of goods handled in Greek ports, 2015–2025
| Year | Goods handled (tonnes) |
| 2015 | 36,150,528 |
| 2016 | 36,715,384 |
| 2017 | 37,421,412 |
| 2018 | 39,607,623 |
| 2019 | 39,869,534 |
| 2020 | 36,671,431 |
| 2021 | 37,781,157 |
| 2022 | 36,120,139 |
| 2023 | 35,705,132 |
| 2024 | 36,333,799 |
| 2025 | 34,914,350 |
Data from the Hellenic Statistical Authority (ELSTAT, 2024b).
Throughput fluctuates within a relatively narrow band over the period. Activity reaches its highest levels in 2018 and 2019, contracts in 2020, and thereafter moves on a lower plateau. A modest increase between 2023 and 2024 is followed by a renewed decline in 2025, when throughput reaches its minimum of 34.9 million tonnes for the period. These movements motivate the inclusion of macroeconomic controls in the supplementary specifications described below.
The independent variable is the composition of the Greek merchant fleet. The information is drawn from the annual statistical bulletin on the Greek merchant fleet, which reports the number of vessels in each category according to the official registry (ELSTAT, 2024a). Cargo ships and tankers are combined into a single cargo-carrying group, while passenger ships and other vessels are treated separately. The share of cargo-carrying vessels in the total fleet is calculated for each year and constitutes the principal explanatory variable of the analysis. Table 3 presents the composition of the fleet and the resulting share.
Table 2. Composition of the Greek merchant fleet, 2015–2025 (number of vessels)
| Year | Cargo vessels | Tankers | Passenger vessels | Other | Total vessels | Cargo share |
| 2015 | 488 | 523 | 604 | 231 | 1,846 | 0.548 |
| 2016 | 469 | 514 | 616 | 241 | 1,840 | 0.534 |
| 2017 | 437 | 530 | 639 | 249 | 1,855 | 0.521 |
| 2018 | 422 | 518 | 664 | 259 | 1,863 | 0.504 |
| 2019 | 417 | 510 | 695 | 260 | 1,882 | 0.493 |
| 2020 | 406 | 481 | 710 | 257 | 1,854 | 0.478 |
| 2021 | 395 | 463 | 718 | 262 | 1,838 | 0.467 |
| 2022 | 375 | 446 | 744 | 269 | 1,834 | 0.448 |
| 2023 | 362 | 423 | 763 | 272 | 1,820 | 0.431 |
| 2024 | 360 | 411 | 778 | 277 | 1,826 | 0.422 |
| 2025 | 351 | 408 | 798 | 282 | 1,839 | 0.413 |
Data from the Hellenic Statistical Authority (ELSTAT, 2024a). The cargo share is the ratio of cargo vessels and tankers to total registered vessels.
The share of cargo-carrying vessels declines steadily from 0.548 in 2015 to 0.413 in 2025, while the total number of registered vessels changes only slightly around 1840 units. The decline reflects a reduction in the number of cargo ships and tankers together with a sustained increase in passenger vessels and other categories. Figure 1 plots goods throughput together with the cargo share for 2015 to 2025. The cargo share follows a smooth downward path, whereas throughput varies more unevenly, with higher values around 2018 and 2019 and lower levels towards 2025.
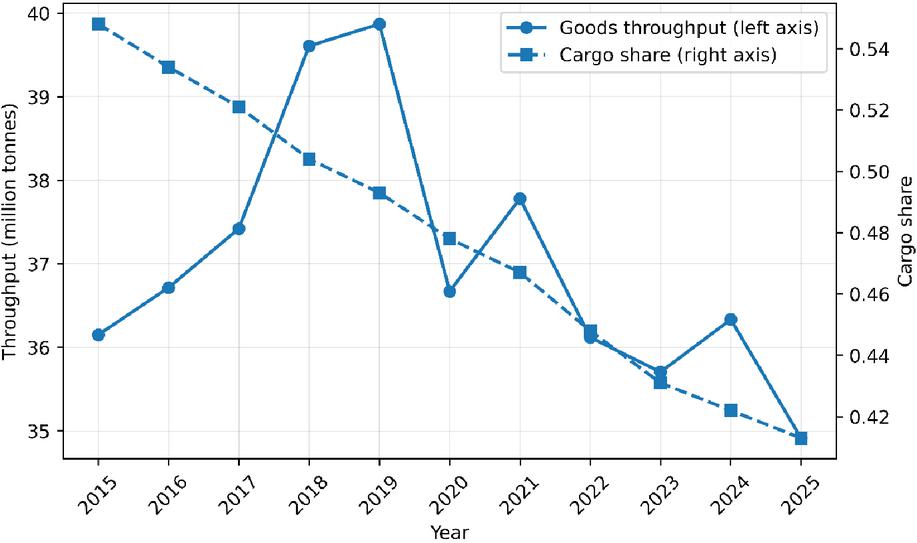
Figure 1 Goods throughput (solid line, left axis) and cargo-carrying share of the registered fleet (dashed line, right axis), 2015–2025. Authors’ calculations based on ELSTAT data.
Table 3. Descriptive statistics, 2015–2025
| Variable | Mean | Std. dev. | Min | Max |
| Throughput (tonnes) | 37,026,408 | 1,548,500 | 34,914,350 | 39,869,534 |
| Cargo share | 0.478 | 0.046 | 0.413 | 0.548 |
Authors’ calculations based on ELSTAT data. The sample comprises 11 annual observations.
At the outset, it is important to provide a definition of the term in question. The present series is concerned with the Greek-registered merchant fleet and not with the potential capacity serving Greek ports. Some of the registered fleet may not actually be used in domestic operations, while some of the cargo handled in Greek ports is moved by foreign vessels which never enter the Greek register. Therefore, the share of cargo-carrying vessels is to be perceived as a general indicator rather than a direct measure of the operational capacity serving Greek ports.
The volume of trade passing through ports is affected by a nation’s economic activity and conditions in international trade, while shocks in commodity or trade markets influence maritime transport significantly (UNCTAD, 2023; Vortelinos et al., 2024). Therefore, two control variables are employed in supplementary specifications. Real GDP indicates the condition of the domestic economy, since European economies are subject to various crisis-and-recovery phases (Doukas et al., 2025). At the same time, the world trade index reflects the performance of international trade. Variables entered in natural logarithms allow the relationships to be expressed in percentage terms. The main aim of the controls is to account for part of the impact of macroeconomic conditions on the relationship assessed.
Table 3 shows the descriptive statistics for the yearly variables used in the short-run analysis. Average throughput over the specified period is 37.0 million tonnes, with a standard deviation of 1.5 million tonnes. The observed values vary between 34.9 million tonnes in 2025 and 39.9 million tonnes in 2019. As for the cargo share, its average value is 0.478 and it decreases throughout the analyzed period, with the highest figure equal to 0.548 and the lowest equal to 0.413.
4 Methodology
The analysis relates goods throughput to the share of cargo-carrying vessels in the total registered fleet. Because the total size of the fleet is comparatively stable over the sample, the estimates reflect variation in the internal structure of the register rather than in its overall scale. The framework is explicitly descriptive. It does not address endogeneity concerns such as reverse causality or omitted variables, including fuel prices, the composition of trade, and port infrastructure investment, all of which plausibly move together with the variables of interest (Angrist & Pischke, 2009; Stopford, 2023).
The temporal dimension of the data imposes further restraint. With 11 annual observations, formal time-series machinery such as cointegration and error-correction modelling cannot be applied credibly (Engle & Granger, 1987; Johansen, 1988, 1991), and inference from least squares estimates is necessarily fragile. Comparable constraints arise elsewhere in Greek transport research, where small samples have motivated penalized estimation techniques precisely because conventional estimators become unstable (Sitzimis et al., 2025). The analysis therefore relies on a transparent baseline specification supported by an extensive set of sensitivity checks instead of formal statistical robustness.
The baseline model estimates the relationship between total goods throughput and the cargo-carrying share in levels. The dependent variable is total goods throughput in tonnes and the explanatory variable is the share of cargo-carrying vessels in the total registered fleet. Formally, the baseline specification reads
| (1) |
Estimation is by ordinary least squares (OLS) with non-robust standard errors, as reported in the original regression output. As a supplementary check, a logarithmic specification augmented with macroeconomic controls is also estimated, in which real GDP of Greece and the world merchandise trade index account for general domestic and international conditions. The baseline levels model remains the reference specification throughout, and the alternative forms reported in Section 5 serve exclusively as sensitivity checks.
The indicative scenario for 2025 describes the change implied by the baseline model when the cargo-carrying share is set at its 2023 level instead of the observed 2025 level, and applies this change to observed 2025 throughput. The exercise holds the estimated coefficients fixed and substitutes a single value of the explanatory variable, so the resulting difference is an arithmetic property of the fitted line.
The scenario takes into account neither macroeconomic, institutional, port-level, nor operational considerations. Thus, the difference between the observed value and the indicative value should be interpreted as the result of a specific descriptive calculation and not as an estimate of what would have happened in practice, a distinction emphasized in the counterfactual literature (Imbens & Rubin, 2015). The scenario is reported alongside a coefficient-based range in Section 5 to indicate the scale of the calculated difference.
5 Results
Table 5 reports the estimation of the baseline linear model, in which the volume of goods handled is regressed on the share of cargo-carrying vessels. Table 5 serves as the reference point for all subsequent checks, and its purpose is to establish the direction and the approximate strength of the short-run association.
Table 4. Baseline model (OLS in levels, without time trend)
| Variable | Coefficient | Std. error | t-statistic | p-value |
| Constant | 30,200,000 | 4,850,000 | 6.230 | 0.000 |
| Cargo share | 14,270,000 | 10,100,000 | 1.413 | 0.191 |
The dependent variable is goods throughput in tonnes. Coefficients are expressed in tonnes per unit change in the explanatory variable. The sample comprises 11 observations. and adjusted . The coefficient on the cargo share is positive yet statistically imprecise and is interpreted descriptively.
The coefficient on the cargo share is positive, so years with a higher share of cargo-carrying vessels tend to coincide with higher total throughput. The estimate is statistically imprecise, with a p-value of 0.191, and the explanatory power of the model remains limited at an R of 0.182. The increase in throughput in 2024, a year in which the cargo-carrying share declined, illustrates that goods throughput also responds to factors outside the model.
Figure 2 displays the underlying annual observations together with the fitted line and year labels. The dispersion of the points around the line is considerable, so the positive slope summarizes a loose association. Figure 2 and the regression convey the same message, namely a positive short-run relationship estimated with substantial uncertainty.
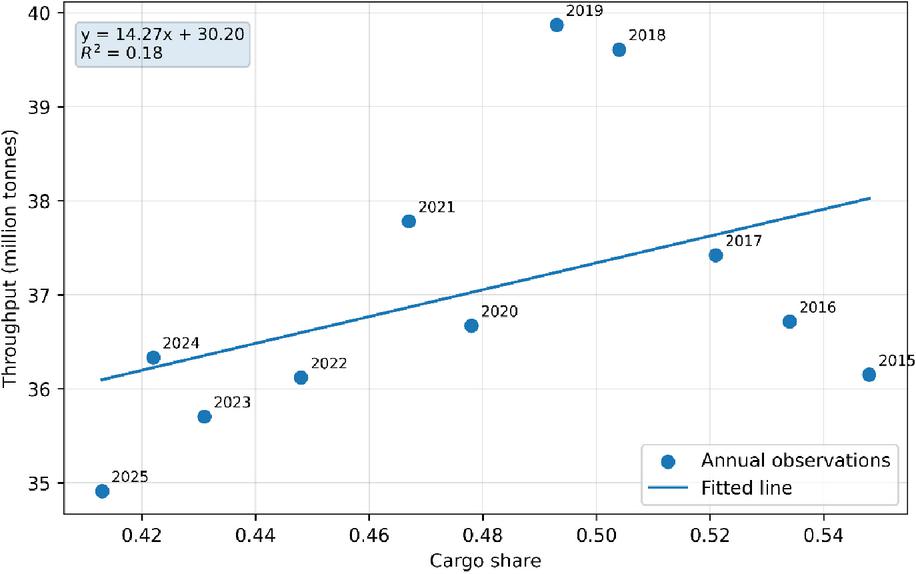
Figure 2 Relationship between the cargo-carrying share and goods throughput in annual observations, with fitted line and year labels. Authors’ calculations based on ELSTAT data.
5.1 An indicative counterfactual scenario for 2025
The indicative scenario evaluates the change in total goods throughput implied by the baseline model after setting the cargo-carrying share at its 2023 level of 0.431 in place of the observed 2025 level of 0.413. Table 5.1 compares the observed value with the indicative value produced by the scenario.
Table 5. Observed and counterfactual goods throughput, 2025
| Magnitude | Tonnes |
| Observed goods throughput | 34,914,350 |
| Counterfactual throughput (2023 cargo share) | 35,170,000 |
| Difference | +260,000 |
Counterfactual throughput follows from the observed 2025 value plus the change implied by the baseline model when the cargo share is set at its 2023 level, and is rounded to the nearest 10,000 tonnes.
The difference between the two values amounts to approximately 0.26 million tonnes, close to 0.7% of total goods throughput in 2025. The magnitude is modest in absolute terms yet visible at the aggregate level, and it follows directly from the application of the fitted baseline model to the alternative share.
The uncertainty of the underlying coefficient translates into substantial uncertainty around the scenario itself. Combining the scenario difference with the standard error of the estimated coefficient yields a wide coefficient-based range of approximately 0.15 to 0.67 million tonnes. The range does not constitute a full prediction interval, and it confirms that the scenario should be read as an order of magnitude rather than as a statistically precise estimate.
The checks reported in this section vary the functional form, the temporal structure, and the composition of the sample in order to establish how sensitive the descriptive association is to modelling choices. The aim is to characterize the uncertainty inherent in a short annual sample, without any ambition to demonstrate statistical robustness or causality. The checks cover a linear time trend, estimation in first differences, a lagged regressor, logarithmic forms with and without macroeconomic controls, a leave-one-out analysis, and a placebo scenario for 2024.
The first check re-estimates the baseline relationship with a linear time trend, so that common temporal variation in the two series is absorbed by a deterministic term. The specification takes the form
| (2) |
and Table 5.1 reports the estimates. The purpose of the check is to establish whether the baseline association survives once the shared downward drift of the cargo share and the level of throughput is controlled.
Table 6. Alternative specification with a linear time trend
| Variable | Coefficient | Std. error | t-statistic | p-value |
| Constant | 38,288,067 | 106,473,070 | 0.360 | 0.728 |
| Cargo share | 117,619 | 189,580,232 | 0.001 | 1.000 |
| Time trend | 200,904 | 2,642,830 | 0.076 | 0.941 |
Dependent variable is goods throughput in tonnes. The sample comprises 11 observations. and adjusted . The trend absorbs part of the common time variation, while the cargo-share coefficient is economically small and statistically imprecise.
The inclusion of the trend changes the coefficient on the cargo share in both sign and magnitude. The estimate turns marginally negative, is economically negligible, and carries a p-value of 1.000, while the trend itself is also imprecisely estimated. The result demonstrates the sensitivity of the baseline association in a short annual sample once common trends are introduced, and it weighs heavily in the overall assessment offered below.
The second check estimates the model in first differences, that is, in annual changes, which removes a large part of the common movement of the two series. Table 5.1 reports the estimates on the 10 available differenced observations. The association becomes markedly weaker in this form, with an of 0.024 and a statistically negligible slope, a pattern consistent with the interpretation that part of the baseline correlation reflects shared time variation.
Table 7. OLS in first differences
| Variable | Coefficient | Std. error | t-statistic | p-value |
| Constant | 814,000 | 2,180,000 | 0.373 | 0.719 |
| Cargo share | 69,450,000 | 157,000,000 | 0.442 | 0.670 |
Dependent variable is the annual change in goods throughput in tonnes. The sample comprises 10 observations. and adjusted .
A complementary check replaces the contemporaneous share with its first lag, reflecting the possibility that any relationship between fleet structure and throughput materializes with delay. Table 5.1 reports the estimates. The lagged coefficient remains positive and is somewhat larger than the baseline estimate, with a p-value of 0.065 and an of 0.363, although the small sample cautions against reading the improvement as evidence of a stable dynamic relationship.
Table 8. OLS with lagged cargo share
| Variable | Coefficient | Std. error | t-statistic | p-value |
| Constant | 26,250,000 | 5,100,000 | 5.144 | 0.001 |
| Cargo share (t1) | 22,410,000 | 10,500,000 | 2.135 | 0.065 |
Dependent variable is goods throughput in tonnes. The sample comprises 10 observations. and adjusted .
The third family of checks re-expresses the model in logarithms so that the estimates can be read as elasticities. Table 5.1 reports the bivariate logarithmic specification. The coefficient on the log of the cargo share remains positive at 0.195 and is again imprecisely estimated, with a p-value of 0.156, while the fit is comparable to the baseline model.
Table 9. Logarithmic specification (elasticity form)
| Variable | Coefficient | Std. error | t-statistic | p-value |
| Constant | 17.571 | 0.094 | 186.740 | 0.000 |
| log(Cargo share) | 0.195 | 0.126 | 1.548 | 0.156 |
Dependent variable is the natural logarithm of goods throughput. The sample comprises 11 observations. and adjusted .
Table 5.1 augments the logarithmic specification with the macroeconomic controls described in Section 3. The world trade index enters with a coefficient of 1.104 and a p-value of 0.046, consistent with the central role of international trade conditions for port activity, while the cargo-share elasticity increases to 0.429 yet remains imprecise. The coefficient on domestic output is negative and should carry no structural reading, since it most plausibly reflects collinearity among the regressors and the very small sample rather than any substantive economic relationship.
Table 10. Logarithmic specification with macroeconomic controls
| Variable | Coefficient | Std. error | t-statistic | p-value |
| Constant | 17.963 | 3.892 | 4.615 | 0.004 |
| log(Cargo share) | 0.429 | 0.269 | 1.598 | 0.161 |
| log(GDP) | 0.445 | 0.347 | 1.282 | 0.247 |
| log(World trade) | 1.104 | 0.441 | 2.507 | 0.046 |
Dependent variable is the natural logarithm of goods throughput. The sample comprises 11 observations. All variables are expressed in natural logarithms and standard errors are non-robust. The specification includes real GDP of Greece and a world merchandise trade index as macroeconomic controls.
The fourth check probes the influence of individual years. The baseline levels model is re-estimated 11 times, omitting one year from the sample on each occasion, and the implied scenario difference is recomputed with the resulting coefficient. Table 5.1 reports the full set of estimates.
Table 11. Leave-one-out sensitivity analysis
| Omitted year | Cargo-share coefficient | Scenario difference (tonnes) |
| 2015 | 23,275,000 | 419,000 |
| 2016 | 18,073,000 | 325,000 |
| 2017 | 14,801,000 | 266,000 |
| 2018 | 11,217,000 | 202,000 |
| 2019 | 12,230,000 | 220,000 |
| 2020 | 14,269,000 | 257,000 |
| 2021 | 14,795,000 | 266,000 |
| 2022 | 13,497,000 | 243,000 |
| 2023 | 12,495,000 | 225,000 |
| 2024 | 14,642,000 | 264,000 |
| 2025 | 9,203,000 | 166,000 |
Each row reports the baseline levels model after omitting one year from the sample. Coefficients are expressed in tonnes per unit change in the cargo share. The scenario difference multiplies the estimated coefficient by the difference between the 2023 and 2025 cargo shares. The results serve only as a sensitivity check and provide no evidence of statistical robustness or causality.
The coefficient on the cargo-carrying share remains positive in every subsample, while its size varies considerably, from 9.2 million when 2025 is omitted to 23.3 million when 2015 is omitted. The corresponding scenario difference ranges from approximately 0.17 to 0.42 million tonnes. The pattern supports the reading of the association as a fragile descriptive correlation that nevertheless does not originate in any single year of the sample.
The final check applies the same counterfactual computation to 2024, using the 2023 cargo-carrying share as the reference point. A method that produced large differences irrespective of the actual change in fleet composition would cast doubt on the informativeness of the main scenario (Imbens & Rubin, 2015).
The estimated difference for 2024 is smaller than the corresponding difference for 2025, in line with the limited change in the cargo-carrying share between 2023 and 2024. The exercise does not validate the main result, yet it indicates that the 2025 scenario does not arise mechanically from the structure of the computation.
Across the levels, lagged, and logarithmic specifications the coefficient on the cargo-carrying share is consistently positive and consistently imprecise. Estimation in first differences weakens the association substantially, which points to a role for shared time variation, and the introduction of a linear time trend reverses the sign of the coefficient and reduces it to economic insignificance. The association is therefore treated throughout as a descriptive regularity, without any claim of stability or statistical robustness.
The magnitudes involved, especially the counterfactual differences, also change noticeably from one specification to another, as expected with 11 annual observations. This variability is the principal reason for presenting all quantitative results as indications of order of magnitude, and it frames the interpretation offered in the following section.
6 Discussion
According to the baseline model, there was a drop in the share of cargo-carrying vessels between 2023 and 2025, and goods throughput was lower in 2025 than in 2023; the indicative scenario connects these movements through the regression line obtained from the analysis. However, the analysis does not show the mechanism behind this relationship. The results underline that even though the total size of the fleet remained practically unchanged, its internal structure was changing together with goods throughput. This relationship, however, is only weakly evident in the data. Hence, fleet composition can be viewed as a gradually changing indicator based on the fleet registry, but not as a direct operational proxy for the capacity serving Greek ports.
The interpretation above is in line with the broader scientific literature on the factors that determine port performance. Kamoun and Abdelmohsen (2023) discuss structural and operational characteristics, Caldas et al. (2024) mention exogenous conditions such as the economic environment and cargo specialization, and Guo et al. (2025) provide evidence that determinants differ spatially. The structure of the registered fleet can be regarded as an auxiliary descriptive indicator operating within this wider set of determinants, with the important advantage of being available through official statistics without additional data collection costs.
The monitoring perspective shows how the indicator can be useful. Aggregate indicators prepared from public sector statistics are often used for monitoring economic performance at national and regional levels, and there is a large body of literature dedicated to their creation, aggregation, and governance (Panagiotopoulos et al., 2024; Xanthos et al., 2020; Zopounidis et al., 2020). Sustainability reporting applies the same ideas to the environmental and social dimensions of economic activity (Passas, 2024; Vardopoulos & Passas, 2025). Port systems can also generate operational and environmental data at the level of the port facility and add them to register-based aggregates, as shown in studies dealing with Greek port reception facilities (Kyramargiou & Vardopoulos, 2019). Thus, the monitoring framework considered here indicates that the cargo-carrying share provides a broad signal of the structure of the registered fleet that can be considered together with direct measures of port activity.
The diagnostic nature of the result limits its relevance for policy. Due to the limited number of observations, the aggregated nature of the data, and the definition of the indicator based on the national registry, no direct policy or operational recommendation can be made from the estimates. In order to draw stronger conclusions, detailed evidence at the port, vessel, and cargo level is needed, as well as identification strategies that allow composition effects to be separated from demand conditions (Angrist & Pischke, 2009).
7 Conclusion
The study uses data from the Hellenic Statistical Authority for the period 2015 to 2025 to examine whether the composition of the Greek merchant fleet is related to the movement of goods in Greek ports. The results of our basic model show a positive correlation between the share of cargo-carrying vessels and the movement of goods in Greek ports. However, the relationship is weak and sensitive to the model chosen. Therefore, the findings should not be interpreted as evidence of causality.
Our estimates for 2025 suggest that, if the relationship remains the same, maintaining the share of cargo-carrying vessels at the 2023 level would imply a difference of approximately 0.26 million tonnes. However, this should only be considered a rough estimate. We also examined how the finding varies across different specifications, with the relationship weakening when common temporal variations are removed.
The aim of this paper is to use the structure of the registered fleet by ship type as an elementary measure alongside direct indicators of port activity. The indicator should not be considered a substitute for data on tonnage, number of ship calls, or analysis of cargo types. The analysis presented in this paper is limited by the short annual sample. Longer time series and more detailed data at the port, vessel and cargo levels would allow further exploration of the relationships between the variables.
References
Angelaki, E., Garefalakis, A., Kourgiantakis, M., Sitzimis, I., & Passas, I. (2025). ESG integration and green computing: A 20-year bibliometric analysis. Sustainability, 17(7), 3266. https://doi.org/10.3390/su17073266
Angrist, J. D., & Pischke, J.-S. (2009). Mostly Harmless Econometrics: An Empiricist’s Companion. Princeton University Press.
Caldas, P., Pedro, M. I., & Marques, R. C. (2024). An assessment of container seaport efficiency determinants. Sustainability, 16(11), 4427. https://doi.org/10.3390/su16114427
Doukas, Y. E., Maravegias, N., Ioannides, S., Salvati, L., & Vardopoulos, I. (2025). Economic resilience and sustainability in the European Union: A comparative analysis of pre- and posteconomic crisis. In L. Salvati (Ed.), Environmental Sustainability and Global Change (pp. 257–273). Elsevier. https://doi.org/10.1016/B978-0-443-31596-1.00018-0
ELSTAT. (2024a). Greek Merchant Fleet (Annual report). Hellenic Statistical Authority.
ELSTAT. (2024b). Passenger, Goods and Mobile Unit Traffic in Greek Ports (Statistical bulletin). Hellenic Statistical Authority.
Engle, R. F., & Granger, C. W. J. (1987). Co-integration and error correction: Representation, estimation, and testing. Econometrica, 55(2), 251–276. https://doi.org/10.2307/1913236
Eskafi, M., Kowsari, M., Dastgheib, A., Ulfarsson, G. F., Stefansson, G., Taneja, P., & Thorarinsdottir, R. I. (2021). A model for port throughput forecasting using Bayesian estimation. Maritime Economics & Logistics, 23(2), 348–368. https://doi.org/10.1057/s41278-021-00190-x
Guo, R., Xiao, G., Zhang, C., & Li, Q. (2025). A study on influencing factors of port cargo throughput based on multi-scale geographically weighted regression. Frontiers in Marine Science, 12, 1637660. https://doi.org/10.3389/fmars.2025.1637660
Imbens, G. W., & Rubin, D. B. (2015). Causal Inference for Statistics, Social, and Biomedical Sciences. Cambridge University Press.
Johansen, S. (1988). Statistical analysis of cointegration vectors. Journal of Economic Dynamics and Control, 12(2–3), 231–254. https://doi.org/10.1016/0165-1889(88)90041-3
Johansen, S. (1991). Estimation and hypothesis testing of cointegration vectors in Gaussian vector autoregressive models. Econometrica, 59(6), 1551–1580. https://doi.org/10.2307/2938278
Kamoun, R., & Abdelmohsen, C. (2023). Determinants of seaport efficiency: An analysis of European container ports. Journal of Maritime Research, 20(1), 145–158.
Kyramargiou, Z., & Vardopoulos, I. (2019). Use and sustainability of the ships’ waste reception facilities: Evidence from the Port of Corinth, Greece. Journal of Management and Regional Development, 15(3), 93–106. https://doi.org/10.54399/rbgdr.v15i3.4670
Lau, Y.-Y., Chen, Q., Poo, M. C.-P., Ng, A. K. Y., & Ying, C. C. (2024). Maritime transport resilience: A systematic literature review on the current state of the art, research agenda and future research directions. Ocean & Coastal Management, 251, 107086. https://doi.org/10.1016/j.ocecoaman.2024.107086
Mudunkotuwa, R., Ji, M., Peiris, T. S. G., Bandara, Y. M., & Netirith, N. (2025). Forecasting throughput at a transshipment hub under trade dynamism and uncertainty in major production centers. Maritime Economics & Logistics, 27(2), 373–403. https://doi.org/10.1057/s41278-024-00301-4
Notteboom, T., Pallis, A. A., & Rodrigue, J.-P. (2021). Port Economics, Management and Policy. Routledge.
OECD/ITF. (2021). Container Port Automation: Impacts and Implications. OECD Publishing. https://doi.org/10.1787/da2de5a9-en
Panagiotopoulos, P., Vardopoulos, I., Maialetti, M., Ciaschini, C., Koundouri, P., & Salvati, L. (2024). Reimagining sustainable development and economic performance indicators: A human-centric Maslow-Bossel blueprint. Economies, 12(12), 338. https://doi.org/10.3390/economies12120338
Parola, F., Satta, G., Buratti, N., & Vitellaro, F. (2021). Revisiting traffic forecasting by port authorities in the context of port planning and development. Maritime Economics & Logistics, 23(3), 444–494. https://doi.org/10.1057/s41278-020-00170-7
Passas, I. (2024). The evolution of ESG: From CSR to ESG 2.0. Encyclopedia, 4(4), 1711–1720. https://doi.org/10.3390/encyclopedia4040112
Psaraftis, H. N., & Kontovas, C. A. (2021). Decarbonization of maritime transport. Sustainability, 13(1), 237. https://doi.org/10.3390/su13010237
Ragazou, K., Garefalakis, A., Pardalos, P. M., Zopounidis, C., & Passas, I. (2026). A hybrid DEMATEL-fuzzy AHP-MARCOS framework for evaluating digital servitization strategies in supply chains. Annals of Operations Research. https://doi.org/10.1007/s10479-026-07231-9
Salvucci, G., Salvati, L., Alaimo, L. S., & Vardopoulos, I. (2025). Settlement patterns, official statistics and geo-economic dynamics: Evidence from a LADISC approach to Italy. Big Data Research, 100525. https://doi.org/10.1016/j.bdr.2025.100525
Sitzimis, I., Dimou, I., Xanthos, G., & Passas, I. (2025). Seaplane adoption in Greece: From ordinal intent to Firth-penalized logistic inference. AppliedMath, 5(4), 152. https://doi.org/10.3390/appliedmath5040152
Stopford, M. (2023). Maritime Economics (4th ed.). Routledge.
UNCTAD. (2023). Review of Maritime Transport 2023. United Nations.
Vardopoulos, I., & Passas, I. (Eds.). (2025). Futureproofed Sustainability amidst Climate Change Polycrisis: Advancing SDGs and ESG for the Cities of Tomorrow. IGI Global Scientific Publishing. https://doi.org/10.4018/979-8-3373-2327-5
Vortelinos, D., Menegaki, A., Passas, I., Garefalakis, A., & Viskadouros, G. (2024). Heterogeneous responses of energy and non-energy assets to crises in commodity markets. Energies, 17(21), 5438. https://doi.org/10.3390/en17215438
Xanthos, G., Zopounidis, C., Garefalakis, A., & Passas, I. (2020). Distinguish regional performance with the use of shift-share analysis and MCDA methods: A gross value-added perspective. Operational Research, 22, 1363–1376. https://doi.org/10.1007/s12351-020-00582-6
Zopounidis, C., Garefalakis, A., Lemonakis, C., & Passas, I. (2020). Environmental, social and corporate governance framework for corporate disclosure: A multicriteria dimension analysis approach. Management Decision, 58(11), 2473–2496. https://doi.org/10.1108/MD-10-2019-1341