Efficient Pre-Processing Techniques for Improving Classifiers Performance
S. Nickolas1,* and K. Shobha2
1Department of Computer Applications, National Institute of Technology, Tiruchirappalli, Tamilnadu 620015, India
2High Performance Computing Lab, Department of Computer Applications, National Institute of Technology, Tiruchirappalli, Tamilnadu 620015, India
E-mail: nickolas@nitt.edu; shoeng97@gmail.com
Corresponding Author
Received 11 June 2021; Accepted 30 September 2021; Publication 27 December 2021
Abstract
Data pre-processing plays a vital role in the life cycle of data mining for accomplishing quality outcomes. In this paper, it is experimentally shown the importance of data pre-processing to achieve highly accurate classifier outcomes by imputing missing values using a novel imputation method, CLUSTPRO, by selecting highly correlated features using Correlation-based Variable Selection (CVS) and by handling imbalanced data using Synthetic Minority Over-sampling Technique (SMOTE). The proposed CLUSTPRO method makes use of Random Forest (RF) and Expectation Maximization (EM) algorithms to impute missing. The imputed results are evaluated using standard evaluation metrics. The CLUSTPRO imputation method outperforms existing, state-of-the-art imputation methods. The combined approach of imputation, feature selection, and imbalanced data handling techniques has significantly contributed to attaining an improved classification accuracy (AUC curve) of 40%–50% in comparison with results obtained without any pre-processing.
Keywords: Data Mining, data pre-processing, decision trees, expectation maximization (EM) algorithms, neural networks.
1 Introduction
In the longevity of data mining, data preparation or pre-processing plays a key role because data collected in real-world applications often contain erroneous data due to various reasons like an individual’s non-response for several questions during survey, equipment errors or human errors. Data mining (supervised and unsupervised) algorithms give good quality results when complete balanced data sets are given as input. Hence, erroneous data like data with missing values (instances/features), need to be treated before mining the data.
Essential factors to be considered during the process of handling missing data, called data imputation, are the type of missing values and choosing the right methods to fill the missing data.
Machine learning (ML) algorithms have demonstrated their fame and excellent execution crosswise over a variety of areas [1]. The ML algorithms are prevalent because of their capacity to accomplish high exactness. However, based on the literature study it is observed that numerous researchers have not focused on the combined effect of pre-processing steps like imputation, feature selection, and imbalanced data handling. Hence, this paper aims at proposing an imputation technique by clustering missing value data sets, implementing correlation-based feature selection, and handling data imbalance jointly as part of pre-processing to show the combined effect for classification accuracy.
The outline of the paper is as follows: Related Works are given in Section 2, Experimental Framework is provided in Section 3. The Results are discussed in Section 4, and the Conclusion and Scope for future work are given in Section 5.
2 Related Works
In the data mining domain, data integrity and accuracy are the key factors that influence the performance of prediction algorithms [2]. Various methods exist in the literature to overcome missing value problems.
The missing values are either blank or contains values such as NA, NaN, missing, and so on. Authors of [2] have described missing values as a value for a study that has no value designated to it. There are no benchmark methods to handle missing values. Several researchers marginalized missing values if the missing percentage is less than 5%, but this method creates a loss of data and bias in prediction results if the missing values are part of the minority class. However, many researchers handled the missing value problem if the data set has higher missing rate, [3].

Figure 1 Missing data mechanism:MCAR.
2.1 Handling Missing Values
Missing data patterns are classified into three different types, namely Missing Completely at Random (MCAR), Missing at Random (MAR), and Missing Not at Random (MNAR). The corresponding figure for each pattern is shown in Figures 1, 2, and 3 respectively [4]. MCAR occurs when missing data happens randomly, i.e., there is no exact pattern to be recognized, like an individual’s unwillingness to provide his/her data in a poll. In MAR, there exists a pattern of missing type hinges on the conditions of other variables. For example, in a survey where individuals are queried about their food practices and fitness condition, specific data about an inactive lifestyle might be available. However, some individuals may be willing to share the information about their weight, whereas other individuals (obese/ overweight) may not be interested in sharing this type of information. MNAR is similar to MAR, but, in this circumstance, the condition instigating missingness is not known. This can happen in two ways:
1. Missingness occurs due to the reason that the values were not observed and,
2. Missingness occurs when the variable takes values out of its scale.

Figure 2 Missing data mechanism:MAR.

Figure 3 Missing data mechanism:MNAR.
Generally, it is challenging to recognize the MCAR type of missing pattern, since, in a real-world data set, there is no method to track the reason for this missing pattern. MAR pattern identification becomes more difficult if further relevant questions are not asked. For example, if an individual reports poor health, based on other information like amount of money he/she spends to improve health condition need to be collected, as this information most likely depends only on individual reporting lousy health condition. If this sort of extra detail is not collected, then data may be misidentified as MCAR pattern instead of MAR pattern.
Numerous research works are in progress since 1980s to handle missing data. With the advent of imputation algorithms, applications like remote sensing, bio-informatics, privacy-preserving applications, traffic, meteorological, and medical fields have found them to be useful [5].
Some of the methods to handle missing values are listwise deletion, pairwise deletion, single imputation, multiple imputation, hot-deck imputation and model based imputation [5, 6]. Authors of [7] have examined the missing value problem for medical data sets, and proposed Tree-Based Models (TBMs) to impute the missing values based on the surrogate approach (SUR). Authors showed that imputation of missing values in medical data sets would boost the classifier outcomes in medical applications. Authors of [8] have suggested a kernel-based fuzzy kNN algorithm combined with a partial distance strategy for three different medical data sets to regain the missing values. The shortcoming of this method is that the authors marginalize the missing values whose entropy is not as precise as that of the predetermined limit. However, marginalization of records with missing values may not be acceptable for medical data. Apart from this, the fuzzy kNN algorithm showed good performance.
Authors of [9] have proposed a CNN-MDRP algorithm that integrates latent factor model with Convolution Neural Network-based multi-modal to rebuild the missing values and for disease prediction, respectively, for the patients’ records gathered from a hospital in Central China (2013–2015). The experimental outcome shows that imputing the missing values enriched the results of CNN-MDRP algorithm. Authors of [10] examined the influence of the missing values while building ArcGIS model in restricted data environment with application to disaster response. Three imputation methods were investigated viz., global constant, decision tree, and clustering-based algorithms.
Authors of [11] have made a result comparison between statistical and machine learning methods (e.g., multi-layer perceptron (MLP), Self-Organizing Maps (SOM) [12] and k-Nearest Neighbors(kNN) [13]) for breast cancer data set. Authors of [14, 15] have proposed an imputation algorithm for gene expression data using kNN and compared the results with mean imputation and Singular-Value Decomposition(SVD). They concluded that the kNN outperformed other two techniques. Authors of [13] have proposed kNN based imputation algorithm for imputation in microarray data, which outperformed Ordinary Least Square (OLS) and Partial Least Square (PLS) imputation methods.
Authors of [16, 17] have analyzed the classification results with complete case analysis and three different imputation techniques viz., hot-deck imputation, predictive model-based imputation, and propensity score imputation. Through the analysis, they have concluded that data set without any missing values gave more accurate results in comparison with incomplete data set. Authors of [18] have demonstrated the superiority of prediction results in complete case over different imputation techniques like missing-indicator method, single imputation of unconditional and conditional mean and multiple imputations. Authors of [19, 20] have demonstrated the use of choice tree models, measurable algorithmic models and Artificial Neural Network (ANN) model on foreseeing the danger of hypertension. Based on true positive rate and true negative rate analysis of the models, the authors identified good predictors for diagnosing hypertension.
2.2 Feature Selection
In recent years, numerous applications like genome projects, text categorization, image retrieval, and customer relationship management, etc., have contributed to increasing data volume [21, 22, 23, 24]. High dimensional data are very challenging to learning algorithms; an efficient method is needed to handle this. Therefore, researchers came up with a solution by selecting a subset of original features after eliminating irrelevant and redundant features; this technique is known as feature selection [25].
Feature selection reduces data optimally according to a predefined assessment criterion, thereby increasing the efficiency in learning tasks and predictive accuracy. Feature selection algorithms are of three categories: the filter, the wrapper, and hybrid methods [26, 27]. Filter methods are fast and classifier independent. This method uses various statistical tests and some proxy measure to identify the correlation of features with class variable and rank features based on these tests [28, 29, 30]. Whereas, wrapper methods are reliant on classifiers and use the classifier directly to mark the feature subsets. The accuracy of classification algorithm assists as evaluation criteria to measure the strength of feature subsets [31, 32, 27]. However, the important downside associated with wrapper methods are that they are prone to high computational complexity and over fitting. Hybrid approaches combine filter and wrapper techniques by using an independent metric to rank the features and using a learning algorithm to measure the goodness of feature subsets [33, 34].
2.3 Handling Imbalanced Data
As most of the data mining and machine learning algorithms give unbiased accuracy when the data is balanced, it is essential to handle imbalanced data to make class distribution uniform. Imbalanced data are found in various fields like churn prediction, fraud detection, industrial systems monitoring, activity recognition, software defect prediction, and health predictions, etc., To handle imbalanced data, three different approaches exist, [35]:
2.3.1 Data-level methods
This technique aims to adjust the training set to make it appropriate for a standard learning algorithm. Due to the bias introduced by random selection approach, methods that maintain structure of groups and, methods that generate new data according to the underlying distribution became popular. There are two popular techniques to handle imbalanced data, namely (a) oversampling: generating new objects for minority groups and (b) undersampling: removing objects from majority groups. These approaches are simple, but oversampling can increase the probability of overfitting by repeating the original copies of the data set samples, whereas under-sampling will eliminate the required data samples. To overcome these disadvantages, a new sampling technique, Synthetic Minority Oversampling Technique (SMOTE) was proposed by [36]. SMOTE arbitrarily picks up some nearest neighbors of minority class samples and generates new samples based on interpolations between original data set samples and randomly selected nearest neighbors.
2.3.2 Algorithm-level methods
In this process, learners are modified to alleviate their bias towards majority groups. The most popular approach is the cost-sensitive approach, in which a high cost is assigned to a less represented (minority class) set of objects; a low cost is assigned to a majority class, and performance will be boosted during learning process. Another algorithm-level solution is one-class learning, which eliminates bias towards any group by focusing on a single set of objects. Authors of [37, 38] have proposed an algorithm-level solution by assigning weights to cost-sensitive trees and by assigning dissimilar costs to class (majority and minority) in the objective function.
2.3.3 Hybrid methods
In recent years, ensemble solutions have gained popularity to treat the class imbalanced data sets. This method merges data-level solutions with classifier ensembles, resulting in robust and active learners.
Since the classification algorithms assume that the data is uniformly distributed, and the classification accuracy depends on this assumption, it is essential to pay more attention to handle imbalanced data. Table 1 give some techniques that were used by researchers to handle imbalanced data.
Table 1 Summary of existing studies in imbalanced data handling
| Authors | Techniques | Outcomes |
| [39] | Hypernet-Neural Network-based method | Earliest work in predicting and determining the proportion of Antihypertensive medications to administer every patient. |
| [40] | Statistical approaches | It provides a comparative study of statistical methods. Focuses on developing, validating impact analysis of hypertension risk prediction models. |
| [41, 20] | Compare the performances of decision tree models, statistical, algorithmic models and Artificial Neural Network (ANN) model on predicting the risk of hypertension disease | Identifies good predictor variables for diagnosing hypertension based on sensitivity and specificity analysis of the models. |
3 Experimental Framework
The flowchart of the proposed technique is shown in Figure 1 consisting of two phases, namely:
• Model building phase and
• Evaluation phase.
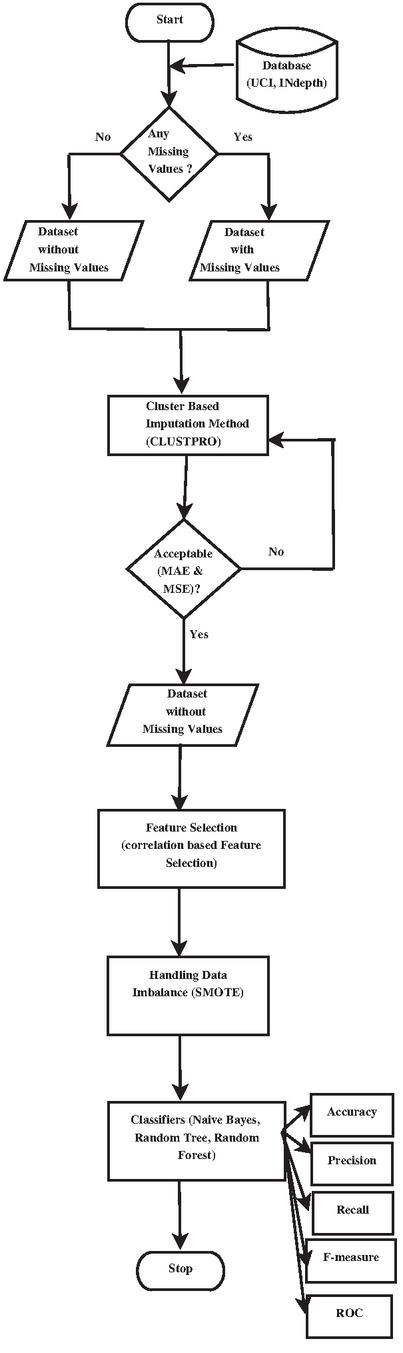
Figure 4 figure caption goes here.
3.1 Model Building Phase
In this phase, the selected data set undergoes various stages involving simulation of missing values, imputation with predicted values, feature selection, and handling of imbalanced data. The process involved in each stage of the model-building phase is explained below:
3.1.1 Simulation of missing data
To build the imputation model and for the experimentation work, data set with different missing percentages, varying from 5% to 30%, in steps of 5 were infused. The missing data generation methods generate missing values in a stochastic way, i.e., the position of the missing data are randomly generated to fulfill the criterion of the different missing pattern. The resultant data set with missing value is given to the next stage for imputation.
3.1.2 Imputation of missing values
In this paper, the imputation of missing values is performed by forming clusters using the unsupervised neural network, Adaptive Resonance Theory 2 (ART2) proposed by [42]. ART2 network is the second generation unsupervised network from the family of Adaptive Resonance Theory (ART). ART2 accepts continuous variables, by which it overcomes the drawbacks of the first generation network, Adaptive Resonance Theory 1 (ART1).
In the proposed imputation technique, the correlation among the features in a data set are considered, which is natural because of hidden internal characteristics of the data set, and thus cannot be altered to achieve desired results. Keeping this property as the base, the proposed CLUSTPRO method works on the principle of imputation accuracy, which is supposed to be having lower error rate (high accuracy) when the data set is having high correlations among features. The non-missing data instances are used as the base for imputing missing data instances [43].
The main steps involved in imputation are as follows.
• Clusters () containing both missing and non-missing data instances are formed using ART2.
• Clusters are partitioned into two sub data sets (cluster without missing data points) and (cluster with missing data points).
• Decision trees are constructed on using attributes with missing values in as class attributes. The steps involved in imputing categorical variables are as follows:
Let V=(, ), be a p*q dimensional data matrix. In this method, missing values are predicted using decision trees, trained based on the complete parts of the data set. For a random attribute , having missing values at records 1,2,…,n, data set can be divided into four parts:
1. The complete values of attribute . Represented as ;
2. The missing values of attribute . Represented as
3. The attributes other than , with observations 1,2,…,n represented as and;
4. The attributes other than with observations , represented as .
To instigate, a first guess is made for the missing observations in V using mode imputation technique. Then, the attribute , s 1,2,…,n is sorted according to the increasing order of the number of missing values. For each attribute , the missing values are imputed by first fitting a decision trees within dependent variable (response) and independent variable (predictors) ; then, predicting the missing values by applying the trained decision trees to . The imputation process is repeated until all the missing values are imputed. Algorithm 1 gives the representation of proposed Algorithm 1 gives the representation of proposed Impute_RF method for imputing categorical values:

The stopping condition is encountered as soon as the variance between the newly imputed data matrix and the previously imputed data matrix increases for the first time concerning categorical variable types, if present. Here, the difference for the set of categorical variables ’N’ is computed using Equation (1):
| (1) |
Where, #NAN is the number of missing values in the categorical variables.
• EM is applied to impute attribute with numerical missing value [44].
The steps involved in EM algorithm are as follows:
1. Let X be the data without any missing data, Y be the missing data and Z=(X,Y) be the complete data. The aim is to maximize the observed loglikelihood
2. The EM algorithm works in two steps: – The Expectation step computes the expectation of the complete loglikelihood given observations X i.e., let be the current guess for . The Expectation step is calculated as in Equation (2):
| (2) |
where is the complete loglikelihood.
3. The Maximization step maximizes as function of to get .
• Combine and to obtain complete data without any missing data points.
3.1.3 Feature selection
Obtaining a good prediction result depends on right predictor variables. Sometimes due to high dimensionality of the data set, it is hard to obtain good prediction outcomes. Feature selection is one important technique which helps in identifying whether or not a particular attribute should be involved in prediction. This process aims to decrease the dimensionality of the data set thereby improving the performance of prediction algorithms.
In this paper, a CVS mechanism is used to select the relevant features which are individually in high correlation with class variable [28]. Correlation coefficients are used to evaluate the correlation between attributes, class, and inter-correlations between the features. CVS quickly identifies and discards irrelevant, redundant features by judging the predictive capability of each attribute in conjunction with the scale of redundancy between them. CVS is a filter approach where execution is faster than the wrapper methods, thereby reducing high computational cost. This property allows CVS to scale to more massive data sets also. Another advantage of CVS algorithm is the full automatic execution without any requirement of setting thresholds or the number of features to be selected.
CVS is calculated using Equation (3):
| (3) |
where is the correlation between the summed feature subsets and the class variable, ‘n’ is the number of subset features, is the average of the correlations between the subset features and the class variable and is the average inter-correlation between the subset features.
3.1.4 Handling imbalanced data
To handle samples of minority class which are less in number, a feature space method called SMOTE is used in the next stage of model building phase to overcome imbalance data, [36]. It is one type of oversampling technique which generates synthetic samples by preferably considering feature space of data set rather than data space. Artificial data are generated by using bootstrapping and kNN. SMOTE deals with continuous and nominal attributes in different ways. For the continuous attributes, Euclidean distance is used to compute the distance between nearest neighbors for the minority classes. Synthetic samples are generated by oversampling each minority class. Depending upon the percentage of over-sampling required, nearest neighbors are arbitrarily chosen.
The advantage of SMOTE algorithm is that it mitigates overfitting problem caused by random oversampling technique, and generates synthetic samples rather than replicating the instances. Since, new instances are generated, there will be no loss of information as it happens in oversampling and undersampling techniques. Also, the computational cost of SMOTE is less.
For example, if the percentage of over-sampling required is 300%, only three neighbors from the nearest neighbors are chosen, and samples will be created in the path of each neighbor.
SMOTE is represented as in Equation (4):
| (4) |
Where is the synthetic data, is the examples from minority class, is one of nearest neighbor from and is the random number between 0 and 1.
3.2 Model Evaluation Phase
The proposed imputation algorithm, CLUSTPRO, is compared with existing CART and Random Forest (RF) imputation techniques [45, 46]. The algorithms are evaluated with MAE and MSE as performance metrics. The performance of imputation algorithms and other pre-processing techniques such as variable selection and imbalanced data handling on Iris and Pima diabetes data sets from UCI repository and one hypertension data set from INDEPTH repository are shown and discussed in detail in the results and discussion section.
4 Results and Discussions
4.1 Data Set Description
To assess the goodness of the proposed model, Iris and Pima diabetes data set from the UCI repository and Vadu dataset from INdepth repository are used:
Iris data set was randomly simulated with different missing percentages, varying from 5% to 30%, in multiples of 5. This is a classification data set with four attributes, 150 instances, and it is a multi-class (three class) balanced data set.
Pima diabetes data set was randomly simulated with different missing percentages, varying from 5% to 30%, in multiples of 5. This is a classification data set with nine attributes, 769 instances, and is a dichotomous class imbalance (two-class) data set.
Similarly, the Vadu hypertension data set was randomly simulated with different missing percentages, varying from 5% to 30%, in multiples of 5. This is a classification data set with 46 attributes, 18,429 instances, and is a dichotomous class imbalance (two-class) data set.
For the Iris, Pima, and Vadu data sets, the missing data points were randomly simulated with varying percentages varying from 5% to 30% in steps of 5. Authors of [47] have stated that a missing rate of 15% to 20% is common and acceptable. Considering this, the proposed algorithm is evaluated only up to 30% of missing values to study its performance.
Evaluation metrics:
The efficiency of the proposed imputation technique is evaluated using MAE and MSE on simulated missing patterns. The values shown in Tables 2, 3 and 4 are the error rates of CART, Random Forest and the proposed CLUSTPRO imputation algorithms on Iris, Pima and Vadu data set. In this type of evaluation, metrics with lower value is better, i.e., lower the error rates, higher the accuracy of imputation model. The error rates of the proposed cluster based imputation method outperforms CART and Random Forest imputation methods with lower error rates even at higher percentage of missing value.
Table 2 Error rates comparison for Iris data set
| MAE | MSE | |||||
| Missing % | Random Forest | CART | CLUST PRO (Proposed) | Random Forest | CART | CLUST PRO (Proposed) |
| 5 | 0.17 | 0.37 | 0.05 | 0.01 | 0.05 | 0.007 |
| 10 | 0.47 | 0.61 | 0.11 | 0.04 | 0.08 | 0.02 |
| 15 | 0.61 | 0.94 | 0.15 | 0.07 | 0.12 | 0.03 |
| 20 | 1.17 | 1.35 | 0.24 | 0.11 | 0.15 | 0.06 |
| 25 | 1.55 | 1.72 | 0.28 | 0.19 | 0.21 | 0.11 |
| 30 | 1.97 | 2.42 | 0.33 | 0.25 | 0.37 | 0.14 |
Table 3 Error rates comparison for Pima data set
| MAE | MSE | |||||
| Missing % | Random Forest | CART | CLUST PRO (Proposed) | Random Forest | CART | CLUST PRO (Proposed) |
| 5 | 0.27 | 0.79 | 0.05 | 0.03 | 0.15 | 0.01 |
| 10 | 0.47 | 1.52 | 0.11 | 0.05 | 0.21 | 0.02 |
| 15 | 0.84 | 2.74 | 0.17 | 0.07 | 0.39 | 0.04 |
| 20 | 1.03 | 3.21 | 0.23 | 0.12 | 0.41 | 0.09 |
| 25 | 1.45 | 3.72 | 0.27 | 0.18 | 0.55 | 0.11 |
| 30 | 2.46 | 4.07 | 0.32 | 0.36 | 0.71 | 0.13 |
Table 4 Error rates comparison for Vadu data set
| MAE | MSE | |||||
| Missing % | Random Forest | CART | CLUST PRO (Proposed) | Random Forest | CART | CLUST PRO (Proposed) |
| 5 | 0.13 | 0.50 | 0.06 | 0.10 | 0.63 | 0.03 |
| 10 | 0.16 | 0.65 | 0.05 | 0.19 | 0.72 | 0.03 |
| 15 | 0.29 | 1.01 | 0.08 | 0.29 | 1.06 | 0.05 |
| 20 | 0.43 | 1.53 | 0.10 | 0.47 | 1.56 | 0.07 |
| 25 | 0.47 | 1.77 | 0.13 | 0.55 | 1.97 | 0.09 |
| 30 | 0.86 | 2.52 | 0.16 | 0.77 | 2.24 | 0.12 |
To check the correlation between the original and imputed information, the Pearson constant correlation was calculated for the three imputation methods. The correlations tend to be stronger for the proposed CLUSTPRO imputation method as compared to CART and Random Forest imputation for both Iris and Pima data set. At the point when the missing rate was 5% or less, almost without exception, all imputation methods resulted in a correlation of 0.95 between original and imputed data. The mean correlation between the original and imputed data for CART, Random Forest, and the proposed imputation was 0.93, 0.95, and 0.98 respectively, for Iris and Pima data sets. For Vadu data set, the mean correlation was 0.95, 0.96, and 0.99 respectively, which indicates that the correlation is strongest for the proposed imputation method and weakest for CART imputation.
To show the importance of the combined effect of pre-processing techniques for quality results, feature selection, and imbalanced class handling were applied in addition to the proposed imputation method. The Vadu data set is chosen for experimentation because of its high dimensional features and large instances when compared to the Iris and Pima data sets. This data set is evaluated with classification algorithms for finding the effect of different combinations of data imputation, feature selection, and imbalanced data handling techniques. Although existing works have explored missing data handling strategies, their results were supported by different variations of sample size, the amount of missing data, and missing data treating methodology. None of the past studies have dealt with missing data handling, feature selection, and class imbalance handling factors collectively using the same data set for better prediction of results. This work performs all these factors together in order to improve the classifier accuracy.
For better understanding the need for a combined approach of the missing data handling method, feature selection and imbalanced data handling methods, experiments were conducted with Vadu data set after marginalization, imputation and the proposed combined approach. The output obtained after applying each method is given to three different classifiers namely Naive Bayes, Random Forest and Random Tree for prediction accuracy.
Figures 5, 6 and 7 presents the outcome of different classifiers evaluated on Vadu data set after performing proposed CLUSTPRO algorithm for data imputation, CVS for feature selection and SMOTE for handling data imbalance. The results of combined approach are compared with data set after marginalization and data set after performing only imputation.

Figure 5 Performance results of Naive Bayes classifier after marginalization, imputation and the proposed combined approach.

Figure 6 Performance results of Random Tree Classifier after Marginalization, Imputation, and the proposed Combined Approach.

Figure 7 Performance results of Random Forest Classifier after Marginalization, Imputation, and the proposed Combined Approach.

Figure 8 ROC comparison of (a) Proposed combined approach and (b) Marginalized data set-Naive Bayes Classifier.

Figure 9 ROC comparison of (a) Proposed combined approach and (b) Marginalized data set-Random Tree Classifier.
The outcome for the Vadu data set after the dropping missing values (marginalized data) was found to be low when tested with three different classification algorithms. The performance after imputation has shown slight improvement, and the data set with the proposed combined approach of imputation, feature selection, and class imbalance handling has shown significant improvement, which is observed from the result of the three classifiers.
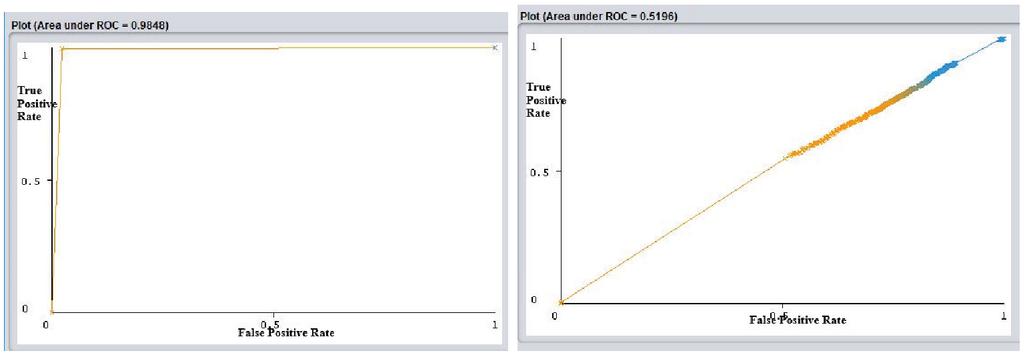
Figure 10 ROC comparison of (a) Proposed combined approach and (b) Marginalized data set-Random Forest Classifier.
The ROC curve is beneficial to analyze test evaluation. It is a graph plotted with true positive rate (Sensitivity) against false positive rate (1-Specificity). The Area Under the Curve (AUC) signifies the degree of how well a parameter can be distinguished between two groups.
Figures 8, 9 and 10 represent ROC curve for data set after pre-processing with a proposed combined approach of imputation, feature selection, and imbalanced data handling and the marginalized data, respectively.
Analyzing the classifier outcomes of the pre-processed data with the combined approach and marginalized data, it is observed from Figures 5, 6 and 7 that, for the marginalized data set, the Precision, Recall, Fmeasure, and Accuracy ranges between 0.7–0.8 for different classifiers. Whereas, Figures 5(b), 6(b), and 7(b) show that the AUC curve values ranged between 0.5–0.55 only for the marginalized data, which is considered as very low as compared to the results of pre-processed data with the combined approach. Figures 5(a), 6(a), and 7(a) show that the classifier outcomes ranged between 0.97–1 for the three classifiers considering the combined effect of the proposed CLUSTPRO imputation, feature selection, and imbalanced data handling strategy. Hence, it can be concluded that the combined pre-processing methods using CLUSTPRO, CVS, and SMOTE show significant improvement in classification algorithms for performance enhancement.
Comparison of proposed work CLUSTPRO with the hybrid models Authors of [48] has proposed a method for incomplete data imputation using stacked auto-encoder and incremental clustering (SAICI). SAICI’s functionality works on four principles:
• a distinctive value assigned to impute missing values initially
• the stacked auto-encoder(SAE) applied to locate principal features
• a new incremental clustering utilized to partition incomplete data set, and
• the top k% nearest neighbors’ weighted values designed to refill the missing values.

Figure 11 Comparison of RMSE for proposed CLUSTPRO approach and existing hybrid approach for Iris dataset.
Authors of [49] has proposed the procedure for making an Imputation, which makes use of the local similarity structure of the dataset. The K-means clustering technique along with the weighted KNN makes efficient imputation of the missed value. K-means approach is used as a clustering approach consisting of a four-step procedure.
• The first step is the random selection of a fixed number of cluster centroids.
• The second step is the assignment of each record to a certain cluster having the closest centroid.
• The third step is the recalculation of the cluster centroid.
• The last step states to iteratively repeat the procedure from step second if the algorithm does not reach the termination condition.

Figure 12 Comparison of RMSE for proposed CLUSTPRO approach and existing hybrid approach for Pima dataset.

Figure 13 Comparison of RMSE for proposed CLUSTPRO approach and existing hybrid approach forVadu dataset.
The last step in the imputation is to use the cluster information and provide value for each non-reference attribute having an incomplete object. Objects falling in the same cluster are considered as the nearest neighbor of missing values having higher similarity and based on the nearest neighbors missing values are imputed. Figures 11, 12, and 13 shows the RMSE values values of the proposed CLUSTPRO approach and existing hybrid approaches for Iris, Pima and Vadu dataset respectively.
5 Conclusion and Future Work
In this paper, CLUSTPRO, a novel algorithm for data imputation, is proposed for handling the missing data which will affect the quality of results in data mining. The proposed CLUSTPRO method works in two phases: the model-building phase and the evaluation phase. In the model-building phase, the imputation model has been built, and the results were evaluated using MSE and MAE. In order to evaluate the classifier accuracy after data imputation, a combined approach of data imputation, feature selection, and data imbalance is performed over the Vadu data set, and the enhancement of classifier accuracy is evaluated with the three classifiers. The comparison of classifier results for the data set with marginalization, imputation and combined approach shows that the preprocessed data set using the combined approach has outperformed by improving the classification accuracy by 40%–50%. From this, it can be concluded that pre-processing steps like imputation, feature selection and imbalanced data handling techniques when applied together enhances classification accuracy. As future work, the proposed imputation method could be applied to different real-time data sets and deep learning methods could be adapted to handle the missing values.
The limitations of the proposed method is it works fine with the datasets with multi-class the datasets but it shows poor performance for the datasets with multi-labels.
References
[1] K Shobha and S Nickolas. Analysis of importance of pre-processing in prediction of hypertension. CSI Transactions on ICT, 6(2):209–214, 2018.
[2] Hamza Turabieh, Amer Abu Salem, and Noor Abu-El-Rub. Dynamic l-rnn recovery of missing data in iomt applications. Future Generation Computer Systems, 89:575–583, 2018.
[3] Amir Momeni, Matthew Pincus, and Jenny Libien. Imputation and missing data. In Introduction to Statistical Methods in Pathology, pages 185–200. Springer, 2018.
[4] Unai Garciarena and Roberto Santana. An extensive analysis of the interaction between missing data types, imputation methods, and supervised classifiers. Expert Systems with Applications, 89:52–65, 2017.
[5] Donald B Rubin. Multiple imputation for nonresponse in surveys, volume 81. John Wiley & Sons, 2004.
[6] Barry L Ford. An overview of hot-deck procedures. Incomplete data in sample surveys, 2(Part IV):185–207, 1983.
[7] Saiedeh Haji-Maghsoudi, Azam Rastegari, Behshid Garrusi, and Mohammad Reza Baneshi. Addressing the problem of missing data in decision tree modeling. Journal of Applied Statistics, 45(3):547–557, 2018.
[8] Suhani Sen, Madhabananda Das, and Rajdeep Chatterjee. Estimation of incomplete data in mixed dataset. In Progress in Intelligent Computing Techniques: Theory, Practice, and Applications, pages 483–492. Springer, 2018.
[9] Min Chen, Yixue Hao, Kai Hwang, Lu Wang, and Lin Wang. Disease prediction by machine learning over big data from healthcare communities. Ieee Access, 5:8869–8879, 2017.
[10] Kezban Yagci Sokat, Irina S Dolinskaya, Karen Smilowitz, and Ryan Bank. Incomplete information imputation in limited data environments with application to disaster response. European Journal of Operational Research, 269(2):466–485, 2018.
[11] Heikki Junninen, Harri Niska, Kari Tuppurainen, Juhani Ruuskanen, and Mikko Kolehmainen. Methods for imputation of missing values in air quality data sets. Atmospheric Environment, 38(18):2895–2907, 2004.
[12] José M Jerez, Ignacio Molina, Pedro J García-Laencina, Emilio Alba, Nuria Ribelles, Miguel Martín, and Leonardo Franco. Missing data imputation using statistical and machine learning methods in a real breast cancer problem. Artificial intelligence in medicine, 50(2):105–115, 2010.
[13] Danh V Nguyen, Naisyin Wang, and Raymond J Carroll. Evaluation of missing value estimation for microarray data. Journal of Data Science, 2(4):347–370, 2004.
[14] Olga Troyanskaya, Michael Cantor, Gavin Sherlock, Pat Brown, Trevor Hastie, Robert Tibshirani, David Botstein, and Russ B Altman. Missing value estimation methods for dna microarrays. Bioinformatics, 17(6):520–525, 2001.
[15] Gerhard Tutz and Shahla Ramzan. Improved methods for the imputation of missing data by nearest neighbor methods. Computational Statistics & Data Analysis, 90:84–99, 2015.
[16] Kay I Penny and Thomas Chesney. Imputation methods to deal with missing values when data mining trauma injury data. In 28th International Conference on Information Technology Interfaces, 2006., pages 213–218. IEEE, 2006.
[17] Suzan Arslanturk, Mohammad-Reza Siadat, Theophilus Ogunyemi, Kim Killinger, and Ananias Diokno. Analysis of incomplete and inconsistent clinical survey data. Knowledge and Information Systems, 46(3):731–750, 2016.
[18] Geert JMG Van der Heijden, A Rogier T Donders, Theo Stijnen, and Karel GM Moons. Imputation of missing values is superior to complete case analysis and the missing-indicator method in multivariable diagnostic research: a clinical example. Journal of clinical epidemiology, 59(10):1102–1109, 2006.
[19] Imran Kurt, Mevlut Ture, and A Turhan Kurum. Comparing performances of logistic regression, classification and regression tree, and neural networks for predicting coronary artery disease. Expert systems with applications, 34(1):366–374, 2008.
[20] Daniel LaFreniere, Farhana Zulkernine, David Barber, and Ken Martin. Using machine learning to predict hypertension from a clinical dataset. In 2016 IEEE Symposium Series on Computational Intelligence (SSCI), pages 1–7. IEEE, 2016.
[21] Eric P Xing, Michael I Jordan, Richard M Karp, et al. Feature selection for high-dimensional genomic microarray data. In ICML, volume 1, pages 601–608. Citeseer, 2001.
[22] Yiming Yang and Jan O Pedersen. A comparative study on feature selection in text categorization. In Icml, volume 97, page 35, 1997.
[23] Yong Rui, Thomas S Huang, and Shih-Fu Chang. Image retrieval: Current techniques, promising directions, and open issues. Journal of visual communication and image representation, 10(1):39–62, 1999.
[24] Kiansing Ng and Huan Liu. Customer retention via data mining. Artificial Intelligence Review, 14(6):569–590, 2000.
[25] Lei Yu and Huan Liu. Feature selection for high-dimensional data: A fast correlation-based filter solution. In Proceedings of the 20th international conference on machine learning (ICML-03), pages 856–863, 2003.
[26] Sanmay Das. Filters, wrappers and a boosting-based hybrid for feature selection. In Icml, volume 1, pages 74–81, 2001.
[27] Ron Kohavi and George H John. Wrappers for feature subset selection. Artificial intelligence, 97(1-2):273–324, 1997.
[28] Mark Andrew Hall. Correlation-based feature selection for machine learning. 1999.
[29] Azlyna Senawi, Hua-Liang Wei, and Stephen A Billings. A new maximum relevance-minimum multicollinearity (mrmmc) method for feature selection and ranking. Pattern Recognition, 67:47–61, 2017.
[30] Guodong Zhao, Yan Wu, Fuqiang Chen, Junming Zhang, and Jing Bai. Effective feature selection using feature vector graph for classification. Neurocomputing, 151:376–389, 2015a.
[31] Cheng-Lung Huang and Chieh-Jen Wang. A ga-based feature selection and parameters optimizationfor support vector machines. Expert Systems with applications, 31(2):231–240, 2006.
[32] Surya S Durbha, Roger L King, and Nicolas H Younan. Wrapper-based feature subset selection for rapid image information mining. IEEE Geoscience and Remote Sensing Letters, 7(1):43–47, 2009.
[33] Pablo Bermejo, Jose A Gámez, and Jose M Puerta. A grasp algorithm for fast hybrid (filter-wrapper) feature subset selection in high-dimensional datasets. Pattern Recognition Letters, 32(5):701–711, 2011.
[34] Saúl Solorio-Fernández, J Ariel Carrasco-Ochoa, and José Fco Martínez-Trinidad. A new hybrid filter–wrapper feature selection method for clustering based on ranking. Neurocomputing, 214:866–880, 2016.
[35] Satyam Maheshwari, Jitendra Agrawal, and Sanjeev Sharma. New approach for classification of highly imbalanced datasets using evolutionary algorithms. Intl. J. Sci. Eng. Res, 2:1–5, 2011.
[36] Nitesh V Chawla, Kevin W Bowyer, Lawrence O Hall, and W Philip Kegelmeyer. Smote: synthetic minority over-sampling technique. Journal of artificial intelligence research, 16:321–357, 2002.
[37] Kai Ming Ting. An instance-weighting method to induce cost-sensitive trees. IEEE Transactions on Knowledge and Data Engineering, 14(3):659–665, 2002.
[38] Konstantinos Veropoulos, Colin Campbell, Nello Cristianini, et al. Controlling the sensitivity of support vector machines. In Proceedings of the international joint conference on AI, volume 55, page 60, 1999.
[39] Riccardo Poli, Stefano Cagnoni, Riccardo Livi, Giuseppe Coppini, and Guido Valli. A neural network expert system for diagnosing and treating hypertension. Computer, 24(3):64–71, 1991.
[40] Justin B Echouffo-Tcheugui, G David Batty, Mika Kivimäki, and Andre P Kengne. Risk models to predict hypertension: a systematic review. PloS one, 8(7):e67370, 2013.
[41] Mevlut Ture, Imran Kurt, A Turhan Kurum, and Kazim Ozdamar. Comparing classification techniques for predicting essential hypertension. Expert Systems with Applications, 29(3):583–588, 2005.
[42] Gail A Carpenter and Stephen Grossberg. Adaptive resonance theory. Springer, 2017.
[43] Daniel J Stekhoven and Peter Bühlmann. Missforest—non-parametric missing value imputation for mixed-type data. Bioinformatics, 28(1):112–118, 2011.
[44] Arthur P Dempster, Nan M Laird, and Donald B Rubin. Maximum likelihood from incomplete data via the em algorithm. Journal of the Royal Statistical Society: Series B (Methodological), 39(1):1–22, 1977.
[45] Natalie K Donovan, Kenneth A Foster, and Carlos Alberto Parra Salinas. Analysis of green coffee quality using hermetic bag storage. Journal of Stored Products Research, 80:1–9, 2019.
[46] Daniel J Stekhoven. missforest: nonparametric missing value imputation using random forest. Astrophysics Source Code Library, 2015.
[47] Craig K Enders. Using the expectation maximization algorithm to estimate coefficient alpha for scales with item-level missing data. Psychological methods, 8(3):322, 2003.
[48] Liang Zhao, Zhikui Chen, Zhennan Yang, and Yueming Hu. A hybrid method for incomplete data imputation. In 2015 IEEE 17th International Conference on High Performance Computing and Communications, 2015 IEEE 7th International Symposium on Cyberspace Safety and Security, and 2015 IEEE 12th International Conference on Embedded Software and Systems, pages 1725–1730. IEEE, 2015b.
[49] Aditya Dubey and Akhtar Rasool. Data mining based handling missing data. In 2019 Third International conference on I-SMAC (IoT in Social, Mobile, Analytics and Cloud)(I-SMAC), pages 483–489. IEEE, 2019.
Biographies

S. Nickolas is a Professor in the Department of Computer Applications, National Institute of Technology, Tiruchirappalli, Tamilnadu, India. He received his M.E. Computer Science from REC, Trichy in 1992 and Ph.D in the year 2007 from NIT, Trichy. He is the Professor In-Charge of the Massively Parallel Programming Laboratory, NVIDIA CUDA Teaching Centre, NIT, Trichy. His research interest includes Evolutionary Algorithms, Data Mining, Big Data Analytics, Distributed Computing, Cloud Computing and Software Metrics.

K. Shobha is a Research Scholar in the Department of Computer Applications, National Institute of Technology, Tiruchirappalli, Tamilnadu, India. Her research interest Data Mining, Big Data Analytics, Cloud Computing and Software Metrics, Computer Networks.
Journal of Web Engineering, Vol. 21_2, 203–228.
doi: 10.13052/jwe1540-9589.2124
© 2021 River Publishers