Parsimonious Approach to in Analyzing Brainwaves for VR Users
Gi-Sung Oh1, Won-Jun Jeong1, Sung-Jin Cho2 and Seok-Hee Oh1,*
1Department of Computer Engineering, Gachon University, Seongnam-si, Gyeonggi-do, 13120, Republic of Korea
2Department of Psychiatry, Gachon University, Gil Medical Center, Incheon, 21565, Republic of Korea
E-mail: eustia@gachon.ac.kr; tp04045@gachon.ac.kr; sjcho@gachon.ac.kr; seokhee5@gachon.ac.kr
*Corresponding Author
Received 30 October 2021; Accepted 20 May 2022; Publication 18 August 2022
Abstract
For the development of virtual reality (VR) technology, research to solve the VR Sickness is essential. Many attempts have been made to measure and reduce VR Sickness using questionnaires, analysis, and bio-signals, but it is true that analytical research through clinical practice still lacks. In this paper, the researcher collected bio-signals and questionnaire data to analyze the correlation between VR Sickness and user and perform principal component analysis and chi-square independence test based on the collected data. As a result, the researcher was able to be aware of the user’s concentration and relaxation state by EEG and found they are correlated with VR Sickness. Finally, the result of the analysis was cross-checked to confirm that these correlations show a significant difference. The empirical result of this study is expected to be used for the research to reduce VR Sickness through bio-signal.
Keywords: VR sickness, EEG, SSQ, PCA, test of independence.
1 Introduction
Virtual reality (VR) is one of the major technological innovations to be brought by the Fourth Industrial Revolution. In recent years, the VR market has been extended to consumers, and is being used in various fields such as games, arts and education [1]. Since 2015, a variety of consumer VR devices have been launched, and products such as standalone head mounted displays (HMDs), which do not require a high-performance PC, are now appearing. As the development of the 5th generation mobile communication (5G) will give more momentum to the development of VR technology, the prospect of the VR market is still bright [2–4]. However, there is also a lot of skepticism about VR. Most of VR contents still requires extra hardware in addition to the HMD and requires a relatively large amount of space. In addition, the number of contents is absolutely small. However, the expansion of the VR market can be felt every year through the increase in sales volume of VR HMDs around the world, and with the development of hardware, VR devices are gradually becoming wireless and high-specified and the price is getting cheaper. With the continued efforts of the industry, the shortcomings of VR are gradually overcome. In order to respond to this movement, schools are conducting research on virtual reality more actively than ever as a subject of various technical cooperation and convergence research [5, 6].
In addition to the shortcomings mentioned above, VR also has a VR Sickness that directly affects the user’s usability. VR Sickness continues to cause problems in the safety and user experience of VR content, and the symptoms vary depending on the user and external factors [7–9].
Frequently, people who had no 3D symptoms at all complain of VR Sickness and visual fatigue. Efforts to improve VR Sickness have been continued through interdisciplinary convergence research. Based on existing research cases, content-oriented technology research such as viewing angle and directing method is being conducted [10–12]. Various analysis and measurement studies using bio-signals or eye tracking technology are also in progress, but research on user-centered factors using data obtained from actual subjects is still insufficient [13–16].
This study analyzes VR Sickness triggering factors using bio-signals and questionnaire data of VR users collected under clinical process. Bio-signal data analyzes factors that affect VR Sickness through major component analysis and performs independence test between bio-signal data and questionnaire data. Based on this, the correlation between the major component factors extracted and motion sickness will be presented.
2 Related Works
2.1 VR Sickness
VR Sickness is a common symptom among users who enjoy VR content. It accompanies physical fatigue, headache, and nausea-like general motion sickness. Previous studies have shown that motion sickness comes from the separation of vestibular sensory organs, which maintain a balance between vision and body [17]. In the vestibular sensory organs, there are three semicircular canals that sense the rotation, and the liquid in three semicircular canals rapidly flows through the three semicircular tubes when a stimulus above the threshold is caused by external movement. Each conflicting nerve signal data is transmitted to the brain, which causes confusion in the brain and causes motion sickness [18].
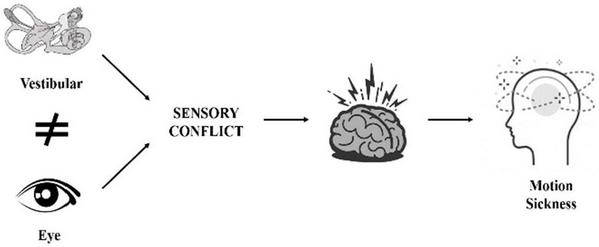
Figure 1 Sensory conflict.
Unlike normal motion sickness, however, VR Sickness is caused by a mismatch between motion and visual stimulus. There are many theories that explain VR Sickness, but there are two representative theories of ’Sensory Conflict’ and ’Posture Instability’ [19].
Sensory conflict theory assumes that the main senses associated with motion sickness are visual and vestibular sensations. In the case of conventional motion sickness, the two pieces of information are separated and caused by the collision between the two senses. However, in the case of VR, the positional information continuously changes through vision, but the sense of equilibrium of the vestibular organs has not clear information due to physical movements, so the conflict is maximized, causing motion sickness [19].
The postural instability theory assumes that the basis of the movement is to stabilize the posture according to the environment. This is because spontaneous tilting or giving strength to the body in accordance with the changing environment of the image in the virtual environment attempts to stabilize the posture. However, in an atmosphere of high volatility in virtual space, the existing attitude control ability is not sufficiently exhibited as in the real space. Therefore, posture instability is sustained due to an environment deviation, and fatigue increases, and motion sickness occurs. In addition, the viewing angle of the content, graphics options, latency on the hardware, etc. are reported to cause VR Sickness [20].
2.2 Biomedical Signal
The biological signal is a signal generated from a living body and refers to signals used to extract information from the biological system. It mainly represents a bioelectrical signal but may apply to both electrical and non-electrical signals. The bioelectrical signal represents a change in the electric current generated by a potential difference made in the nervous system or a cell and includes brain waves and blood flow [21–24].
Table 1 Types of brain waves according to frequency and voltage difference
| Variables | Description |
| Delta | Frequency band: 0.5–4 Hz It has a feature that it is mainly measured by deep sleep and produces a strong reaction in the scalp. |
| Theta | Frequency band: 4–8 Hz It is not well seen in adults and has a sawtooth amplitude.It is mainly measured in emotional or some cognitive states.When theta waves are measured, it may be pathologically linked to the slowing of the alpha waves. |
| Alpha | Frequency band: 8–13 Hz It is significantly measured in the awake state and produces a strong reaction in the larynx.It is most effectively measured with eyes closed or relaxed.Activity is blocked or attenuated when making mental efforts such as visual attention |
| Beta | Frequency band: 13–30 Hz Indicates a condition that increases alertness and intensive attention |
| Gamma | Frequency band: 30 Hz or more Gamma activity is linked to information processing (e.g., perception of sensory stimuli) (Voluntary movement, related to the speed of information processing in the brain. |
Electroencephalogram (EEG) is a record of electrical signals produced by the cooperative actions of brain cells. When measuring and analyzing these brain waves, power spectrum analysis is mainly used to classify data by frequency. EEG can be classified according to frequency and amplitude into alpha (frequency 8–13 Hz), beta (13–30 Hz), gamma (30 Hz and above), theta (4–8 Hz), and delta (0.5–4 Hz), as Table 1 [25–27].
Methods of measuring blood flow include HRV (Heart rate variability), PPG (Photoplethysmography), and ECG (Electrocardiogram) [28].
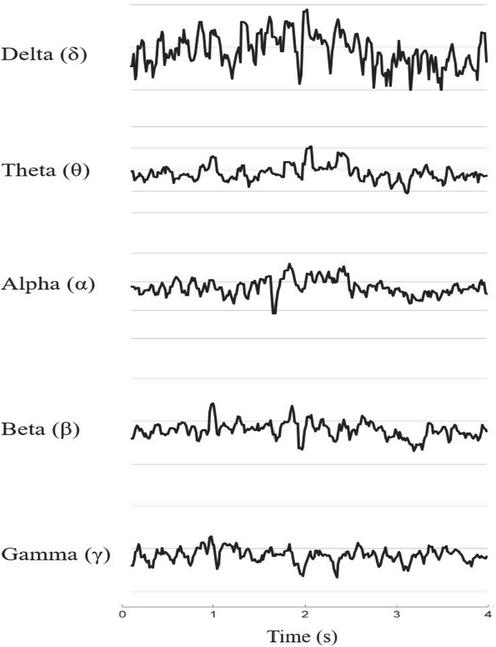
Figure 2 EEG (Electroencephalogram) signal.
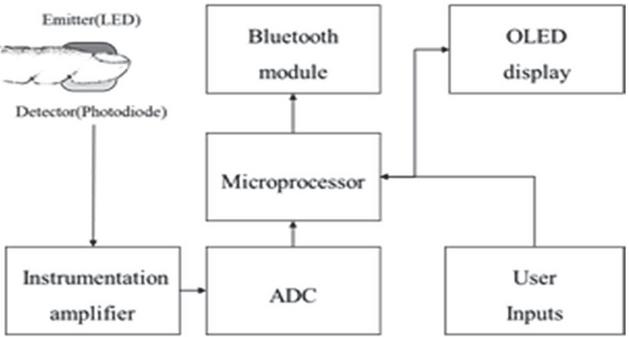
Figure 3 PPG conceptional diagram.
PPG irradiates the light on the finger from the light source to absorb the light in blood, bone, etc. and transmits some light to reach the photoreceptor. The degree of light absorption varies depending on the skin, bones, and blood flow located in the path through which the light passes. Since the factors affecting the light quantity change do not change except the blood flow rate, so it is possible to detect heart rate and blood flow changes [29–31].
3 Research Methodology
In this study, subjects experience VR contents and collect EEG and PPG biosignals and questionnaire data. Collected data are analyzed using two statistical techniques, PCA and Test of Independence.
3.1 VR Sickness
It is called dimension reduction to remove features that are not necessary for the features of the data and to extract only the features that describe the data. The major component analysis is one of the representative dimensional reduction techniques. It is a new variable that is not corelated or independent each other by paying attention to the correlations between variables and aggregates them into a small number of principal components without losing information as much as possible. It is mainly used to summarize data or to facilitate the interpretation of complex data [32–34].
The basic principle of the major component analysis is to obtain linear coefficients using covariance matrices of circular variables and to extract new variables called major components through a linear combination of circular variables. Major component variables are independent each other and are set to maximize variance. Therefore, it is possible to reduce the loss of correlation information between variables because it removes meaningless components with small variance in data interpretation. By extracting fewer variables than the number of prototype variables, they can easily understand the structure of complex data.
For example, the circular data and the covariance matrix of has an eigenvalue of and an eigenvector of corresponding to the eigenvalue. When this is linearly combined, the linear combination equation of each component Y is as follows.
Where, , and the variance of the linear combination equation is as follows:
The first major component, will be obtained by the linear combination equation in which is the maximum for the vector of that meets . The second major component, is independent from and induces to have the maximum variance. Major components will be obtained in turn through these processes. The explanation power explained by the major component is as follows:
It is reasonable to reduce the dimension to the dimension that accounts for about 90% of the total data. If the value of the above equation is 0.9 or more, most of the data can be explained by the m-th major components. This allows replacement of the m-th major components less than the original data order. As shown in Figure 4, the number of major components can be checked through the section in which the slope changes abruptly by sequencing the eigenvalues in the order of magnitude.
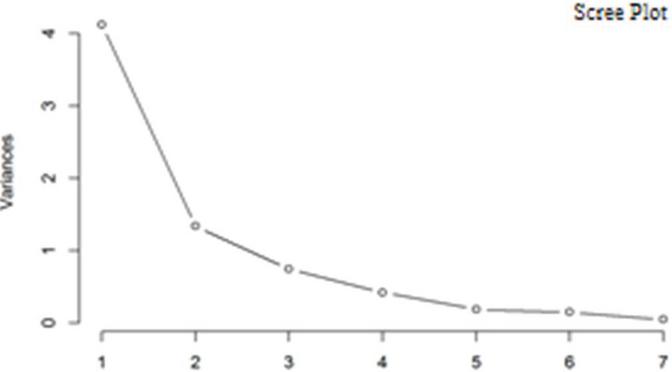
Figure 4 Scree plot.
3.2 Chi-Squared Test (-test)
The chi-square test, also called the Pearson Chi-Squared Test, is a method of testing for any significant differences between categorical data. Categorical data are data whose categories are classified according to their qualitative attributes. There are three types of tests for chi-square tests that cover categorical data: goodness-of-fit tests, homogeneity tests, and independence tests [35, 36].
The goodness-of-fit test is a method to test which theory or theoretical distribution the observations follow and is used primarily to determine whether the actual sample is the same as the distribution you think it is. The test of homogeneity is a method to test whether two groups have the same distribution. It is used to verify whether a sample of a population effectively represents a population. The test of independence is a hypothesis test for the independence between variables and is used to test for any significant differences and how they affect multiple variables. The independence test is calculated as follows.
First, calculate the estimated value of two nominal variables with below equation:
is the expected value, is the aggregation of the i-th row and is the aggregation of K-th column, and N means the total number. After calculating the expected value, calculate the value of independence test applying following chi-square test formula.
represents the chi-square test value for independence, refers to the observation value between two nominal variables and represents the estimated value of two nominal variables. Similarly, calculate the test statistics and compare it to the threshold value (). The threshold value is determined depending on the significance level and degree of freedom while the degree of freedom of chi-square test can be obtained by following formula:
R is the number of rows, and c is the number of columns. If the observed test statistic is larger than the threshold, as shown in the following equation, the null hypothesis can be rejected.
In this paper, we examine the correlation between the presence of motion sickness and the results of the questionnaire according to the distribution of major components identified by PCA.
3.3 Materials and Methods
In this study, EEG and PPG data were extracted using Blaubit’s brain wave device. Each EEG data is extracted as absolute power value for each frequency through power spectrum analysis. The experimental stimulus was selected and executed based on daily life content produced by Hancom GMD in Figure 5. The content was selected because it has less strenuous movement and is easier to find user-oriented motion sickness factors than other VR contents by constructing environment requirements similar to everyday life. HMD used in the experiment was VIVE PRO of HTC.
The overall experimental process is shown in Figure 6. First, the subject was fully explained about the function and experience before experiencing the contents. Since then, we have carried out the content experience. The total time was about 15 minutes. At the time of the experience, if the subject complained of excessive motion sickness, the content experience was supposed to be stopped immediately to allow rest. After the experience, the questionnaire was drawn up. In order to minimize the impact of the previous experimental environment and conditions on the next experiment, the process was repeated three times with a time difference of one day.
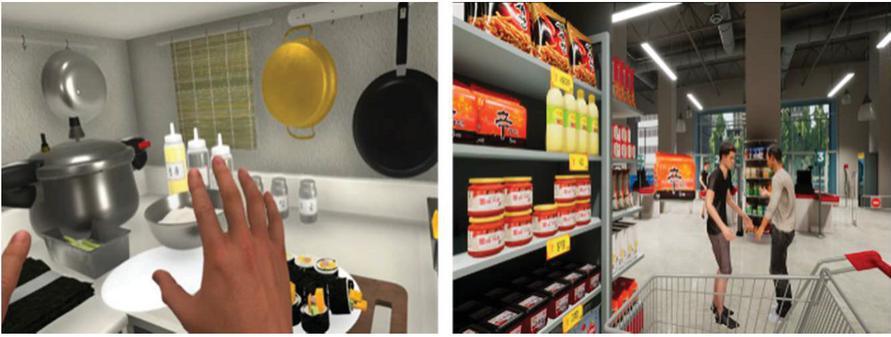
Figure 5 VR Contents selected as the experimental stimulus.
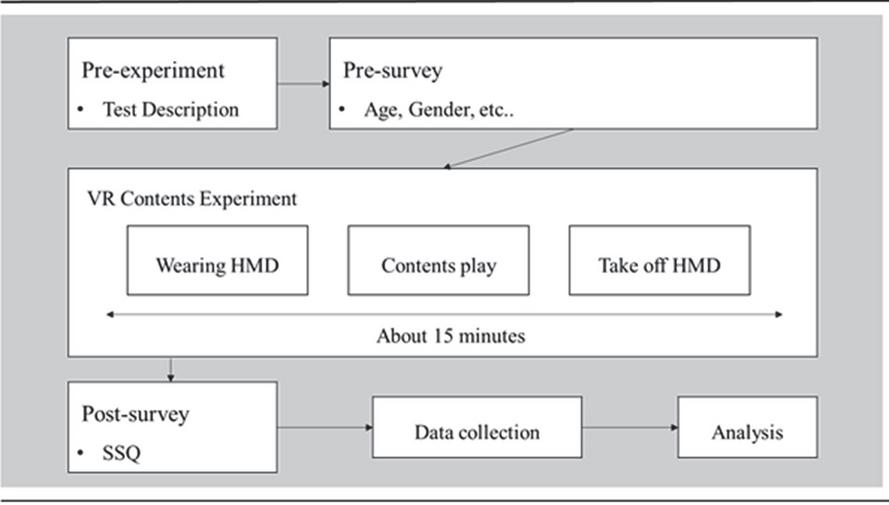
Figure 6 Overall experimental process.
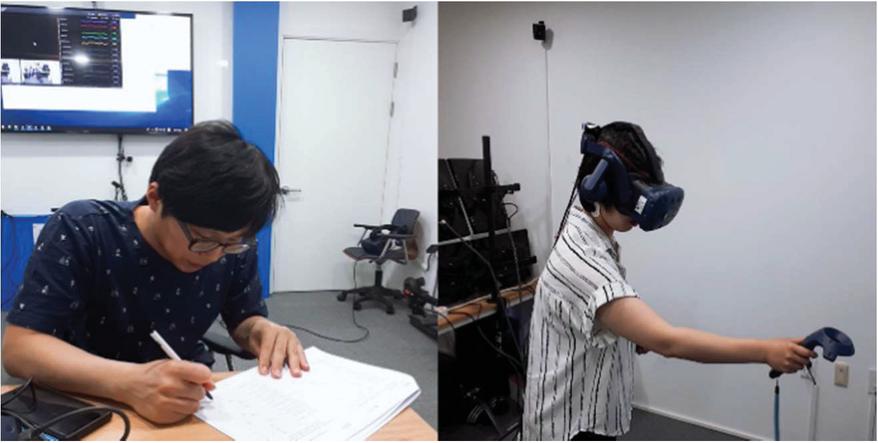
Figure 7 Example of an actual VR Sickness experiment.
Table 2 Computation of SSQ scores
| Weight | |||
| SSQ Symptom | Nausea-related | Oculomotor-related | Disorientation-related |
| General discomfort | 1 | 1 | |
| Fatigue | 1 | ||
| Headache | 1 | ||
| Eyestrain | 1 | ||
| Difficulty focusing | 1 | 1 | |
| Increased salivation | 1 | ||
| Sweating | 1 | ||
| Nausea | 1 | 1 | |
| Difficulty concentrating | 1 | 1 | |
| Fullness of head | 1 | ||
| Blurred vision | 1 | 1 | |
| Dizzy (eyes open) | 1 | ||
| Dizzy (eyes closed) | 1 | ||
| Vertigo | 1 | ||
| Stomach awareness | 1 | ||
| Burping | 1 | ||
| Total | [1] | [2] | [3] |
| Scoring | N [1] 9.54 | O [2] 7.58 | D [3] 13.92 |
| Total Score | TS {[1] [2] [3]} 3.74 | ||
The questionnaire used for the experiment utilized SSQ (Simulator Sickness Questionnaire), which was researched and published by Robert S. Kennedy and Norman E. Lane in 1993. This is a questionnaire for measuring Simulator Motion Sickness and commonly used when measuring VR Sickness [37].
SSQ is a questionnaire consisting of 16 symptoms by factor analysis of survey data collected through 10 simulator experiments. By calculating the weights according to the degree of the 16 symptoms collected, three significant symptom scores of nausea, oculomotor and disorientation and a comprehensive SSQ score can be calculated. Table 2 shows the SSQ score calculation method and items. If the total score falls within the range of 19–55, which is the general symptom range, the subject is considered to have a motion sickness [38]. In this paper, the researcher used the questionnaire as a basis for whether VR sickness occurred with the subject.
4 Empirical Analysis
4.1 Description of the Data
This study was conducted with 25 adult participants (13 males and 12 females), and the ages were evenly distributed from the 20s to 50s. The subject’s biometric data (EEG, PPG) were averaged first by each clinician’s cycle data and then re-averaged the mean value of each cycle. The average standard deviation values of all patients were shown in Table 3.
Survey data was based on SSQ Total Score. The average value of the data was calculated in the same way as the biometric data. If the total score falls within the range of 19 to 55, the general symptoms of motion sickness, the subject was considered to have motion sickness. The questionnaire was divided into two groups according to the presence of motion sickness. Group1 is a group that didn’t have motion sickness, and Group2 is a motion sickness group. Table 4 shows the difference in the mean of the bio-signal data for each group.
In the case of Group 1 who did not feel motion sickness, the average values of Beta and Gamma were relatively higher than those of Group 2. Group 2 responded that they felt motion sickness had relatively high average values of Alpha, Theta, Delta, and PPG comparing to those of Group 1. According to previous studies, Beta and Gamma are measured significantly in the state of high arousal, i.e. concentration. Based on this, the difference between Group 1 and Group 2 was assumed to be whether the general subject’s condition was psychologically highly concentrated.
Table 3 Descriptive statistics
| Variables | Mean | Std. Deviation | Skewness | Kurtosis |
| Delta | 2.96 | 2.64 | 0.26 | 0.94 |
| Theta | 6.20 | 2.46 | 0.21 | 1.10 |
| Alpha | 5.92 | 2.06 | 0.15 | 1.41 |
| Beta | 4.91 | 1.59 | 0.41 | 1.02 |
| Gamma | 4.23 | 1.24 | 0.64 | 0.46 |
| PPG | 85.24 | 6.30 | 0.27 | 1.92 |
Table 4 Difference of Means for group 1 and group 2
| Variables | Group 1 (No Sick) | Group 2 (Feel Sick) | Diff. | t-stat (Diff.) |
| Delta | 3.13 | 2.53 | 0.60 | 2.26 |
| Theta | 6.09 | 6.50 | 0.41 | 2.27 |
| Alpha | 5.86 | 6.06 | 0.20 | 2.23 |
| Beta | 4.99 | 4.68 | 0.31 | 2.11 |
| Gamma | 4.31 | 4.02 | 0.30 | 2.07 |
| PPG | 84.97 | 85.92 | 0.95 | 2.13 |
| Note: Group 1 did not experience VR sickness. Group 2 experienced VR sickness. | ||||
Table 5 Results based on principal component analysis
| Variables | PC1 | PC2 | PC3 | PC4 | PC5 | PC6 |
| Delta | 0.45 | 0.13 | 0.44 | 0.45 | 0.05 | 0.62 |
| Theta | 0.45 | 0.13 | 0.35 | 0.14 | 0.32 | 0.73 |
| Alpha | 0.46 | 0.05 | 0.18 | 0.53 | 0.69 | 0.03 |
| Beta | 0.45 | 0.10 | 0.34 | 0.51 | 0.59 | 0.26 |
| Gamma | 0.43 | 0.20 | 0.67 | 0.49 | 0.28 | 0.13 |
| PPG | 0.01 | 0.96 | 0.29 | 0.00 | 0.01 | 0.01 |
| Std. Deviation | 2.17 | 1.04 | 0.46 | 0.10 | 0.06 | 0.04 |
| % Variance | 0.78 | 0.18 | 0.04 | 0.00 | 0.00 | 0.00 |
| Cum. % of Variance | 0.78 | 0.96 | 1.00 | 1.00 | 1.00 | 1.00 |

Figure 8 Biplot for individual observed value.
4.2 Description of the Data
The results of the major component analysis for the biometric data of each subject are shown in Table 5. The cumulative explanatory power of the extracted main components PC1 and PC2 was 96%, and it was judged that the two major components could explain the most variance. Analysis of each major component shows that Delta, Theta, Alpha, Beta, and Gamma values of PC1 are negative and related to each other. Therefore, PC1 can be interpreted as a component that distinguishes EEG from PPG.
PC2 is related to Delta, Theta, Alpha, Beta, and Gamma. Since Beta and Gamma can be interpreted as being related to concentration, PC2 is interpreted as a component that distinguishes the presence or absence of concentration.
When looking at the Biplot for the individual observations of PC1 and PC2, the values in red circles mean Group 2 that caused the motion sickness identified by the questionnaire, and other values refer to Group 1 that had no motion sickness. The distribution of each group shows that the majority of Group 2 is related to Delta, Theta, and Alpha below the major component, PC2 that the VR Sickness and relaxation state are correlated. Therefore, the three quadrants to which the brainwave of PC1 and the relaxed state of PC2 are directed as a result of PCA can be interpreted as a cluster causing VR Sickness.
Table 6 Cross tabulated summary and independence test
| Sickness | No Sick | Feel Sick | Total |
| No Sick | 12 (48.0%) | 6 (24.0%) | 18 (72.0%) |
| Feel Sick | 1 (4.0%) | 6 (24.0%) | 7 (28.0%) |
| Total | 13 (52.0%) | 12 (48.0%) | 25 (100.0%) |
| Independence Test: ; p-value 0.02. | |||
The chi-square independence test was performed as shown in Table 6 to identify the difference between the distribution of motion sickness observations of PCA in the distribution of groups 1 and 2, which showed motion sickness in the SSQ questionnaire. As a result, there was a significant difference between the distribution of motion sickness group and the distribution of PCA motion sickness observed in the SSQ questionnaire with , .
Twelve of 18 patients with no symptoms of motion sickness in PCA showed no motion sickness. Six of seven subjects with motion sickness in the PCA actually had motion sickness. Therefore, it was confirmed that there is a correlation between relaxation state and VR Sickness analyzed by the major component analysis.
5 Conclusion
In this paper, it was confirmed that there is a correlation between VR user’s normal state and VR Sickness through PCA and chi-square independence test based on biometric data and questionnaire data obtained through the VR sickness experiment. PC1 and PC2 extracted by the Major Component Analysis indicated the presence or absence of brainwave and concentration state, and the users with high concentration, who showed high values of Beta and Gamma had a relatively less VR sickness than those who had relatively high values of Alpha, Delta, and Theta. Independence test was cross-analyzed with the existing questionnaire results, and it was confirmed that a significant result could be obtained as a bio-signal in the presence or absence of actual motion sickness.
VR sickness measurement method using the existing questionnaire only has a problem that it is difficult to determine the exact number, and various errors may occur. The results presented in this study show that VR Sickness can be effectively measured when used with the existing questionnaire for measuring VR Sickness with bio-signals.
In future studies, it is necessary to conduct clinical research on more diverse contents and a large number of subjects to enhance the reliability of this study, and the correlation between each brain wave and VR Sickness shall be established.
Acknowledgments
This work was supported by the GRRC program of Gyeonggi province. [GRRC-Gachon2020(B03), Development of AI-based Healthcare Contents]
References
[1] Young-Hwan Kang, “A Study on The Application of VR Technology for The Contents of Petroglyph Museum”, The Journal of the Korea Contents Association, Vol. 16, No. 10, pp. 443–453, Oct 2016.
[2] R. T. Llamas, “Worldwide Augmented and Virtual Reality Hardware Forecast 2018–2022”, IDC, accessed Jan 2018.
[3] Orlosky, Jason, Kiyoshi Kiyokawa, Haruo Takemura. “Virtual and augmented reality on the 5G highway,” Journal of Information Processing, Vol. 25, No. 18, pp. 133–141, Feb 2017.
[4] van Dreunen, J., Llamas, S., and Sanmiguel, C., NOWHERE TO GO BUT UP: THE FUTURE OF XR (Virtual Reality, Mixed Reality, Augmented Reality), SuperData Research, New York, 2018.
[5] H.-J. Kwon, J.-H. Sung, “A Study on the Problem and Improvement of VR Content Using Motion Platform and VR HMD,” Journal of Korea Game Society, vol. 19, no. 3, pp. 15–24, Jun. 2019.
[6] ETRI, KoVRA, Best practices for VRAR use and applications, Korea VR AR Industry Association, Seoul, 2018.
[7] Treleaven, J., Battershill, J., Cole, D., Fadelli, C., Freestone, S., Lang, K., & Sarig-Bahat, H, “Simulator sickness incidence and susceptibility during neck motion-controlled virtual reality tasks”, Virtual Reality, vol. 19, no. 3–4, pp. 267–275, Nov 2015.
[8] L. Gerard, E. Alun and B. Josep, “Simulator sickness and presence using HMDs: Comparing use of a game controller and a position estimation system,” Proc. ACM Symposium on Virtual Reality Software and Technology, pp. 137–140, Nov 2014.
[9] Muth, E., Keshavarz, B., Smart Jr, L. J., So, R., and Beadle, S, “Discussion Panel: Motion Sickness in Virtual Environments”, Proc. the Human Factors and Ergonomics Society Annual Meeting, vol. 62, no. 1, pp. 2043–2046, Sep 2018.
[10] Cha, Young Ran, “VR Contents Strategy for Advertising and PR Industries: Focused on In-depth Interviews,” The Korea Contents Association, Vol. 17, No. 9, pp.107–119, Sep 2017.
[11] A. S. Fernandes and S. K. Feiner, “Combating vr sickness through subtle dynamic field-of-view modification,” IEEE Symposium on 3D User Interfaces, pp. 19–23 Mar. 2016.
[12] A. S. Fernandes, S. K. Feiner, “Combating vr sickness through subtle dynamic field-of-view modification,” Proc. 2016 IEEE Symposium on 3D User Interfaces (3DUI), Greenville, pp. 201–210, Mar 2016.
[13] S.-R. Park, H.-M. Shim, W.-H. Lee, “Gameability Test Using Brain Wave Signal,” Journal of The Korean Society for Computer Game, vol. 25, no. 3, pp. 223–228 Sep. 2012.
[14] J.-Y. Lee, H.-B. Kang, “EEG and ERP based Degree of Internet Game Addiction Analysis,” Journal of Korea Multimedia Society, vol. 17, no. 11 pp. 1325–1334 Nov. 2014.
[15] T.-H. Hwang, J.-H. Kim, “Development of Emotion Analysis Platform for Quantitative Evaluation of VR Media Content”, Journal of Digital Content Society, vol. 19, no. 11, pp. 1187–1198 Oct. 2018.
[16] Oh, Seok Hee, Taeg Keun Whangbo, “Study on relieving VR contents user’s fatigue degree using aroma by measuring EEG,” Proc. 2018 International Conference on Information and Communication Technology Convergence (ICTC), Jeju, South Korea, pp. 568–570, Oct 2018.
[17] LaViola Jr, J. J, “A discussion of cybersickness in virtual environments,” ACM SIGCHI Bulletin, vol. 32, no. 1, pp. 47–56, Jan 2000.
[18] D. E. Parker. “Motion Sickness”. The Ameraican Journal of Phsychology. Vol. 90, No. 1, pp. 192–188, 1977.
[19] Koasinski, E.M. , simulator Sickness in Virtual Environments, Army research Inst for the behavioral and social sciences. Alexandria VA. 1995.
[20] H.-J. Kim, J.-H. Lee, J.-Y. Oh, H.-J. Lee, J.-H. Park, “Simulator sickness in differences between HMD display distance and IPD,” Proc. The HCI Society of Korea, pp. 253–256, Jan 2018.
[21] Poorna, S. S., Arsha, V. V., Aparna, P. T. A., Gopal, P., & Nair, G. J., “Drowsiness Detection for Safe Driving Using PCA EEG Signals,” Progress in Computing, Analytics and Networking, pp. 419–428, Apr 2018.
[22] Schmorrow, D. D., and Fidopiastis, C. M. ed., Foundations of Augmented Cognition, Springer Science+Business Media, Berlin, 2005.
[23] Lin, C.-T., Chuang, S.-W., Chen, Y.-C., Ko, L.-W., Liang, S.-F., Jung, T.-P., “EEG Effects of Motion Sickness Induced in a Dynamic Virtual Reality Environment” Proc.29th Annual International Conference of the IEEE Engineering in Medicine and Biology Society., Lyon, The France, no.FrD02.4, pp. 3872–3875, Aug. 2007.
[24] S.-H. Seo, J.-T. Lee, ed, “Stress and EEG,” in Stress and EEG, Convergence and Hybrid Information Technologies, ed. Marius Crisan, pp. 413–423, Intech. Croatia. 2010.
[25] Barry, R. J., De Blasio, F. M., “EEG frequency PCA in EEG-ERP dynamics,” Psychophysiology, 55(5), e13042., pp. 1–12, Dec 2017.
[26] D.-Y. Kim, J.-H. Lee, M.-H. Park, Y.-H. Chou, and Y-.O. Park, “Trends in brain wave signal and application technology”, Electronics and Telecommunications Trends, vol. 32, no. 2, pp. 19–28, Apr.2017.
[27] K. Blinowska, P. Durka, “Electroencephalography (EEG)” in Wiley Encyclopedia of Biomedical Engineering, NJ, Hoboken:Wiley, Apr 2006.
[28] Shelley, K. H., “Photoplethysmography: beyond the calculation of arterial oxygen saturation and heart rate,” Anesthesia & Analgesia, Vol. 105, No. 6, S31–S36, Dec 2007.
[29] Alian, Aymen A., Kirk H. Shelley. “Photoplethysmography,” Best Practice & Research Clinical Anaesthesiology vol.28, no.4, pp. 395–406, Dec 2014.
[30] M.-h. Kim, M.-C., Park, “Detection of Motion Artifact in PPG Signal using Convolutional Neural Network,” Journal of Digital Contents Society. vol. 20, no. 2, pp. 335–361, Feb 2019.
[31] D.-G. Oh, B.-S. Min, S.-O. Kwon, and H.-J. Kim, “Effective PPG Signal Processing Method for Detecting Emotional Stimulus,” The Journal of Korean Institute of Communications and Information Sciences, vol. 37, no. 5C, pp. 393–402, May 2012.
[32] J.-Y. Park, C.-J. Lee, “Principal Component Analysis Based Method for a Fault Diagnosis Model DAMADICS Process,” Journal of the Korean Society of Safety, vol. 32, no. 41, pp. 35–41, Aug 2016.
[33] S.-Y. Kim, ed., “chi-squared test,” in Fundamentals of statistics, ed. S.-Y. Kim, pp. 212–216, Hak-Ji-Sa, Seoul, 2007.
[34] Jolliffe, I., ed., Principal component analysis, Springer-Verlag, Berlin, 2011.
[35] McHugh, M. L, “The chi-square test of independence”, Biochemia medica: Biochemia medica, Vol. 23, No. 2, pp. 143–149, Apr 2013.
[36] Bradley, D. R., and Cutcomb, S., “Monte Carlo simulations and the chi-square test of independence”, Behavior Research Methods & Instrumentation, Vol. 9, No. 2, pp. 193–201, Mar 1977.
[37] Robert S. Kennedy, Norman E. Lane, Kevin S. Berbaum and Michael G. Lilienthal, “Simulator sickness questionnaire: An enhanced method for quantifying simulator sickness,” The international journal of aviation psychology, Vol. 3, No. 3, pp. 203–220, Nov 2009.
[38] Apperley, Thomas H. “Genre and game studies: Toward a critical approach to video game genres,” Simulation & Gaming, Vol. 37, No. 1, pp. 6–23, Mar 2006.
Biographies

Gi-Sung Oh received his Master in Game Engineering from College of IT Convergence Engineering of Gachon University in 2020. He is currently a graduate student in the IT Convergence Engineering at Gachon University, Republic of Korea. His research interests include VR sickness, Bio-signal data analysis, Game design and evaluation methods of VR Contents.
Won-Jun Jeong received his Master in Game Engineering from College of IT Convergence Engineering of Gachon University in 2020. He is currently a graduate student in the IT Convergence Engineering at Gachon University, Republic of Korea. His research interests include VR sickness, evaluation methods of VR Contents and Bio-signal data analysis.

Sung-Jin Cho received the Master and Ph.D., M.D. degree in Medicine from College of Medicine of Seoul National University in 2000 and 2004, respectively. He has been working in department of psychatry, College of Medicine, Gachon University since 2000.

Seok-Hee Oh received the Ph.D., degree in Computer Engineering from College of IT Convergence Engineering of Gachon University in 2016, respectively. He has been working in department of Computer Engineering, College of IT, Gachon University since 2016.
Journal of Web Engineering, Vol. 21_5, 1651–1670.
doi: 10.13052/jwe1540-9589.21511
© 2022 River Publishers