GAIN-QoS: A Novel QoS Prediction Model for Edge Computing
Jiwon Choi1, Jaewook Lee1, Duksan Ryu1,*, Suntae Kim1 and Jongmoon Baik2
1Department of Software Engineering, Jeonbuk National University, Korea
2School of Computing, Korea Advanced Institute of Science and Technology, Korea
E-mail: jiwon.choi@jbnu.ac.kr; aewexpress01@jbnu.ac.kr; duksan.ryu@jbnu.ac.kr; stkim@jbnu.ac.kr; jbaik@kaist.ac.kr
Corresponding Author
Received 31 August 2021; Accepted 04 October 2021; Publication 23 November 2021
Abstract
With recent increases in the number of network-connected devices, the number of edge computing services that provide similar functions has increased. Therefore, it is important to recommend an optimal edge computing service, based on quality-of-service (QoS). However, in the real world, there is a cold-start problem in QoS data: highly sparse invocation. Therefore, it is difficult to recommend a suitable service to the user. Deep learning techniques were applied to address this problem, or context information was used to extract deep features between users and services. However, edge computing environment has not been considered in previous studies. Our goal is to predict the QoS values in real edge computing environments with improved accuracy. To this end, we propose a GAIN-QoS technique. It clusters services based on their location information, calculates the distance between services and users in each cluster, and brings the QoS values of users within a certain distance. We apply a Generative Adversarial Imputation Nets (GAIN) model and perform QoS prediction based on this reconstructed user service invocation matrix. When the density is low, GAIN-QoS shows superior performance to other techniques. In addition, the distance between the service and user slightly affects performance. Thus, compared to other methods, the proposed method can significantly improve the accuracy of QoS prediction for edge computing, which suffers from cold-start problem.
Keywords: Edge computing, Service recommendation, QoS prediction, Cold-start problem.
1 Introduction
Edge computing provides cloud services by connecting users and nearby edge networks [1]. The main characteristic of edge computing is that it significantly reduces latency; therefore, the response time is fast, and network information can be accessed in real-time [2].
As the edge computing market grows, many service providers are offering various services with identical or similar functions. Therefore, when users pass through the edges of different networks, the most suitable service needs to be selected from many similar services. One of the main selection criteria is quality-of-service (QoS) [3]. QoS is defined as a set of quality properties that affect service quality and includes properties such as response time, accessibility, and throughput [4].
QoS allows users to distinguish the degree of quality between different suitable services. In reality, it is difficult to obtain the QoS values of all service candidates. Because not all users use all services, there are almost inevitably missing QoS values; this is referred to as a cold-start problem, and as presented in Table 1. The values filled in the table indicate the response time, and the ‘’ indicates a missing response time for the services. If QoS values are missing, the corresponding user-service pairs cannot be used for service recommendations. Therefore, it is necessary to predict the missing QoS values for optimal service recommendations for the user.
Various methods have been proposed to predict QoS. QoS prediction methods are grouped into Collaborative Filtering (CF) and content-based methods [5]. CF shows the best performance and is widely used. There are two CF categories: neighborhood-based CF and model-based CF. Neighborhood-based CF predicts missing QoS values using similar users or similar services in the neighborhood. Wang et al. [6] predicted QoS values by applying neighborhood-based CF after combining Web service QoS data and the Shanghai telecom dataset.
Model-based CF learns latent features via the inner product of the user latent vector and service latent vector in service invocation: the QoS value is then predicted using this. A representative method is Matrix Factorization (MF). It has been demonstrated that MF outperforms the neighborhood-based CF method [7–9]. However, MF has a limitation in that it is challenging to learn deep features by only learning the linear relationship between users and services [7, 10]. Yin et al. [11] presented an approach for performing MF first and then applying autoencoder to learn deep features. Yin et al. [12] applied a Convolutional Neural Network (CNN) to learn deep features and learned deep features.
In the edge computing QoS prediction studies, the real environment of edge computing has not been considered. Because there are no public QoS data in edge computing, the WSDream [13] dataset is used in the edge computing QoS research.
Table 1 Example of user service invocation matrix
| Service1 | Service2 | Service3 | Service4 | Service5 | |
| User1 | 0.32 | 0.17 | |||
| User2 | 0.71 | 0.2 | |||
| User3 | 0.12 | 0.23 | |||
| User4 | 1.56 | 0.45 | |||
| User5 | 0.9 |
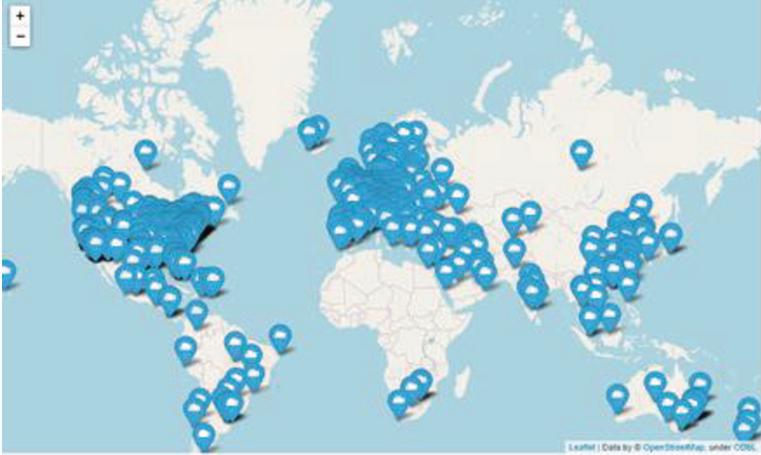
Figure 1 Service location information of Web service QoS data.
Figure 1 shows the service locations of the WSDream dataset. The services are spread across the world, indicating that the environment of edge computing should be considered when using this dataset for edge computing QoS prediction studies. Yin et al. [11] emphasized that 91% of the WSDream data had a response time of less than 2s. However, it is difficult to say that the response time of less than 2 seconds reflects the edge computing environment.
We propose a novel method referred to as GAIN-QoS to build a real edge computing environment and improve the QoS prediction performance in this environment to address these problems. In this study, the edge computing environment is premised on the fact that the edge server must be adjacent to the user based on the geographical distance. Therefore, we first cluster services in adjacent locations to build an edge computing environment. Then, by calculating the distance between the service of each cluster and the users who called the service, the QoS values of users within the adjacent distance, i.e., 0.3 km, 0.5 km, 1 km, 2 km, 5 km, 10 km, 20 km, 50 km and 100 km are obtained. As a result, a user service invocation matrix that reflects the environment of edge computing is created for each cluster.
To perform QoS prediction, we apply Generative Adversarial Imputation Nets (GAIN) [14], which addresses missing values among deep learning models. The GAIN can generate both numerical and categorical data. It is superior to other techniques when the ratio of missing values is high, and the amount of data is small [15]. Considering that QoS data are sparse, i.e., there is a cold-start problem [4], it is a suitable model for QoS research. We train the GAIN model using the reconstructed user service invocation matrix and predict the missing QoS values. Consequently, our method outperform related methods at lower density.
The contributions of this paper are as follows.
• To the best of our knowledge, this is the first study that considers both the edge computing environment and the cold-start problem in predicting the edge computing QoS. The main characteristic of the edge computing environment is the close distance between the user and the edge server. First, we cluster the services based on the location information of the service. Subsequently, the QoS information of the user who invoked the corresponding service is obtained, and a user service invocation matrix is created for each cluster.
• We investigated whether the GAIN model can be successfully applied in an edge computing QoS study. So far, there has been no case of applying the GAIN model to edge computing QoS prediction studies. The GAIN model is a deep learning model that generates high-quality numerical data even when the missing rate is high and the data are small. Considering that QoS data are sparse, we experimentally confirm whether GAIN is suitable for edge computing QoS prediction.
• To verify the performance of GAIN-QoS, we compared it with recent related techniques in QoS studies.
• We use real-world datasets to demonstrate that our technique has superior performance.
The remainder of this paper is organized as follows. In Section 2, we present the related work, and Section 3 introduces the proposed GAIN-QoS. Section 4 describes our experimental setting, and Section 5 presents the experimental results and analysis. Section 6 discusses in detail, and Section 7 describes the threats to the validity of our study. Finally, in Section 8, we conclude the paper and discuss future work.
2 Related Work
In this section, we mainly introduce related work on QoS prediction. The primary assumption of CF is that users A and B show similar QoS in other services if they have similar historical QoS data (e.g., throughput and response time) [16]. CF can be grouped into neighborhood-based CFs and model-based CF.
The neighborhood-based CF calculates the similarity of a user or service and uses similar user or service values to predict the missing QoS value. Shao et al. [17] proposed a user-based CF that utilizes a user QoS data to predict the QoS value. However, these neighborhood-based CF underperform in sparse data [18]. A key feature of QoS data is that the user service invocation matrix is very sparse because the user tends to use only a few services.
Model-based CF provides a solution to the cold-start problem of neighborhood-based CF, which is challenging with highly sparse data. Previous studies have shown that model-based CF performance is superior to that of neighborhood-based CF [7–9]. Model-based CF uses models, such as clustering [19], MF, and machine learning techniques. MF is known for outperforming in QoS prediction. Yang et al. [20] proposed a location-based MF technique that uses the context information of users and services as well as the QoS information of users and services. Chen et al. [21] combined the knowledge of geographical neighbors with MF to solve the cold start problem. They indicated that users and web services had a positive correlation with geographic neighbors. Ryu et al. [8] proposed a location-based matrix factorization using a preference propagation method (LMF-PP) to address the cold-start problem.
Furthermore, several researchers have recently constructed QoS prediction models for edge computing. Yin et al. [11] combined an autoencoder with MF to learn a nonlinear representation of users and services to alleviate the cold-start problem. They highlighted that autoencoder has difficulty in learning local features, which can be addressed by taking advantage of the ability of local features learning in neighborhood-based CF. Yin et al. [12] proposed a new MF model with deep features learning, which incorporates a CNN. Yin et al. [5] pointed out that there have been few attempts to build a neural network in edge computing QoS prediction studies, and the model can suffer from overfitting if the sparsity of the data is high. They proposed a denoising autoencoder with a fuzzy clustering (DAFC) technique that uses contextual information to solve overfitting problems. DAFC has shown that it outperforms other methods at various training set densities and can solve the overfitting problem. Wang et al. [6] proposed a service recommendation approach based on collaborative filtering and mixed QoS data, and edge server data to represent user mobility.
Although web service data and edge computing data are different, many existing service recommendation approaches for edge computing validate the feasibility and effectiveness of various QoS methods with web service data. A difference between edge computing and web services is the physical location of users and services. In edge computing, users and servers are located nearby. Because there is no edge computing QoS data, we cluster services based on the location information and reconstruct the user service invocation matrix from web service data based on distance.
In this study, we propose a method to solve the cold-start problem in a real edge computing environment.
3 Our Approach: GAIN-QoS
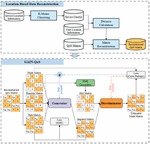
In this section, we describe how we build edge computing data and predict QoS using GAIN. Our approach mainly consists of two parts, that is, location-based data reconstruction and GAIN-QoS, as shown in Figure 2. The location-based data reconstruction part reflects the environment of edge computing and the result of this step is the reconstructed QoS matrix. However, this reconstructed QoS matrix still has a cold-start problem. Therefore, the GAIN-QoS solves the cold-start problem. We describe our approach in detail in sub-sections 3.1 and 3.2.
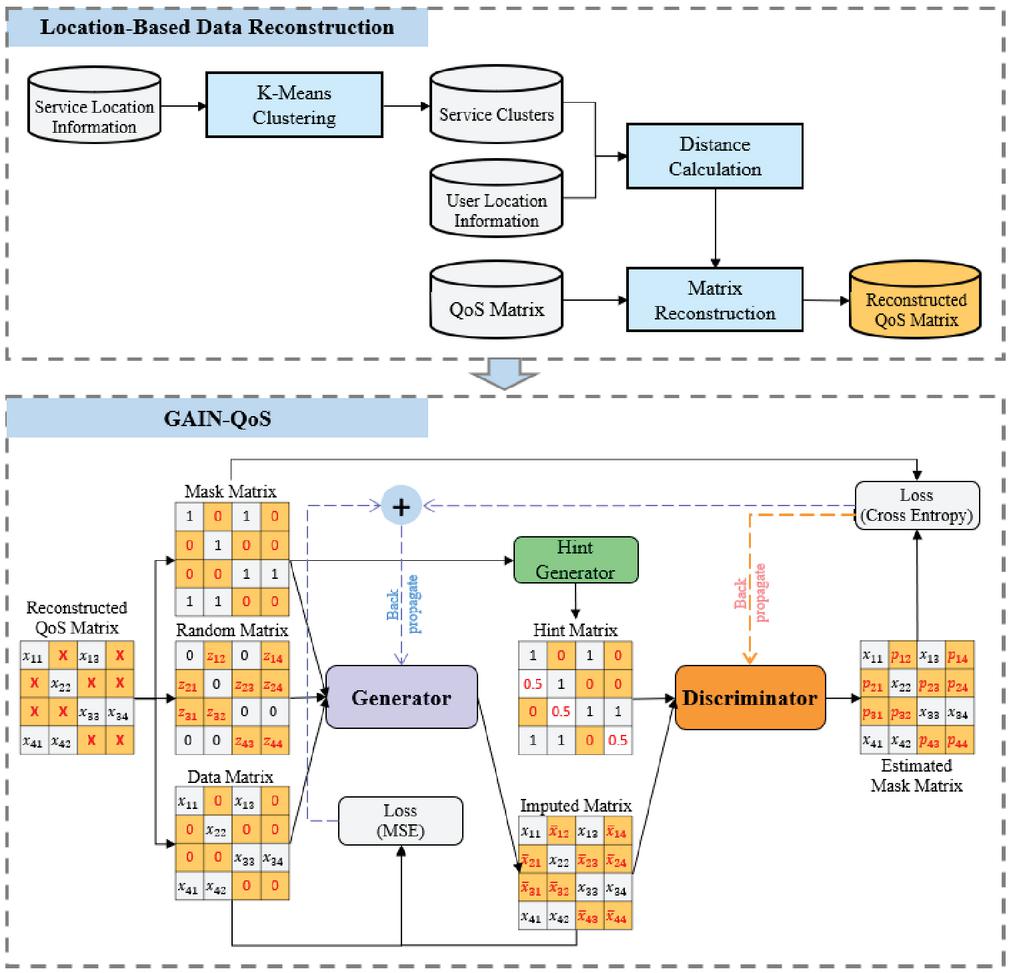
Figure 2 Proposed overall prediction architecture.
Algorithm 1 Pseudo-code of location-based reconstruction
1:
2: QoS data
3: Service Location Set
4: User Location Set
5: The number of clusters
6: Reconstructed QoS Matrix
7: (1) k-means clustering with service location
8: initialize centroid of each cluster
9: while no change do
10: for do
11:
12: end for
13: for do
14:
15: end for
16: end while
17: (2) user service invocation matrix reconstruction
18: for do
19: for do
20:
21: for do
22:
23: end for
24: end for
25:
26: end for
3.1 Location-based Data Reconstruction
We propose location-based data reconstruction to create an edge computing environment. It is divided into two steps k-means clustering with service location and user service invocation matrix reconstruction. The pseudocode is presented in Algorithm 1.
In the first step, the services are clustered using the location information of the services (line 1). The clustering algorithm provides a method for searching for hidden patterns in data by classifying data through similarity calculations [22]. In particular, k-means clustering has proven to be effective in producing good clustering results [23, 24]. In the proposed approach, the k-means clustering algorithm is used to group services in adjacent locations; i.e., the web service QoS data is divided into k sets of services through k-means clustering for reconstruction to suit the edge computing environment (lines 2–10). The objective functions of the k-means clustering are as follows.
| (1) | ||
where k is the number of clusters, n is the number of services, and is a function that calculates the distance between the i-th sample and j-th centroid point of the cluster (lines 4–6). The distance function calculates the haversine distance, i.e., the distance between two points on the surface of a sphere. In the formula, la represents latitude, and lo represents longitude. Then, we update the centroid with the average of services belonging to each cluster (lines 7–9).
The number of clusters, k, was set to 30 (the reason for this is explained in the Discussion). When services are grouped into 30 clusters, one cluster includes at least 9 services, and 29 clusters include 10 or more services.
Table 2 Number of users and services by distance
| Distance (km) | |||||||||
| 0.3 | 0.5 | 1 | 2 | 5 | 10 | 20 | 50 | 100 | |
| User | 11 | 11 | 14 | 18 | 27 | 33 | 35 | 41 | 49 |
| Service | 647 | ||||||||
In the second step, we reconstruct the user service invocation matrix. To do this, we get the services belonging to each cluster (line 14). Then, we calculate the distance between the services in each cluster and the user and obtain the QoS value of the user within a certain distance, that is, 0.3 km, 0.5 km, 1 km, 2 km, 5 km, 10 km, 20 km, 50 km and 100 km (lines 15–16). The formula for calculating the distance between the service and user is as shown in (2). The WSDream dataset contains the user latitude and longitude information. Subsequently, it creates a user service invocation matrix for each cluster (line 19). For example, the 0th cluster has 614 services. It can filter 614 services and users within 0.5 km and to obtain IDs of filtered users. Accordingly, we can obtain the QoS value of the user who uses the service and creates a user service invocation metric. This matrix reflects the edge computing environment. Table 2 presents the number of services and users included in the third cluster; the number of users increases with distance. However, in some clusters, the number of users is the same, regardless of distance.
3.2 GAIN-QoS
GAIN-QoS is the step for solving the cold-start problem and uses the GAIN model to fill in the missing QoS values. GAIN [14] is proposed to solve the missing values of tabular data while generating categorical and numerical data and adopting the vanilla-GAN architecture [25].
Algorithm 2 Pseudo-code of GAIN
1:
2: Input data
3: Missing data
4: Mask matrix M
5: Random noise Z
6: Hint matrix H
7: : hyper-parameter of loss function
8: : mini-batch size
9: Estimated mask matrix
10: while training loss has not converged do
11: Draw samples from the data , of (, M)
12: Draw i.i.d. samples, , of Z
13: Draw i.i.d. samples, , of H
14: (1) Discriminator optimization
15: for do
16:
17:
18: end for
19: update D using Stochastic Gradient Descent (SGD)
20:
21: (2) Generator optimization
22: Update G using SGD (for fixed D)
23:
24: end while
Algorithm 2 is the pseudo-code of GAIN. Assuming that data X contains missing values, the Generator(G) of GAIN receives as inputs the data , Mask M, where the location of the missing value in X is indicated, and random noise (lines 2–4). is data whereby the missing value in X is replaced with 0 and is inserted with noise. Generated matrix is created through G (line 7). In the imputed matrix , the value of is filled in the missing value (M 0) in the data, and the corresponding value is filled in the same area as the original value (line 8). The Discriminator (D) receives some information with and M as inputs. Some information on M is expressed as a hint matrix, which serves as a guideline when D learns. The output of D is estimated mask matrix with cross-entropy loss applied. D aims to better distinguish the values of the original and imputed values (lines 10–11). In addition, G aims to generate the same imputed value as the original value, i.e., (the output of D) becomes 1 (lines 12–14). The loss of each network is expressed as follows.
| (3) | |
| (4) | |
| (5) |
Compared to other techniques, such as the Auto-Encoder [26], this model shows superior performance in terms of RMSE. In particular, the value generated by the GAIN model (imputed value) showed an experimental result that was consistent with the original value. In addition, it shows superior performance even when the missing value rate is high and the amount of data is relatively small [15, 27]. This means that the quality of the data generated through the GAIN model is excellent. Considering that QoS data are sparse in reality, the GAIN model is suitable for QoS prediction research.
Subsequently, we measured the performance by comparing the generated QoS value with the original QoS value. Finally, the Mean Absolute Error (MAE) and Root Mean Square Error (RMSE) indicators were used to check the prediction performance.
4 Experimental Setup
In this section, we focus on the research question, dataset, evaluation metrics, experimental setting, and performance comparison.
4.1 Research Question
To effectively evaluate our proposed method, we design the following three research questions:
RQ1. How well does GAIN-QoS predict QoS in the edge computing environment?
RQ2. Is there a difference in QoS prediction performance by distance?
RQ3. What factors affect the performance of the GAIN-QoS model in an edge computing environment?
4.2 Dataset
We used the WSDream [13] dataset to verify the QoS prediction performance of the proposed technique. The public WSDream dataset contains 339 users and 5,825 service information, with a total of 1,974,675 invocation records. These data have two QoS attributes, response time and throughput. Because response time data were used in previous studies, we conducted an experiment based on these data. In addition, this dataset includes latitude, longitude, ID, and country information of services and users; we used latitude, longitude, and ID information.
4.3 Evaluation Metrics
MAE and RMSE were used to evaluate performance. These two indicators are widely used to evaluate QoS performance [5, 6, 12]; a lower value of both indicators gives, better performance. The MAE and RMSE are defined as follows:
| (6) | |
| (7) |
where represents the predicted QoS value and is the actual observed value. N is the number of predicted values.
4.4 Experiment Setting
In reality, the user service invocation matrix is very sparse because a user will only call some of the many services. Therefore, we randomly selected some QoS values from the reconstructed matrix and used them as a training set to reflect this scenario. The remaining QoS values were used as a test set. When randomly selecting QoS values, we set the experiment such that at least one QoS value is included in at least one row and column of the matrix. This ensures that the compared QoS prediction models are not erroneous.
To establish a cold-start environment, our approach used four different density levels: 3%, 5%, 10%, and 20%. We calculated the average value 30 times for each density level.
In addition, we used a matrix in which the number of services is more than 10 and the number of users is more than 10 in the user service invocation matrix that reflects the edge computing environment in the experiment. This ensures that the QoS prediction models we compare do not cause errors, even when the density level is low.
4.5 Performance Comparison
We use the traditional technique and the latest edge computing QoS prediction technique for performance comparison.
1. UMEAN [27]: this method predicts the missing value using the average of the available QoS values based on the target user.
2. IMEAN [27]: this method predicts the missing value using the average of the available QoS values based on the target service.
3. UPCC (User Pearson Correlation Coefficient) [28]: this neighborhood-based CF method uses PCC coefficients to find users similar to the target user.
4. IPCC (Item Pearson Correlation Coefficient) [29]: this method is neighborhood-based CF and uses PCC coefficients to find services similar to the target service.
5. UIPCC [30]: this method is a hybrid method combining UPCC and IPCC and simultaneously considers similar users and services.
6. NMF (Non-negative Matrix Factorization) [31]: this method is a model-based CF method that predicts the QoS of a service through a non-negative factorized factor.
7. AE(Auto-Encoder) [32]: Smahi et al. [32] applied an autoencoder for web service QoS prediction. They showed that Auto-Encoder could reduce the overfitting problem that occurs when very sparse datasets are used.
8. DAFR [5]: Yin et al. [5] predicted QoS values by generating an embedding vector of location information and ID information, which are context information of users and services, using a denoising autoencoder and recombination embedding network. They showed that generating embedding vectors using context information at various data densities can effectively mitigate overfitting.
5 Experimental Result
In this section, we describe the experimental results for each RQ.
5.1 Answers to RQ 1
For this research question, we confirmed whether the proposed technique performs better than the other methods. To do this, we perform a performance comparison with the eight methods mentioned in Section 4.5.
Table 3 Accuracy comparison
| Density d% | ||||||||
| Method | MAE | RMSE | MAE | RMSE | MAE | RMSE | MAE | RMSE |
| UMEAN | 0.8118 | 1.6406 | 0.6990 | 1.5410 | 0.5548 | 1.3121 | 0.5120 | 1.2299 |
| IMEAN | 0.8318 | 2.0984 | 0.8004 | 1.9770 | 0.5301 | 1.4617 | 0.4579 | 1.2469 |
| UPCC | 0.6905 | 1.8052 | 0.7127 | 1.8376 | 0.5865 | 1.6549 | 0.4870 | 1.5284 |
| IPCC | 0.7090 | 1.8319 | 0.7377 | 1.8633 | 0.6231 | 1.6521 | 0.6962 | 1.7614 |
| UIPCC | 0.7072 | 1.8263 | 0.7276 | 1.8469 | 0.5832 | 1.5768 | 0.6215 | 1.6569 |
| NMF | 0.6152 | 1.5586 | 0.5804 | 1.5186 | 0.4279 | 1.2986 | 0.3638 | 1.1760 |
| AE | 0.5935 | 1.5433 | 0.5952 | 1.5336 | 0.6069 | 1.5318 | 0.6330 | 1.5375 |
| DAFR | 0.5736 | 1.5515 | 0.5314 | 1.5080 | 0.4857 | 1.4340 | 0.4309 | 1.3533 |
| GAIN-QoS | 0.5241 | 1.5096 | 0.5091 | 1.4877 | 0.4843 | 1.4474 | 0.4511 | 1.4262 |
Table 3 lists the results of comparing the performance of our approach with those of other QoS prediction methods. The performance presented in Table 3 is the average of all distances for each method; the best value of each indicator is marked in bold. In the table, d denotes the training data density. For example, means that only 3% of QoS values are filled in the user service invocation matrix, and the remaining 97% of the QoS values are predicted. The lower the training data density, the more practical it reflects the cold-start problem experienced by real QoS data. Therefore, we present the performance in cases where the densities are 3%, 5%, 10%, and 20% to show that our approach is practical.
Conversely, when the training data density was 10% and 20%, NMF shows the best performance in terms of MAE and RMSE. Our approach is the second-best performance in terms of MAE when the training data density is 10% and the third-best performance in MAE when the training data density is 20%. On the other hand, the RMSE performance of GAIN-QoS shows the fourth-best performance when the training data density is 10% and 20%. These experimental results indicate that when the density increases, the GAIN-QoS generates a different value from the original data.
The traditional methods UMEAN, IMEAN, UPCC, IPCC, and UIPCC have the best MAE and RMSE performance when the training data density is 20%. In particular, as the density increased from 3% to 5% in the PCC series, the performance decreased rather than improving. This indicates that the similarity calculation using PCC is not performed well because the amount of data is significantly small in our reconstructed user service invocation matrix. In addition, in the case of AE, the accuracy performance significantly decreased as the density increased.
In the user service invocation matrix we created to reflect the environment of edge computing, the number of services and users is already significantly less than the existing QoS data. Therefore, we tried to experiment when the training data density was lower than 3%, however, there was a problem in that the number of users was significantly reduced. Therefore, the sparsest case that can be performed in an edge environment we set is when the training data density is 3%. Table 4 presents the number of invocation records according to each density in the 21st cluster. GAIN-QoS showed the best performance when the density was 3%(193) and 5%(322) with a small number of invocation records compared to the case where the density was 10%(645) and 20%(1,291). These results indicate that GAIN-QoS is effective in the cold-start problem. The main characteristic of GAIN is that the quality of the imputed value is good when the density is low, and the amount of data is small. It can be confirmed through the experimental results of this research question that these characteristics can be well applied to edge computing QoS prediction research.
Table 4 Number of invocation records of the 21st cluster according to density
| Density d% | ||||
| Invocation record | 193 | 322 | 645 | 1,291 |
5.2 Answers to RQ 2
This question focuses on the difference in performance depending on the distance between the service and the user.
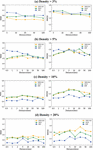
We divided the geographic distance between the service and the user according to a specific criterion, i.e., 0.3 km, 0.5 km, 1 km, 2 km, 5 km, 20 km, 50 km and 100 km; however, in the case of 0.3 km and 0.5 km, the number of users and QoS values are the same in all user service invocation matrices. Therefore, we report experimental results from 0.5 to 100 km in the experimental results. We compared the performance of the top-3 methods, which showed the best performance in RQ1 by distance; Figure 3 shows the results.
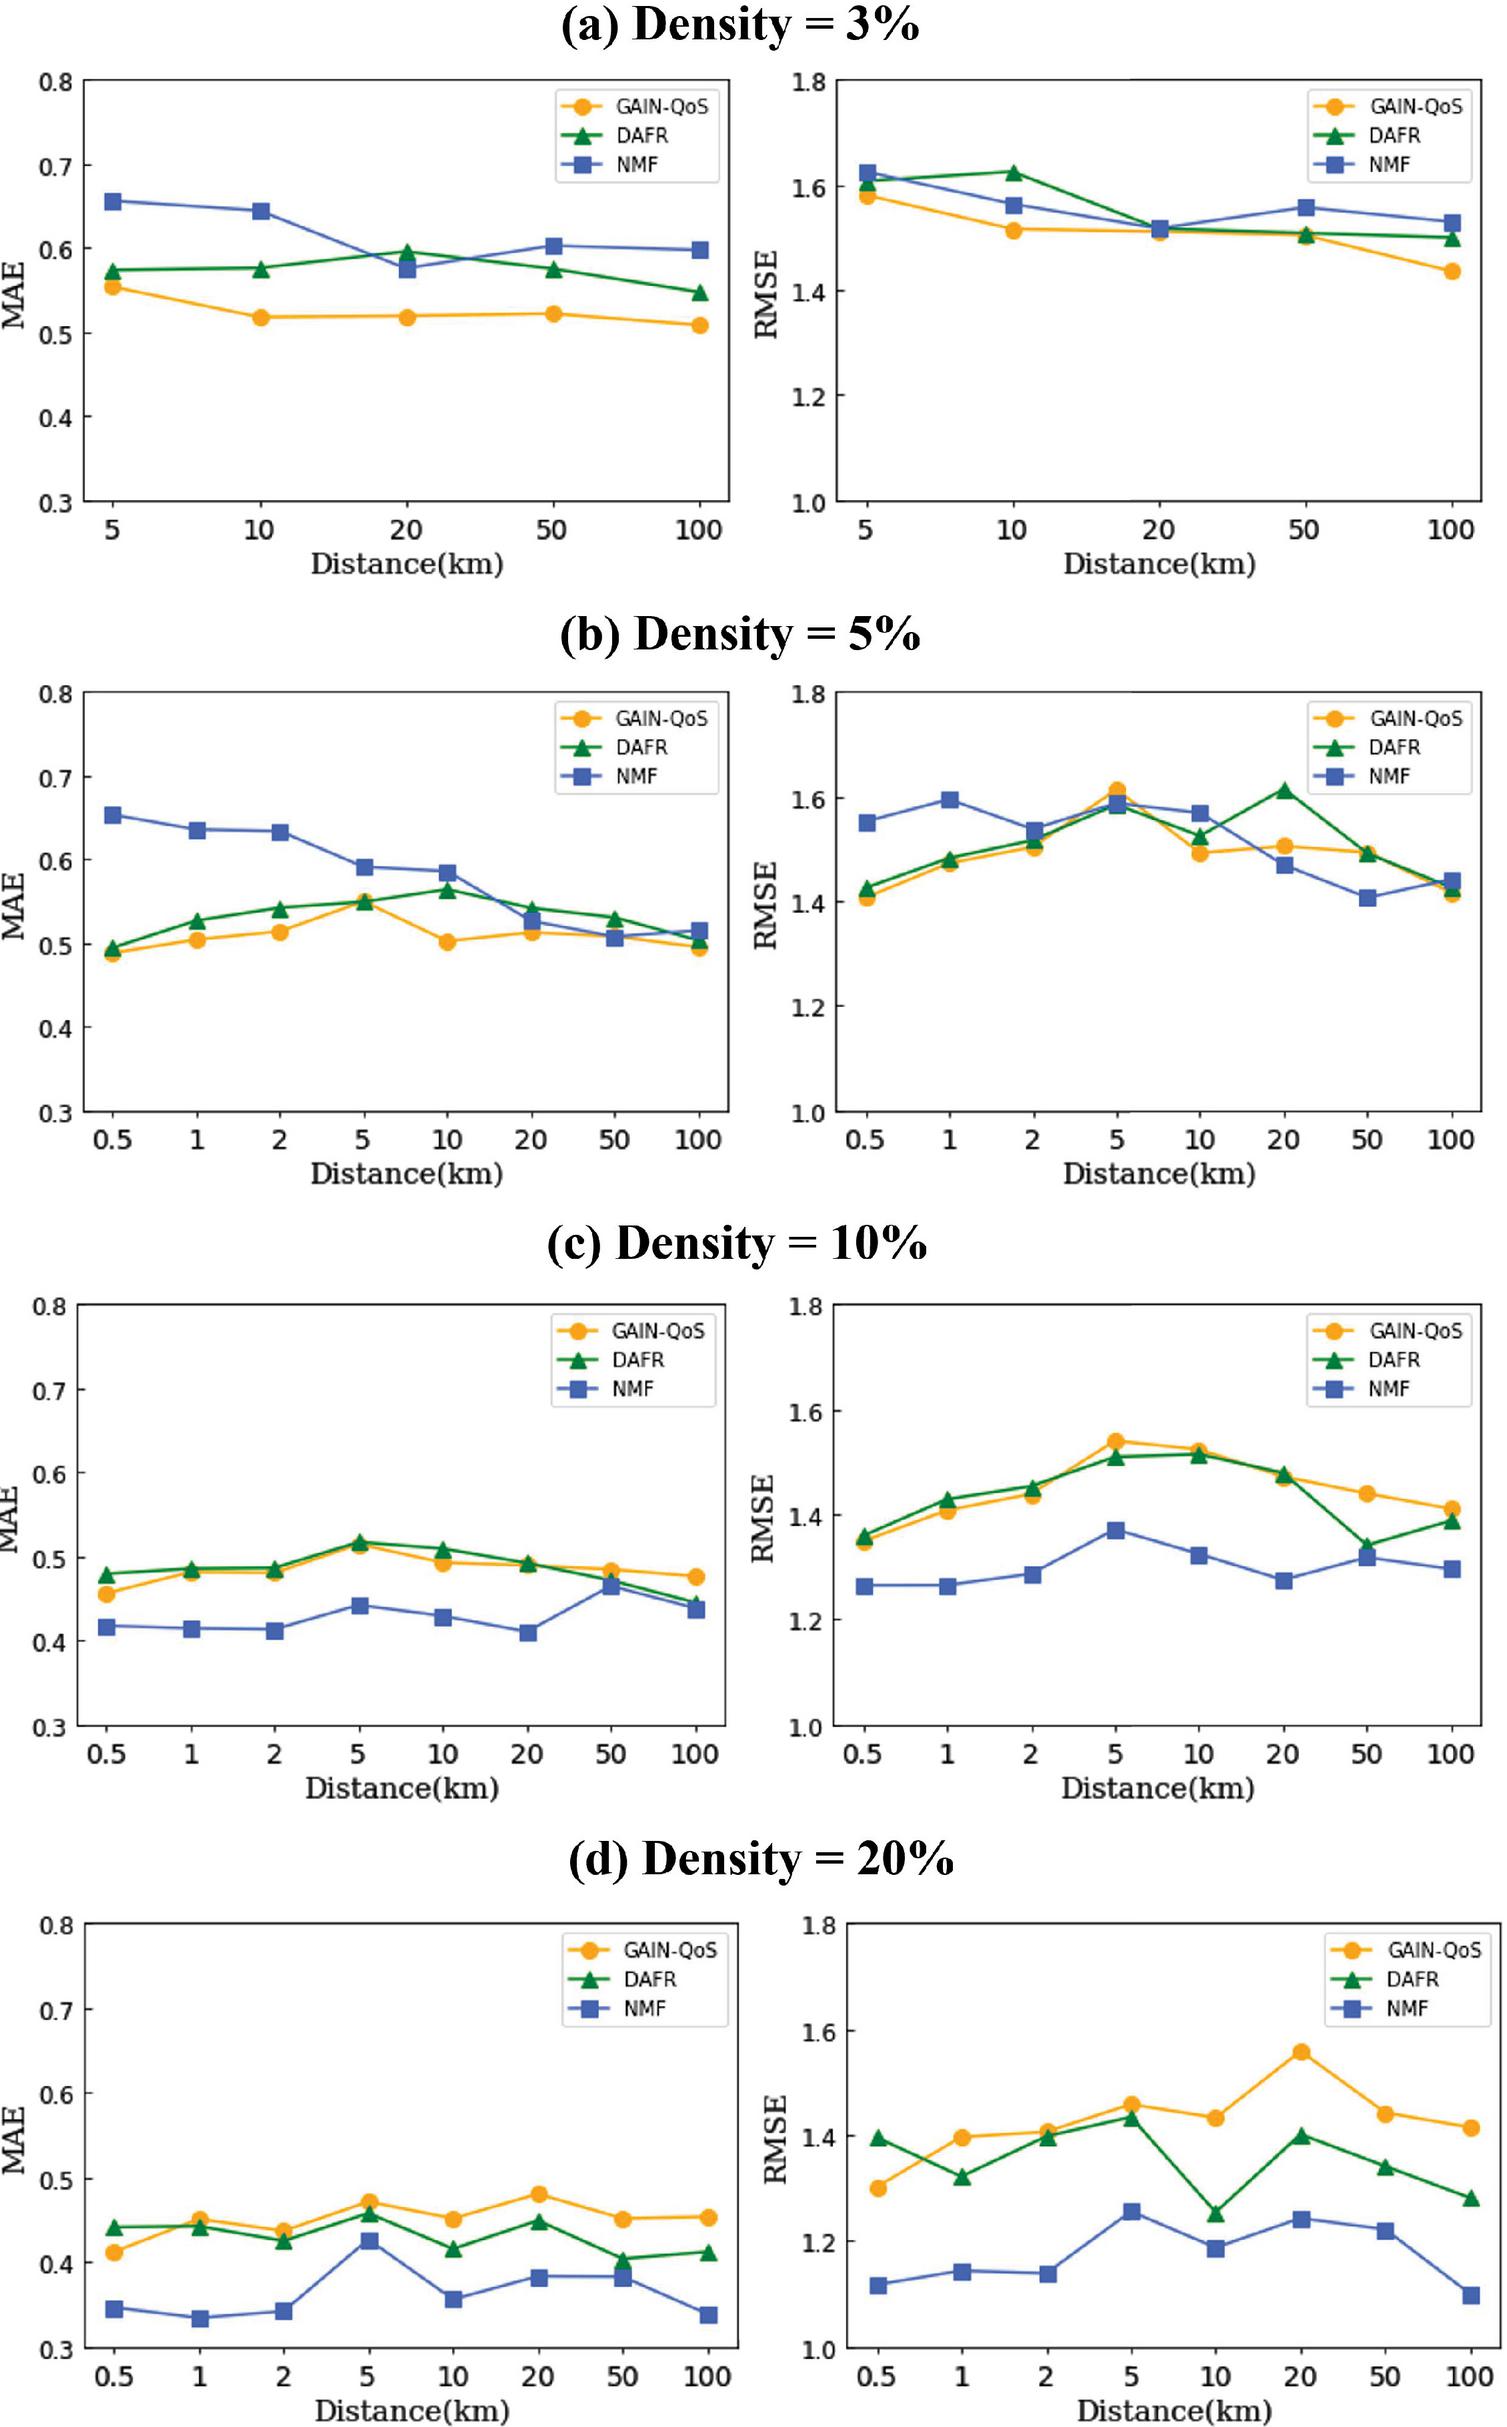
Figure 3 Effect of the distance between edge servers and users in edge computing.
Table 5 Comparison of performance between properties of the GAIN
| Density d% | ||||||||
| Method | MAE | RMSE | MAE | RMSE | MAE | RMSE | MAE | RMSE |
| GAIN-QoS | 0.5241 | 1.5096 | 0.5091 | 1.4878 | 0.4844 | 1.4475 | 0.4511 | 1.4263 |
| GAIN-QoS w/o | 0.5361 | 1.5359 | 0.5320 | 1.5374 | 0.5710 | 1.7525 | 0.6705 | 2.3539 |
| GAIN-QoS w/o Hint | 0.5314 | 1.5166 | 0.5175 | 1.4875 | 0.5539 | 1.5749 | 1.1187 | 2.8152 |
| GAIN-QoS w/o Hint & | 0.5625 | 1.5925 | 0.5652 | 1.6012 | 0.6158 | 2.1539 | 1.3761 | 3.4495 |
As the distance increases, the number of users increases, and thus the QoS data increase as well. When the density was 3%, the GAIN-QoS performed well at all distances. In particular, in the case of MAE, our method produces the best performance. When the density was 5%, the performance difference between GAIN-QoS and DAFR according to the distance in MAE is not significant. However, in NMF, the performance difference according to the distance is considerable. When the density was 10% and 20%, NMF had excellent performance at all distances. There was a slight difference in performance according to the distance in all three methods, and GAIN-QoS shows superior accuracy as the density is lower. It shows the best performance at 0.5 km, followed by 100 km. However, the performance difference between the two distances shows 0.01 to 0.02 in MAE and 0.01 to 0.06 in RMSE.
Figure 3(a) shows the performance when the training data density is 3% and the MAE and RMSE performance are not shown from 0.5 km to 2 km. When the training data density is 3%, a user service invocation matrix containing at least 20 services and 20 users is required for GAIN-QoS to operate in the edge computing environment we built. Therefore, this minimum condition is not satisfied for 0.52km.
5.3 Answers to RQ 3
In this research question, the factors affecting the performance of the GAIN-QoS model in edge computing QoS prediction were identified. The characteristics of the GAIN framework are the reconstruction loss ()) and the use of the hint vector (H). We perform a sensitivity analysis to validate how each of these affects the performance of GAIN-QoS in an edge computing environment.
Table 5 shows that the performance of GAIN-QoS improves when both reconstruction loss and hint are included. In the table, values in bold face indicate the best performance. The hint is a hyperparameter that affects the performance of the GAIN model itself [14]. Specifically, we observed that the performance of GAIN-QoS w/o Hint & without both reconstruction loss and the hint was the lowest in all training data densities and did not properly learn the distribution of data at high training data density. In addition, the performance improved when the reconstruction loss was used (GAIN-QoS w/o Hint). Furthermore, using a hint vector (GAIN-QoS) improves performance, especially at high densities, and the performance difference is very high.
So, we use GAIN-QoS, including both reconstruction loss and hint.
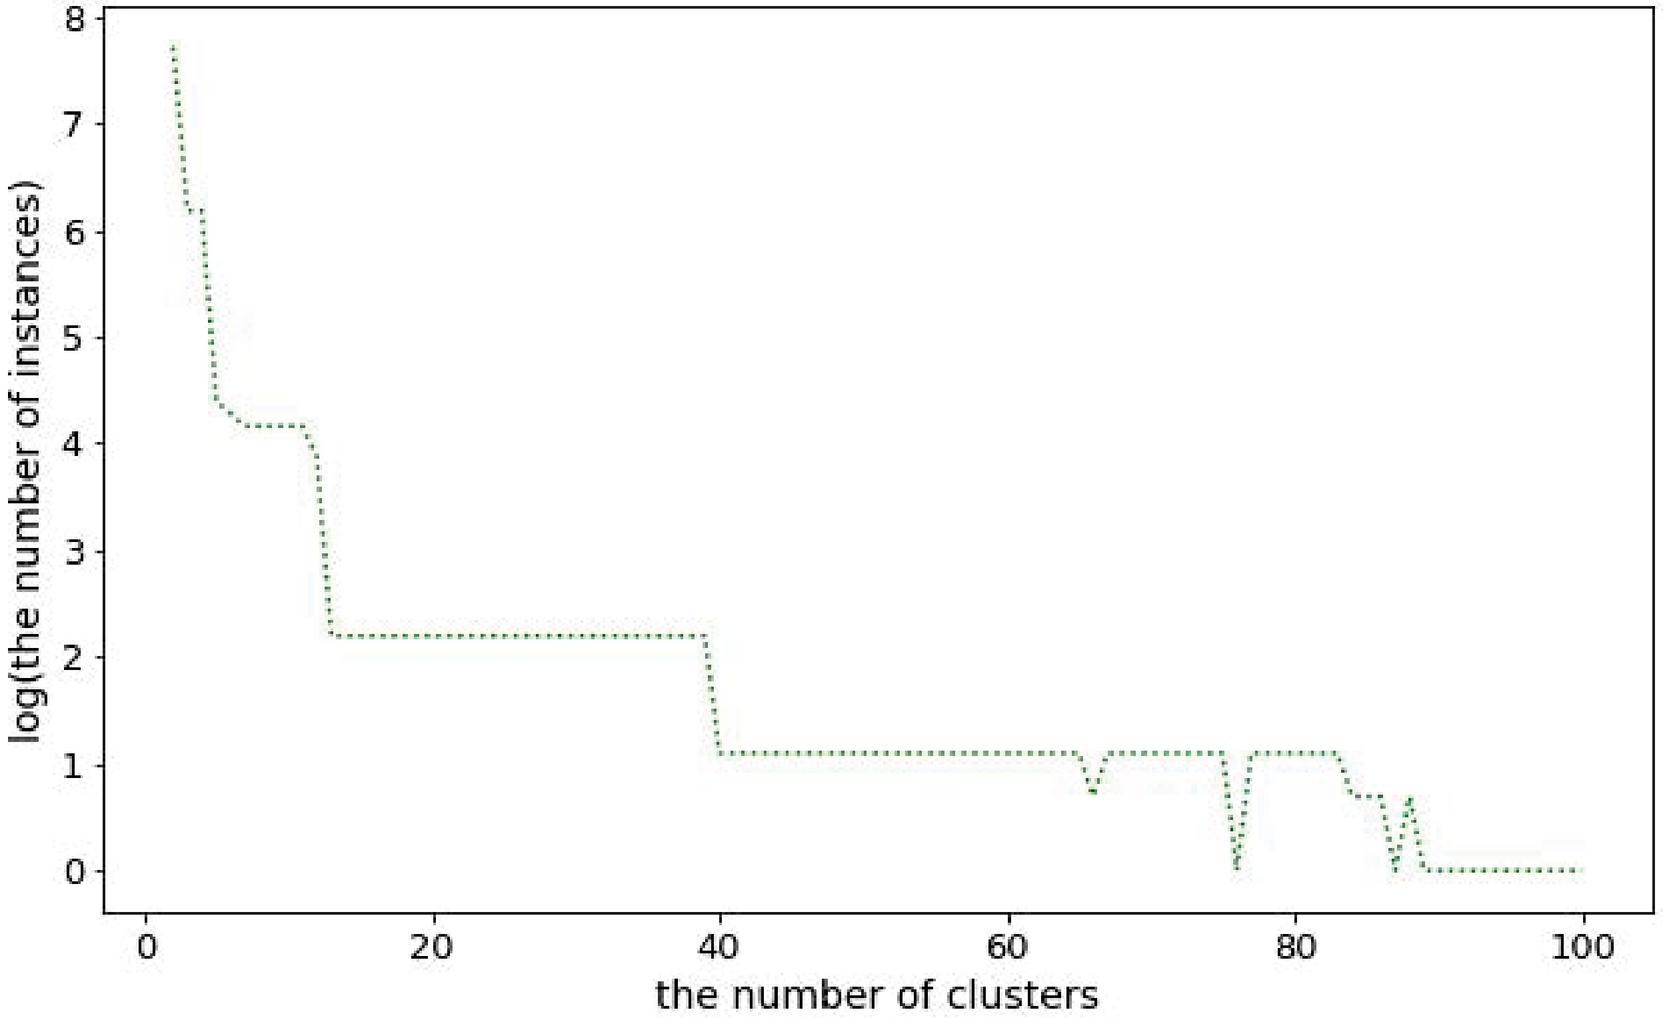
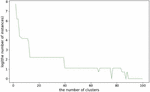
Figure 4 Minimum number of included services based on number of clusters.
6 Discussion
In this section, we describe in detail the built-in edge computing environment. We used the k-means clustering algorithm for adjacent group services. The value of k, the number of clusters, is a hyper-parameter, and it indicates a number of edge computing service groups in our technique. Thus, the larger the number of service groups, the more the edge computing environment is reflected because adjacent services are grouped.
| (8) |
Figure 4 shows the number of clusters and the minimum number of services included in one cluster. The y-axis in Figure 4 shows the log scale result of the minimum number of services included in one cluster. As the number of clusters decreases, the number of services included in the cluster increases, but this is difficult to see as an environment for edge computing. On the other hand, as the number of clusters increases, the edge computing environment is reflected, but the number of services included in one cluster decreases. Because the QoS data we use has a cold-start problem, a certain number of data must be included in the user service invocation matrix to apply the QoS prediction technique. In this study, the densities is 3%, 5%, 10%, 15% and 20%. Equation (8) shows the minimum number of services and users required for each density. For example, if the density is 5%, at least 20 services and 20 users must be included to apply the QoS prediction technique without errors.
Therefore, we divided the services into 30 groups. In this case, a cluster contains at least 9 services.
7 Threat to Validity
In this study, we identify some potential threats to the validity of our work.
7.1 External Validity
We propose a GAIN-QoS technique for QoS prediction of edge computing and use WSDream, i.e., a web service QoS dataset, to verify it. Currently, there are no publicly available QoS data for the QoS prediction of edge computing. Therefore, in related work on predicting the QoS of edge computing, the WSDream dataset was also used. We plan to conduct additional experiments based on the data in the future, when QoS data of edge computing is available.
7.2 Internal Validity
We compared GAIN-QoS with eight techniques. We analysed and implemented these studies by ourselves, and there may be errors in implementation. To mitigate this threat, we carefully validated the implementation.
We randomly filled the missing values in the user service invocation matrix to build a cold-start environment. These random factors may cause a bias in the performance we reported. To mitigate this, we took the average value of 30 iterations for each density.
8 Conclusion
In this paper, we propose a novel approach (i.e., GAIN-QoS) that reflects the edge computing environment and effectively solves the cold-start problem. We propose a promising solution in terms of which services the user will connect to among adjacent services. To this end, we group adjacent services through clustering. Subsequently, the distance between the service and the users in each cluster is measured. QoS values of users within a certain distance were obtained. Through this process, a user service invocation matrix reflecting the edge computing environment was established. Based on this matrix, QoS prediction is performed by applying GAIN, i.e., a missing value imputation model. Our proposed method shows superior performance compared to other methods when the density is low. In addition, depending on the distance between the service and the user, a slight difference in performance exists for each QoS prediction method.
In the future, we plan to improve the QoS prediction performance by using various context information of the edge computing environment and the web service QoS dataset.
Acknowledgement
This work was supported by the National Research Foundation of Korea (NRF) grant funded by the Korea government (Ministry of Science and ICT (MSIT)) (NRF-2019R1G1A1005047) and the Nuclear Safety Research Program through the Korea Foundation Of Nuclear Safety (KoFONS) using the financial resource granted by the Nuclear Safety and Security Commission (NSSC) of the Republic of Korea. (No. 2105030) and the MSIT (Ministry of Science and ICT), Korea, under the ITRC (Information Technology Research Center) support program (IITP-2021-2016-0-00313, IITP-2021-2020-0-01795) supervised by the IITP (Institute of Information & Communications Technology Planning & Evaluation).
References
[1] A. Ahmed and E. Ahmed, “A survey on mobile edge computing,” 2016 10th International Conference on Intelligent Systems and Control (ISCO), 2016, pp. 1–8, doi: 10.1109/ISCO.2016.7727082.
[2] Khan, W. Z., Ahmed, E., Hakak, S., Yaqoob, I., and Ahmed, A. (2019). Edge computing: A survey. Future Generation Computer Systems, 97, 219–235.
[3] Ghafouri, S. H., Hashemi, S. M., and Hung, P. C. (2020). A survey on Web service QoS prediction methods. IEEE Transactions on Services Computing.
[4] Zheng, Z., Zhang, Y., and Lyu, M. R. (2012). Investigating QoS of real-world web services. IEEE transactions on services computing, 7(1), 32–39.
[5] Yin, Y., Cao, Z., Xu, Y., Gao, H., Li, R., and Mai, Z. (2020). QoS prediction for service recommendation with features learning in mobile edge computing environment. IEEE Transactions on Cognitive Communications and Networking, 6(4), 1136–1145.
[6] Wang, S., Zhao, Y., Huang, L., Xu, J., and Hsu, C. H. (2019). QoS prediction for service recommendations in mobile edge computing. Journal of Parallel and Distributed Computing, 127, 134–144.
[7] Zou, G., Chen, J., He, Q., Li, K. C., Zhang, B., and Gan, Y. (2020). NDMF: Neighborhood-integrated deep matrix factorization for service QoS prediction. IEEE Transactions on Network and Service Management, 17(4), 2717–2730.
[8] Ryu, D., Lee, K., and Baik, J. (2018). Location-based web service QoS prediction via preference propagation to address cold start problem. IEEE Transactions on Services Computing.
[9] Yin, Y., Xu, Y., Xu, W., Gao, M., Yu, L., and Pei, Y. (2017). Collaborative service selection via ensemble learning in mixed mobile network environments. Entropy, 19(7), 358.
[10] He, X., Liao, L., Zhang, H., Nie, L., Hu, X., and Chua, T. S. (2017, April). Neural collaborative filtering. In Proceedings of the 26th international conference on world wide web (pp. 173–182).
[11] Yin, Y., Zhang, W., Xu, Y., Zhang, H., Mai, Z., and Yu, L. (2019). QoS prediction for mobile edge service recommendation with auto-encoder. IEEE Access, 7, 62312–62324.
[12] Yin, Y., Chen, L., Xu, Y., Wan, J., Zhang, H., and Mai, Z. (2020). QoS prediction for service recommendation with deep feature learning in edge computing environment. Mobile networks and applications, 25(2), 391–401.
[13] Zheng, Z., Zhang, Y., and Lyu, M. R. (2010, July). Distributed qos evaluation for real-world web services. In 2010 IEEE International Conference on Web Services (pp. 83–90). IEEE.
[14] Yoon, J., Jordon, J., and Schaar, M. (2018, July). Gain: Missing data imputation using generative adversarial nets. In International Conference on Machine Learning (pp. 5689–5698). PMLR.
[15] Camino, R. D., Hammerschmidt, C. A., and State, R. (2019). Improving missing data imputation with deep generative models. arXiv preprint arXiv:1902.10666.
[16] Su, X., and Khoshgoftaar, T. M. (2009). A survey of collaborative filtering techniques. Advances in artificial intelligence, 2009.
[17] Shao, L., Zhang, J., Wei, Y., Zhao, J., Xie, B., and Mei, H. (2007, July). Personalized qos prediction for web services via collaborative filtering. In Ieee international conference on web services (ICWS 2007) (pp. 439–446). IEEE.
[18] Yin, Y., Aihua, S., Min, G., Yueshen, X., and Shuoping, W. (2016). QoS prediction for Web service recommendation with network location-aware neighbor selection. International Journal of Software Engineering and Knowledge Engineering, 26(04), 611–632.
[19] Chen, X., Liu, X., Huang, Z., and Sun, H. (2010, July). Regionknn: A scalable hybrid collaborative filtering algorithm for personalized web service recommendation. In 2010 IEEE international conference on web services (pp. 9–16). IEEE.
[20] Yang, Y., Zheng, Z., Niu, X., Tang, M., Lu, Y., and Liao, X. (2018). A location-based factorization machine model for Web service QoS prediction. IEEE Transactions on Services Computing.
[21] Chen, Z., Shen, L., Li, F., and You, D. (2017). Your neighbors alleviate cold-start: On geographical neighborhood influence to collaborative web service QoS prediction. Knowledge-Based Systems, 138, 188–201.
[22] Na, S., Xumin, L., and Yong, G. (2010, April). Research on k-means clustering algorithm: An improved k-means clustering algorithm. In 2010 Third International Symposium on intelligent information technology and security informatics (pp. 63–67). IEEE.
[23] Alsabti, K., Ranka, S., and Singh, V. (1997). An efficient k-means clustering algorithm. In Proceeding of the 1st Workshop on High Performance Data Mining.
[24] Nazeer, K. A., and Sebastian, M. P. (2009, July). Improving the Accuracy and Efficiency of the k-means Clustering Algorithm. In Proceedings of the world congress on engineering (Vol. 1, pp. 1–3). London: Association of Engineers.
[25] Goodfellow, I., Pouget-Abadie, J., Mirza, M., Xu, B., Warde-Farley, D., Ozair, S., …and Bengio, Y. (2014). Generative adversarial nets. Advances in neural information processing systems, 27.
[26] Gondara, L., and Wang, K. (2018, June). Mida: Multiple imputation using denoising autoencoders. In Pacific-Asia conference on knowledge discovery and data mining (pp. 260–272). Springer, Cham.
[27] Wu, H., Yue, K., Li, B., Zhang, B., and Hsu, C. H. (2018). Collaborative QoS prediction with context-sensitive matrix factorization. Future Generation Computer Systems, 82, 669–678.
[28] Shao, L., Zhang, J., Wei, Y., Zhao, J., Xie, B., and Mei, H. (2007, July). Personalized qos prediction forweb services via collaborative filtering. In Ieee international conference on web services (ICWS 2007) (pp. 439–446). IEEE.
[29] Zheng, Z., Ma, H., Lyu, M. R., and King, I. (2010). QoS-aware web service recommendation by collaborative filtering. IEEE Transactions on services computing, 4(2), 140–152.
[30] Zheng, Z., and Lyu, M. R. (2010, May). Collaborative reliability prediction of service-oriented systems. In 2010 ACM/IEEE 32nd International Conference on Software Engineering (Vol. 1, pp. 35–44). IEEE.
[31] Févotte, C., and Idier, J. (2011). Algorithms for nonnegative matrix factorization with the -divergence. Neural computation, 23(9), 2421–2456.
Biographies

Jiwon Choi received the B.S degree in Software Engineering from Jeonbuk National University in 2020. She is currently pursuing the M.S degree in Software Engineering, Jeonbuk National University. Her research areas include software defect prediction, deep learning, edge computing QoS prediction, and software reliability engineering.

Jaewook Lee is currently pursuing the B.S degree in Software Engineering from Jeonbuk National University. His research areas include software defect prediction, deep learning, optimization, and edge computing QoS prediction.

Duksan Ryu earned a bachelor’s degree in computer science from Hanyang University in 1999 and a Master’s dual degree in software engineering from KAIST and Carnegie Mellon University in 2012. He received his Ph.D. degree in school of computing from KAIST in 2016. His research areas include software analytics based on AI, software defect prediction, mining software repositories, and software reliability engineering. He is currently an assistant professor in software engineering department at Jeonbuk National University.

Suntae Kim is a professor of the Department of Software Engineering at Jeonbuk National University. He received Ph.D. Degree in Computer Science & Engineering from Sogang University in 2010. His research areas include Blockchain, Software Engineering and Artificial Intelligence.

Jongmoon Baik received his B.S. degree in computer science and statistics from Chosun University in 1993. He received his M.S. degree and Ph.D. degree in computer science from University of Southern California in 1996 and 2000 respectively. He worked as a principal research scientist at Software and Systems Engineering Research Laboratory, Motorola Labs, where he was responsible for leading many software quality improvement initiatives. His research activity and interest are focused on software six sigma, software reliability & safety, and software process improvement. Currently, he is an associate professor in school of computing at Korea Advanced Institute of Science and Technology (KAIST). He is a member of the IEEE.
Journal of Web Engineering, Vol. 21_1, 27–52.
doi: 10.13052/jwe1540-9589.2112
© 2021 River Publishers