A Large-scale Empirical Assessment of Web API Size Evolution
Fabio Di Lauro*, Souhaila Serbout and Cesare Pautasso
Software Institute (USI), Lugano, Switzerland
E-mail: fabio.di.lauro@usi.ch; souhaila.serbout@usi.ch; c.pautasso@ieee.org
*Corresponding Author
Received 20 December 2021; Accepted 07 June 2022; Publication 09 November 2022
Abstract
Like any other type of software, also Web Application Programming Interfaces (APIs) evolve over time. In the case of widely used API, introducing changes is never a trivial task, because of the risk of breaking thousands of clients relying on the API. In this paper we conduct an empirical study over a large collection of OpenAPI descriptions obtained by mining open source repositories. We measure the speed at which Web APIs change and how changes affect their size, simply defined as the number of operations. The dataset of API descriptions was collected over a period of one year and includes APIs with histories spanning across up to 7 years of commits. The main finding is that APIs tend to grow, although some do reduce their size, as shown in the case study examples included in the appendix.
Keywords: Web API, API evolution, software evolution, OpenAPI.
1 Introduction
Web Application Programming Interfaces (APIs) are a fundamental building blocks used to build different kind of applications and services. They are able to accelerate the development of complex systems taking advantage of the HTTP protocol [33] and the REST architectural style [14]. Furthermore, APIs could be implemented using different programming languages [5] achieving a high level of reusability. The evolution of Web APIs can be caused by different factors such as the changing of their underlying infrastructure or services used by the API [24, 37, 25]. The changes needed by APIs, in order to delay their obsolescence, might impact in clients in different ways [30]. Providers usually tend to announce breaking changes to clients and use different patterns [31] to avoid functionality disruptions and abnormal behaviors. While extending APIs by adding new operations is a strategy that ensures backwards compatibility, deprecating and then removing no longer supported operations can break old clients [41].
In this paper we analyzed Web APIs, described with different versions of the OpenAPI [1] standard (previously known as Swagger), retrieving their descriptions from public software repositories, stored on GitHub. This approach permits us to retrieve also the documentation history and APIs life cycle details from the versioning system. In this paper, we extend our previous feasibility study [26] with the analysis of a larger dataset of 395,219 commits of 163,953 APIs collected from December 1st, 2020 to October 27th, 2021. Our goal is to assess if the conclusions drawn in our previous analysis [26] could be confirmed using a much larger set of artifacts.
The goal of the previous work [26] was to assess the feasibility of performing an empirical study by mining open source repositories to investigate on Web API evolution by gathering the commit histories of APIs. In Table 1, we show a detailed comparison of the datasets used in each of the studies. In this paper we include additional analysis results and data visualizations.
In particular, in this paper we pose the following research questions:
Q1: How stable are API artifacts over time?
Q2: Do APIs tend to grow or shrink over time?
Q3: Does the frequency of change of an API depend on its age?
Q4: Is the API commit history length proportional to the API age?
Q5: What is the distribution of the API size metric?
Q6: How often APIs update the version of the specification language used to describe them?
Web API descriptions [1] enumerate the resource paths exposed by the API, the HTTP verbs available for each path and many others details such as which request parameters are expected by those paths, which HTTP status codes are found in the responses and which schemas are used to construct the request and response message payloads. Over time, they can grow to become complex documents, reflecting how the changing requirements of multiple clients have been satisfied with by API service providers [25].
To reduce the complexity of analysing all the components involved in changes while keeping the chance to detect changes, in this paper we chose to abstract the APIs description contents using a basic size metric. This metric is measured counting the number of operations, detected in artifacts present in APIs histories. While many components of an API description could change, we focus on this metric because we want to study the evolution of APIs from the structural perspective while keeping the possibility to extend this work in the future, considering other metrics [35].
Another challenge regards how to deal with a relatively large amount of API description artifacts, which change over time. In this paper we experiment with data visualizations which are intended to give an overview of the temporal aspects and the observable dynamics of the API evolution.
The main finding is that while we found only one commit for most of the API descriptions we discovered, there is a significant number (5,176 APIs) for which more than 10 commits are present. This confirms the feasibility of mining open source repositories to observe the evolution of API descriptions.
We also found an exponential distribution of the API size, with one outlier having up to 668 operations. Within the APIs with multiple commits, the majority (55.8%) does not change their size (when measuring it as the number of operations). Among the APIs which do, 10,798 APIs grow larger, while 1,448 become smaller, when observing the difference between the initial commit and the last one present in their history. This confirms the previous result, that Web APIs tend to grow over time and also paves the way towards more detailed metrics which can detect changes to other elements of the OpenAPI metamodel.
Regarding the API stability, for the APIs with multiple commits, we observed a fast-slow dynamic where bursts of frequent commits are interspersed with large periods of inactivity. In particular, while some APIs do not seem to stop changing as they get older, the number of commits present in the API history is not proportional to the API age.
Additionally, we observed the increasing growth of the API description artifacts making use of the OpenAPI/Swagger specification languages, which so far tend to double every year. Still, very few APIs change the chosen description language as they evolve.
Table 1 Comparison between the ICWE [26] dataset and the one analyzed in this paper
| Metric | ICWE2021 | JWE |
| API collection size (valid APIs) | 4,682 | 163,953 |
| API collection size (more than 10 commits) | 280 | 5,176 |
| Total number of commits | 34,638 | 395,219 |
| Max number of commits/API | 299 | 736 |
| Max number of versions/API | 97 | 143 |
| Max API age (days) | 1826 | 2422 |
| Max API age (years) | 5 | 6.63 |
| Max API size (operations) | 357 | 668 |
| Delta(API Size) (Min) | 192 | -67 |
| Delta(API Size) (Max) | 122 | 332 |
| Total API Size Variation (Min) | 55 | 654 |
| Total API Size Variation (Max) | 140 | 174 |
The rest of this paper is structured as follows. Section 2 presents an overview of collected API artifacts. Section 3 outlines the results that we obtained and shows selected Web API evolution cases. We discuss the results in Section 4. Section 5 summarizes the related work before we conclude and outline further research challenges in Section 6.
We attached to the end of the paper an Appendix which includes 12 case studies, including updated evaluation visualizations of the case studies presented in the work of ICWE2021. The goal is to show how these APIs evolved during the past last year.
2 Dataset
2.1 Dataset Collection
We built a software repository mining tool to retrieve the OpenAPI specifications from GitHub, hereinafter called “crawler”, that is able to discover new projects containing OpenAPI specification files using the GitHub API. We developed our pipeline using Python language and a MySQL database to store metadata and some extracted metrics about APIs and their commits. We designed the crawler architecture composed by the following components:
1. Path Finder: This component discovers new potential OAS files and stores their URL in a table as “to be evaluated”. Since the OAS format is not recognized by GitHub, the discovery is based on queries, submitted to the GitHub search API, to retrieve YAML/JSON files which contain the terms: “openapi” or “swagger”, “paths”, “info”, “title”. These are different from the ones used to generate the dataset of the previous study, which relied on file naming conventions (i.e., retrieving all YAML/JSON files named “openapi”). Changing the GitHub search query has resulted in a larger number of artifacts being discovered.
2. Curiosity: This component downloads discovered OAS files and stores their content on the filesystem and related meta information in the database. To keep track of the provenance of the files, we use the GitHub API to retrieve the project name, the owner, the URL and the commit identifier of the file, as well as the date of the last commit and the date of the repository’s creation.
Curiosity is also responsible for fetching and downloading the history of each discovered OpenAPI file, so that in addition to the latests version of the artifacts, all previous commits in the main repository branch and their metadata are retrieved and stored for further analysis.
3. Updater: Because of the continuous evolution of repositories on GitHub, our tool includes the Updater component which is responsible of keeping the filesystem and database contents constantly updated. If an OpenAPI file and its history haven’t been updated for more than 5 days, Updater will use the metadata stored in the database to attempt to download the latest versions of the file and update its history in the database. After each update, Validator is invoked.
4. Validator: As Path Finder and Curiosity accomplish their task based on a heuristic to detect and download potential OpenAPI files, Validator is the component responsible for verifying if the previously downloaded files are really OpenAPI files, by parsing them and validating them against the OpenAPI Specification, using the tool Prance [2] configured with the validatoropen-api-spec-validator [3].
Moreover, an OpenAPI description can be split into several files. This component makes sure that all the referenced files are downloaded from GitHub before validating the description.
5. Parser: This component is invoked by Validator to parse the OpenAPI models and extract some metrics related to the API structure: number of paths, number of operations with their parameters and responses, number of HTTP methods. These metrics are stored in the database for further analysis.
Figure 1 shows the partial architecture of the API crawler and the processed used to discover, fetch, bundle, validate and parse the OAS files and their commit histories obtained from GitHub.
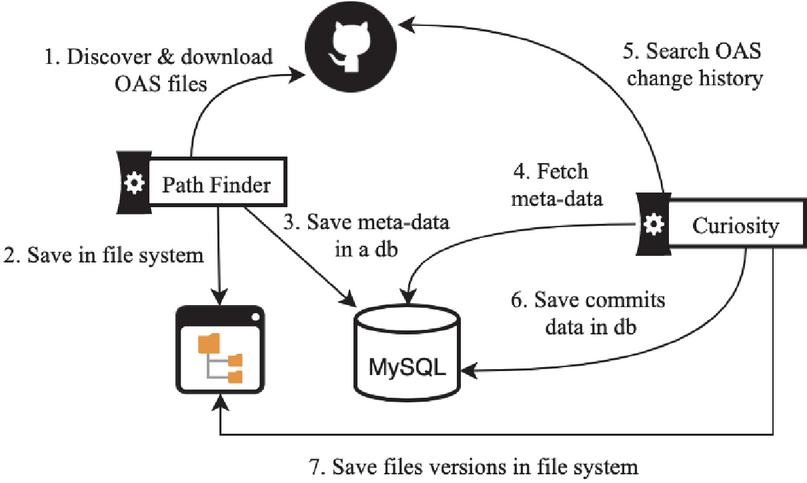
Figure 1 API collection crawler architecture (showing only the path finder and curiosity components).
Table 2 Which OpenAPI versions are used by the API artifacts? How many APIs changed the OpenAPI language version during their evolution?
| Artifact specification language version | # Artifacts | # APIs | ||||
| Swagger 2.0 | 240,351 | % | 100,795 | % | ||
| OpenAPI 3.0.* | 148,587 | % | 62,354 | % | ||
| OpenAPI 3.0.0 | 87,147 | % | 39,860 | % | ||
| OpenAPI 3.0.1 | 36,800 | % | 13,121 | % | ||
| OpenAPI 3.0.2 | 14,958 | % | 6,382 | % | ||
| OpenAPI 3.0.3 | 9,530 | % | 2,898 | % | ||
| OpenAPI 3.0.4 | 37 | % | 14 | % | ||
| OpenAPI 3.0.5 | 13 | % | 7 | % | ||
| OpenAPI 3.0.6 | 3 | % | 3 | % | ||
| OpenAPI 3.0.7 | 11 | % | 4 | % | ||
| OpenAPI 3.0.9 | 4 | % | 4 | % | ||
| OpenAPI 3.1.0 | 84 | % | 61 | % | ||
| Not specified | 6,070 | % | 2024 | % | ||
| Not existent or malformed OAS version | 25 | % | 12 | % | ||
| APIs with 1 valid OAS version | 160,970 | % | ||||
| APIs with 2 valid OAS version | 1,010 | % | ||||
| APIs with more than 2 valid OAS versions | 51 | % | ||||
| Total | 395,031 | 163,953 | ||||
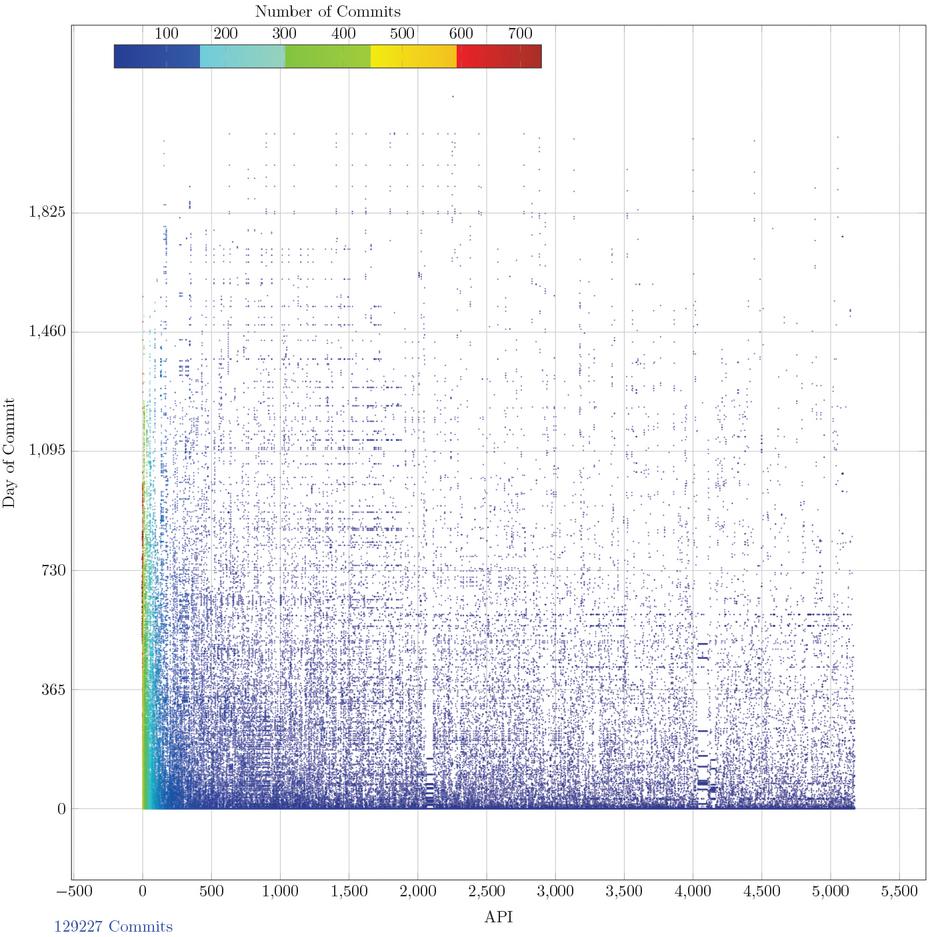
Figure 2 Dataset overview: commit history of APIs with more than 10 commits, sorted by number of commits.
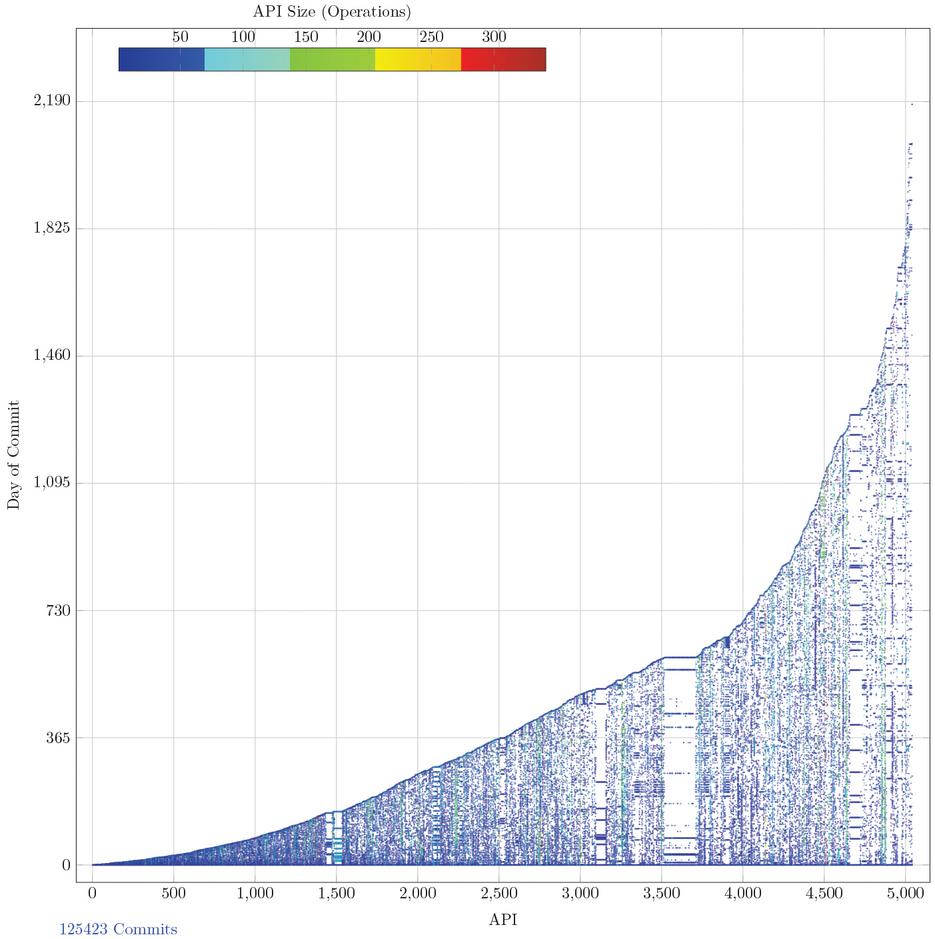
Figure 3 Dataset overview: commit history of APIs with more than 10 commits, sorted by age and colored by the size of each commit.
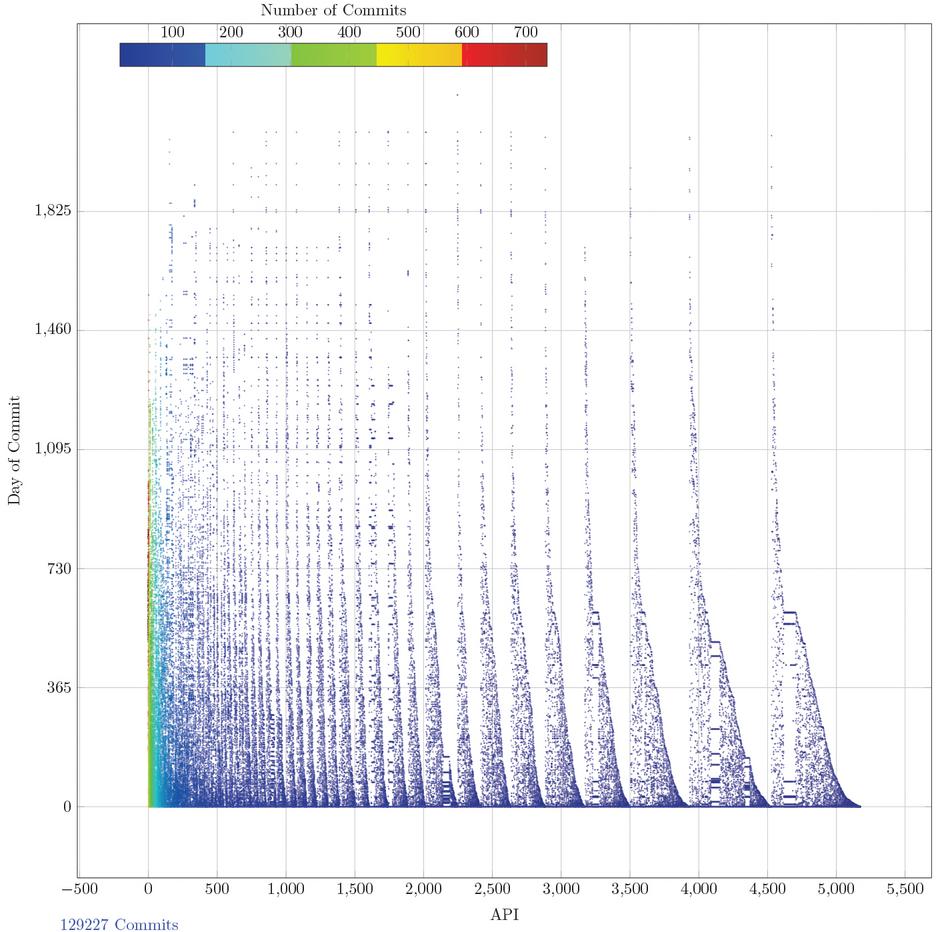
Figure 4 Dataset overview: commit history of APIs with more than 10 commits, sorted by number of commits and age.
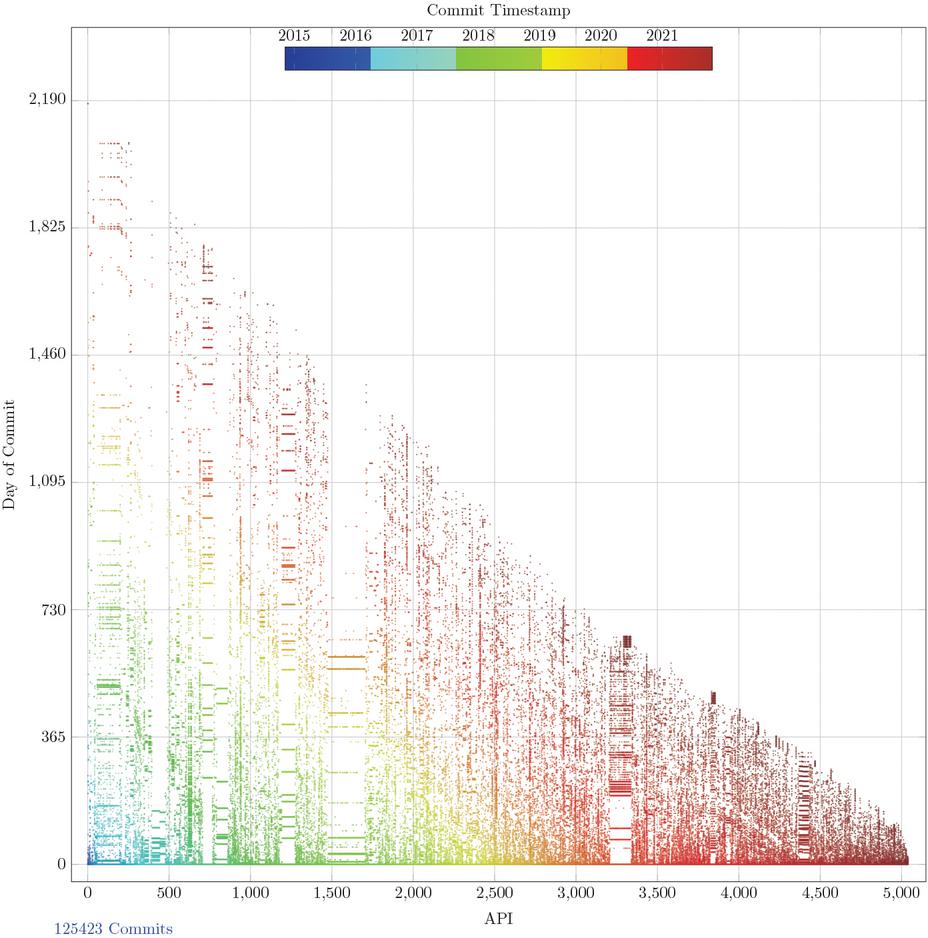
Figure 5 Dataset overview: commit history of APIs with more than 10 commits, sorted by initial commit timestamp and colored by the commit absolute timestamp.
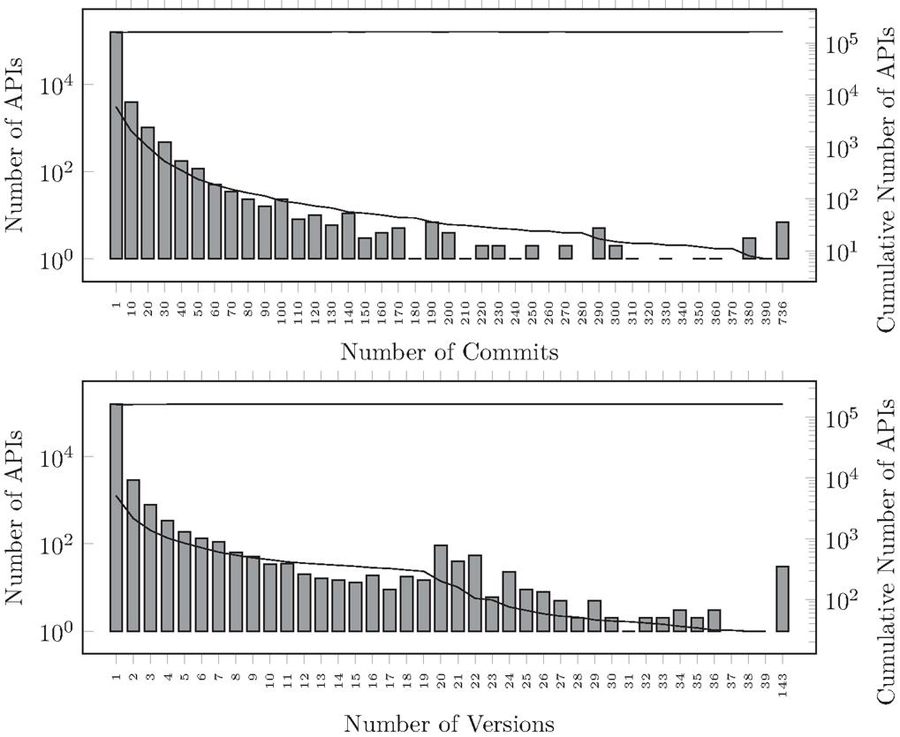
Figure 6 How many commits and versions are there for each API? (log scale).
2.2 Dataset overview
To assess how an API evolves, we mined multiple versions of its OAS file and stored their associated metadata, such as commit timestamp, the version identifier, OAS version and API title. In order to ensure we can compare the larger API collection with our previous results [26], we used the same size metric represented by the total count of operations available for each path, defined in each OAS artifact. While such information can be extracted from many API description languages [40], we chose to focus on OpenAPI standard because of its widely adoption in the industry for Web API modeling.
Crawling GitHub from December 1st, 2020 to October 27th, 2021 permitted us to discover 747,629 potential OAS and Swagger artifacts belonging to 265,362 different GitHub projects. Later, we filtered them using the Validator component obtaining a set of 395,019 artifacts considered compliant with OpenAPI 3.x or Swagger 2.0 specifications – hereinafter we refer to these artifacts as the valid ones – belonging to 163,953 different API projects. These validated artifacts constitute the dataset considered in this study. The oldest artifact is from Sept 8th, 2014, while the most recent artifact was committed on October 26th, 2021.
Furthermore, we observed that more than 28% of the APIs have more than 1 commit. To analyze significant histories we select some case studies, described in Sec. Appendix: Web API Evolution case studies, filtering again our initial dataset to only APIs with more than 10 commits and in which more than 3 distinct versions are detected.
In Table 2 we can see how these artifacts are distributed across the different language versions. We found that 98.2% of the total API projects used only 1 OpenAPI/Swagger versions, 0.6% used 2 versions while only 52 of them upgraded their artifacts through more than 2 versions.
The visualization of the entire dataset, filtered to include only APIs that present more than 10 commits in their histories, is shown in Figure 2. In the plot, each dot represents a commit. On the horizontal axis are distributed the APIs sorted by how many commits are present in their history, while values on the vertical axis represents when each commit occurred, relative to the time of the initial commit for the corresponding API. The color of the dot shows how many commits have been found in each API history.
While most API histories have less than 100 commits, how are those commits distributed over time? Figure 3 shows the same dataset, which is however sorted on the horizontal axis using the APIs age. APIs which have a very short lifespan are shown on the left, APIs which age up to more than 5 years are found on the right. Here we can see that approx. half of the APIs do not reach 1 year of age. Still, there are about 1000 APIs with more than 10 commits which grow beyond 2 years of age. In this visualization the color of the dot indicates the API size of the corresponding commit. As most APIs in the dataset are small, the dark blue color is prevalent. A few vertical streaks of lighter colors highlight the presence of larger APIs, or of APIs whose size changes over time.
The visual representations in Figures 2–4 highlight the relationship between the age of the API, how many changes are found in its history and the frequency of those change. The waves visible in Figure 4 are due to clusters of APIs with exactly the same number of commits, which have been sorted by their age (the oldest appear on the right side of each cluster). Also in this case we can see that the distribution of the commits is not uniform over time.
Figure 5 presents the temporal aspect of the same dataset. Here the APIs are sorted by the absolute timestamp of their initial commit. The oldest APIs are on the left side, while the most recent ones on the right. The color is used to distinguish the absolute timestamp of the corresponding commit. We can see that the number of commits grows each year as more and more API descriptions which use the OpenAPI language are added to GitHub. The vertical axis is the same as in the previous visualizations. The horizontal bars highlight sets of APIs which have a similar age and often push changes at the same time.
3 Results
3.1 Change Granularity: Commits and Versions
Figure 6 and Table 3 describe the APIs evolution analyzing commits number and versions, mined from artifacts found in those commits, for each API project. All APIs present less than 740 commits and 71.3% of the APIs covered by this study exhibit only 1 commit in their histories. The relationship between commits and versions detected in their artifacts is shown on Figure 7 while in Figure 8 we can observe a detailed view of the first 100 commits. The number of version is bound by the number of commits because each version identifier change requires at least one commit to be stored in the API history.
Table 3 How many APIs reach a certain age? See Figure 9 for the API age histogram with bins of 100 days and Figure 10 for the API age vs. # Commits scatterplot.
| API lifespan | # Commits | # APIs | |||||
| min | median | avg | stdev | max | |||
| [0 day] | 1 | 1 | 1.0 | 0.0 | 1 | 116,945 | % |
| (0, 1 day] | 2 | 2 | 2.4 | 1.1 | 21 | 5,503 | % |
| (1 day, 1 year] | 2 | 3 | 5.2 | 7.9 | 403 | 29,637 | % |
| (1 year, 2 years] | 2 | 5 | 9.5 | 20.5 | 454 | 6,388 | % |
| (2 years, 3 years] | 2 | 5 | 11.2 | 27.6 | 736 | 1,871 | % |
| (3 years, 4 years] | 2 | 8 | 16.3 | 29.4 | 396 | 897 | % |
| (4 years, 6.6 years] | 2 | 16 | 26.2 | 50.6 | 582 | 263 | % |
| Total | 163,953 | ||||||
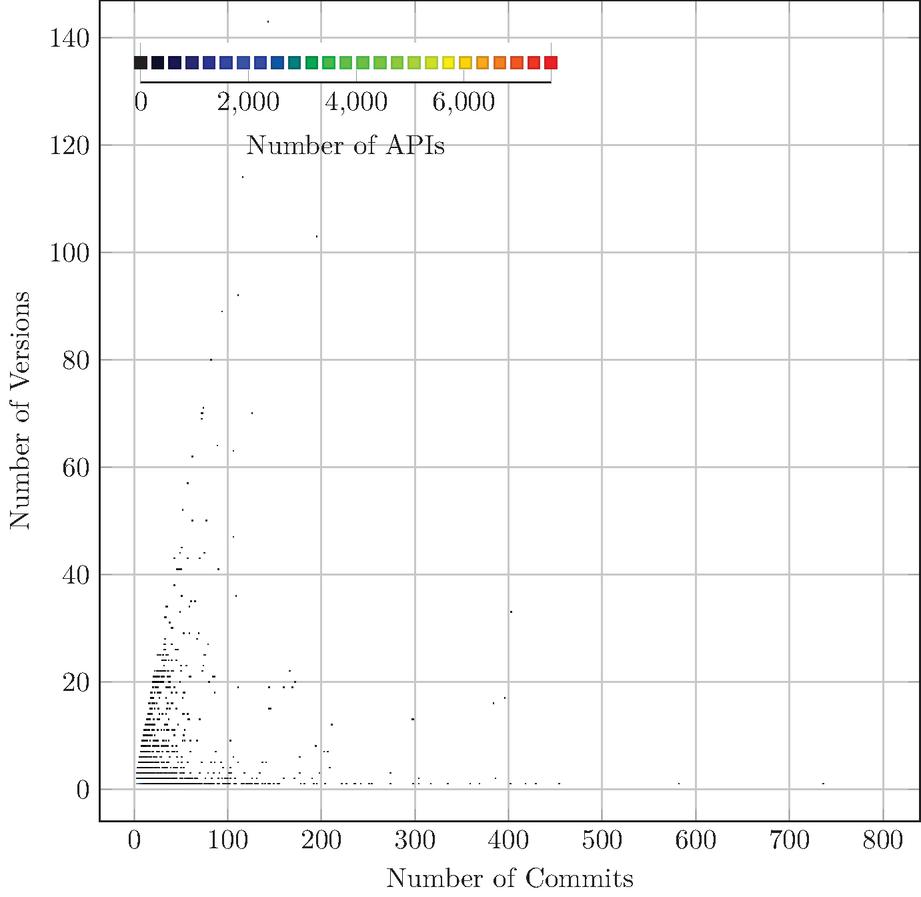
Figure 7 Commits and versions (APIs with more than 2 commits).

Figure 8 Commits and versions (APIs with more than 2 commits and less than 100 commits).
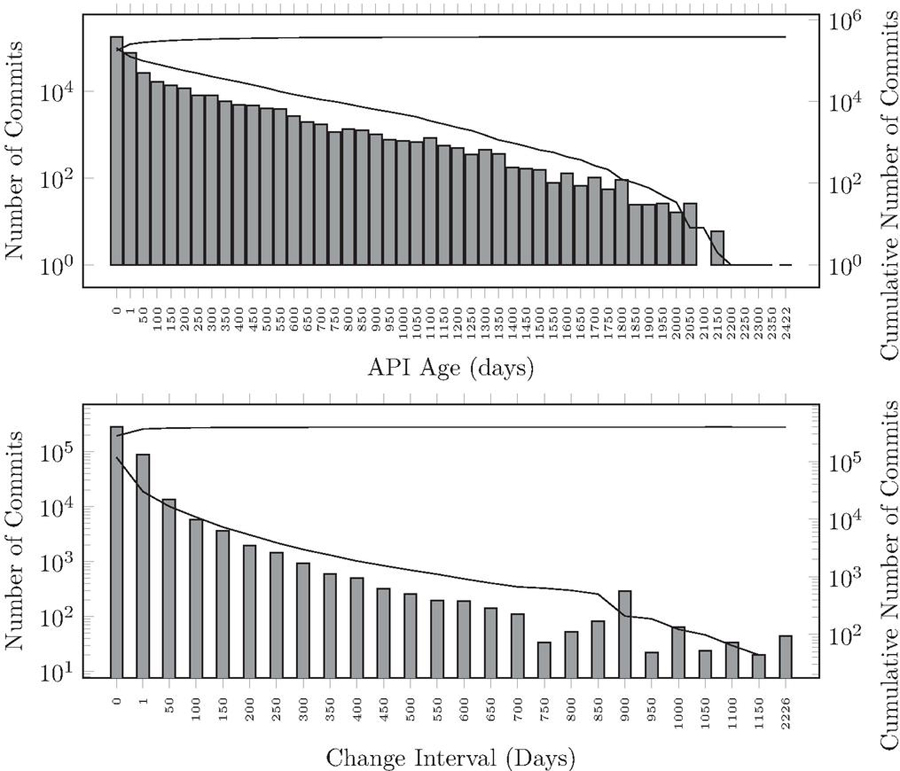
Figure 9 API age and change interval (log scale): how old are the APIs and how often do they change?
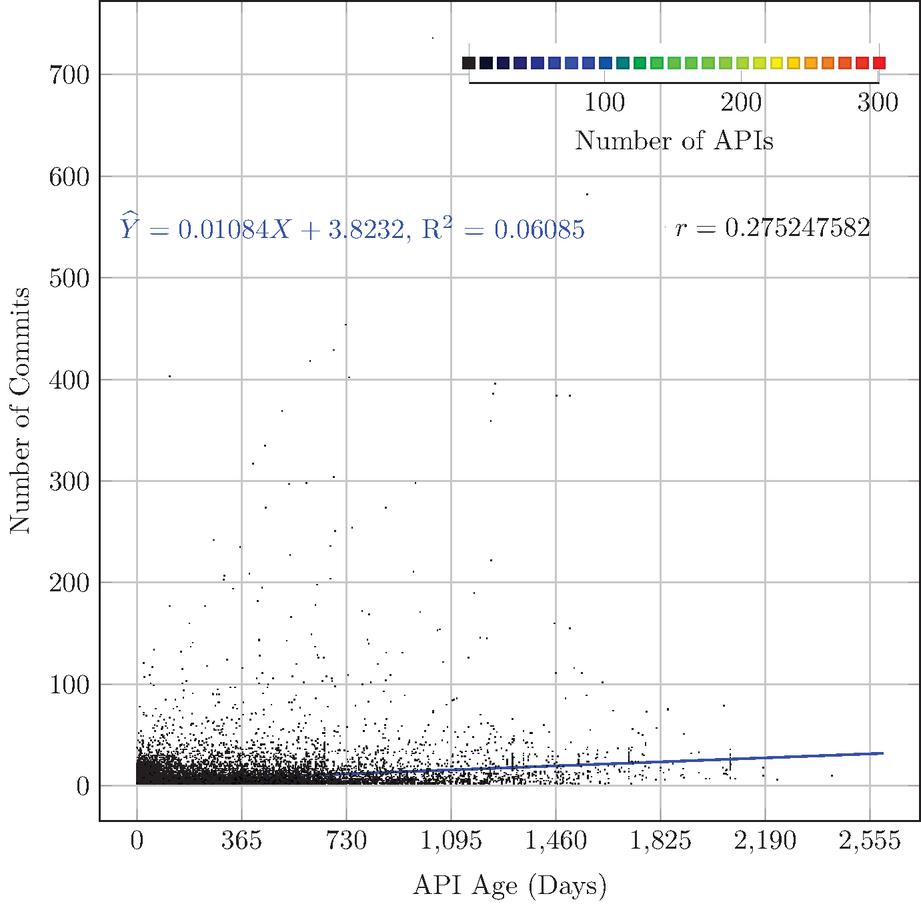
Figure 10 API age vs. number of commits: do older APIs have more commits in their history?
3.2 API Age
We define the age of APIs as the time interval between the last and the first commit of their histories.
| (1) |
where is the set of the commit timestamps for the as retrieved from the GitHub API metadata. We measure the API age in days.
In Figure 9 (top) we show the API age histogram. In Table 3 we count how many APIs reach one or more years of age. % of the APIs have only 1 commit (their age is 0). The lifespan of the ones with more than 1 commit reaches more than 5 years, making them potential interesting subjects for further studies. Table 3 also shows for each segment of APIs some statistics on the corresponding number of commits found in their history. We can see that the median and the average both tend to increase, although the exceptionally high (726) maximum number of commits is found in the API shown in Figure 31 (appendix) which is 2 years and 9 months old. This is confirmed by the linear regression model shown in Figure 10, indicating that although some of the younger APIs definitely have more commits in their history than the older ones, older APIs tend to have slighly more commits in their history. We show the detailed history of more long-lived APIs in the case studies of the Appendix.
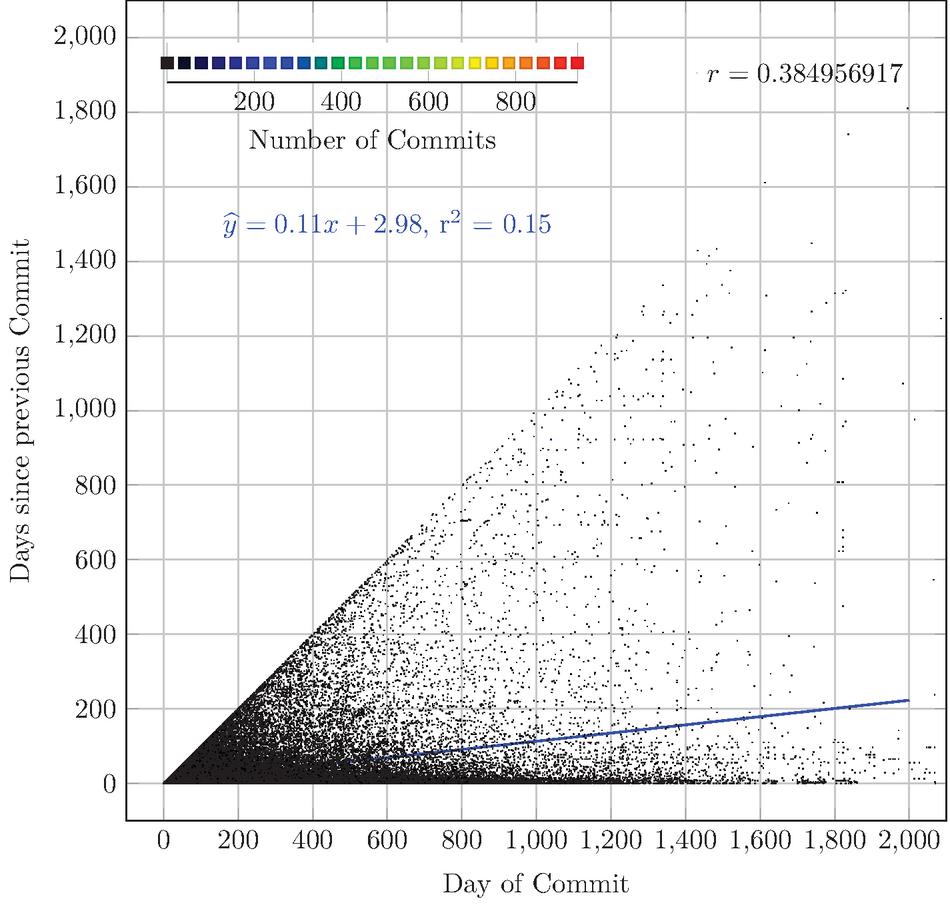
Figure 11 Likelihood of change: Do APIs change less often as they age?
3.3 Change Interval
We measure change interval , defined as the duration of the time interval between two consecutive commits, in order to study how often the API descriptions change.
| (2) |
where as before represents the timestamp of commit of the history of the given .
Figure 9 (bottom) shows, as expected, that many APIs tend to change their descriptions in the first part of their lives, even a lot of them in the same day (). While one could expect that for stable APIs, their API specification will be left untouched after releasing it, there are some APIs for which commits occur after a long period of inactivity, e.g., after leaving the API specification untouched for more than 3 years. This phenomenon is visible also in the gaps of the API age vs. Commit time plot (Figure 3).
Figure 11 describes how the age of the APIs could impact their likelihood to change their descriptions. We can observe that as APIs get older, they still tend to change rather often.
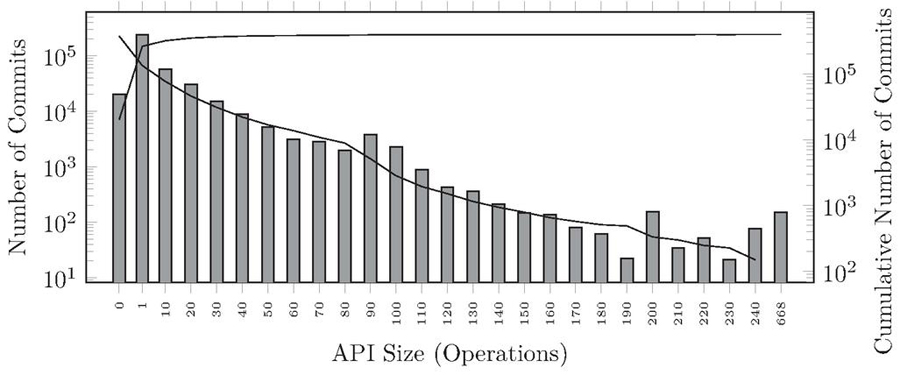
Figure 12 What is the distribution of the API size metric? Histogram over the API size of all commits (log scale).
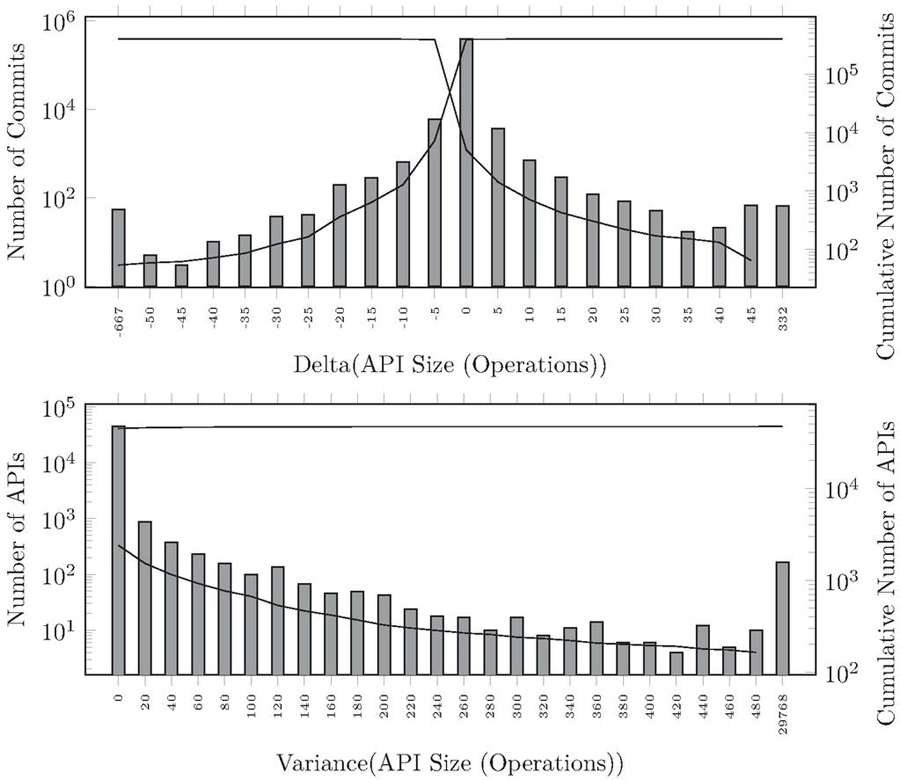
Figure 13 Do changing APIs always grow larger? API size variation of every commit and size variance of every API (log scale).
3.4 API Size Evolution: Do APIs Tend to Grow?
It’s interesting to observe when commits were pushed in APIs histories in order to understand how they tend to evolve in their lifetime and which development lifecycles could be involved into these evolution. While it is straightforward to analyze the commits time dimension, detecting and observing the changes they contains is more challenging but also more informative.
Figure 12 shows for all commits, the exponential distribution of the API size. We can see that tens of thousands commits do not contain any operations. As discussed in more detail in [35], these apparently empty artifacts are sometime used to represent data models with the OpenAPI variant of the JSON Schema language.
In order to study how the size of API changes, we report the variance of the number of operations compared with the commit history of every API in Figure 13 (bottom). We can note that % of APIs have a size variance of 0 over their commit history and the distribution ends with a tail of hundreds of APIs which have a considerable size variance.
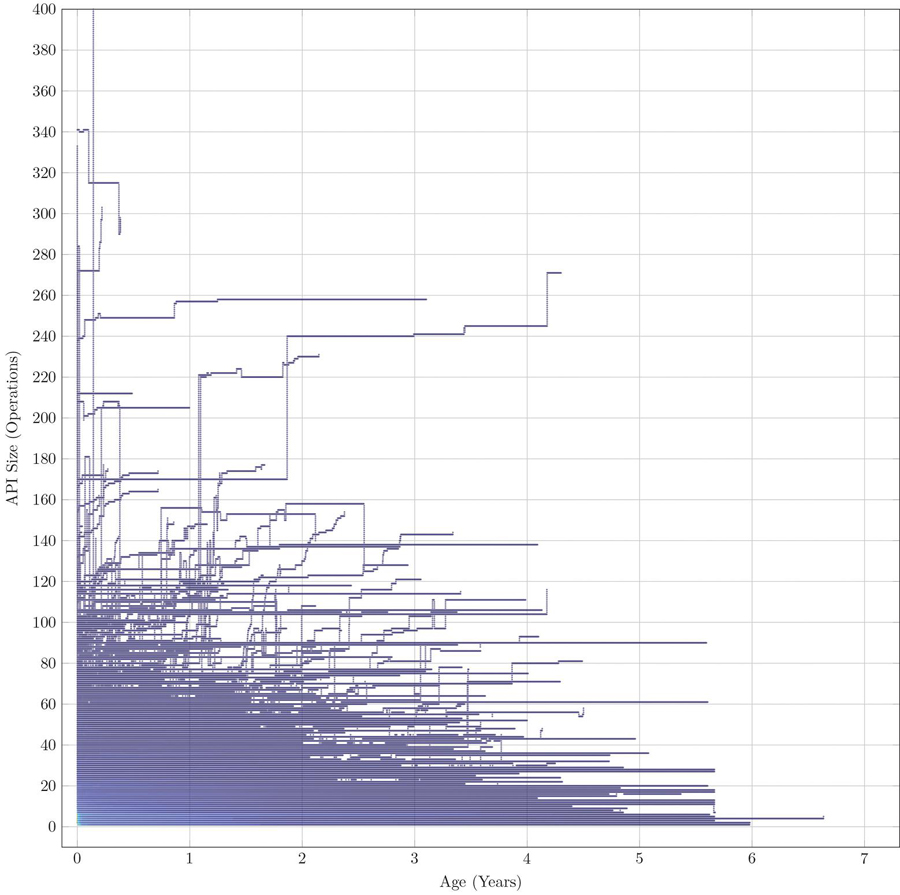
Figure 14 API size evolution overview. this visualization shows how the size of each API changes over time for all APIs having more than 10 commits.
The visualization of Figure 17 shows how the API size changes over time for all APIs with more than 10 commits. While we provided detailed visualizations of individual APIs in the case studies found in the Appendix, here we present an intentionally crowded visualization of the entire dataset comprised of thousands of APIs. In particular, it is possible to track over a period of 6 years how the size of individual APIs changes with every commit. The bottom left area shows that for the first 2 years, the API histories found in the dataset completely cover the possible evolution paths leading to a size up to 50 operations. Above that level and beyond that time it is possible to distinguish the trajectories of specific APIs. The visualization also includes many horizontal lines, representing APIs which grow old but whose commits do not change their size. The vertical lines instead indicate the presence of commits with a high variation of the API size.
3.4.1 Size Variation
We compute the variation – or – for each commit, as shown in Figure 12 (middle), defined as:
| (3) |
where and represent the API size in term of the number of operations found in the artifact of two consecutive commits , .
In Figure 13 (top) we compared all the computed variations against the number of commits. This distribution highlights that the vast majority of commits do not change the size. We use to measure how much APIs grow () or shrink after each commit .
In Figure 15 we can observe the absolute API size variations related to the time difference in days () between the corresponding commits. In Figure 16 we show a detailed view of the changes happening more often (up to 2 years delay). The two scatter plots show that the largest changes (both additions or removal of hundreds of operations) tend to happen in commits pushed in a relatively short timeframe.
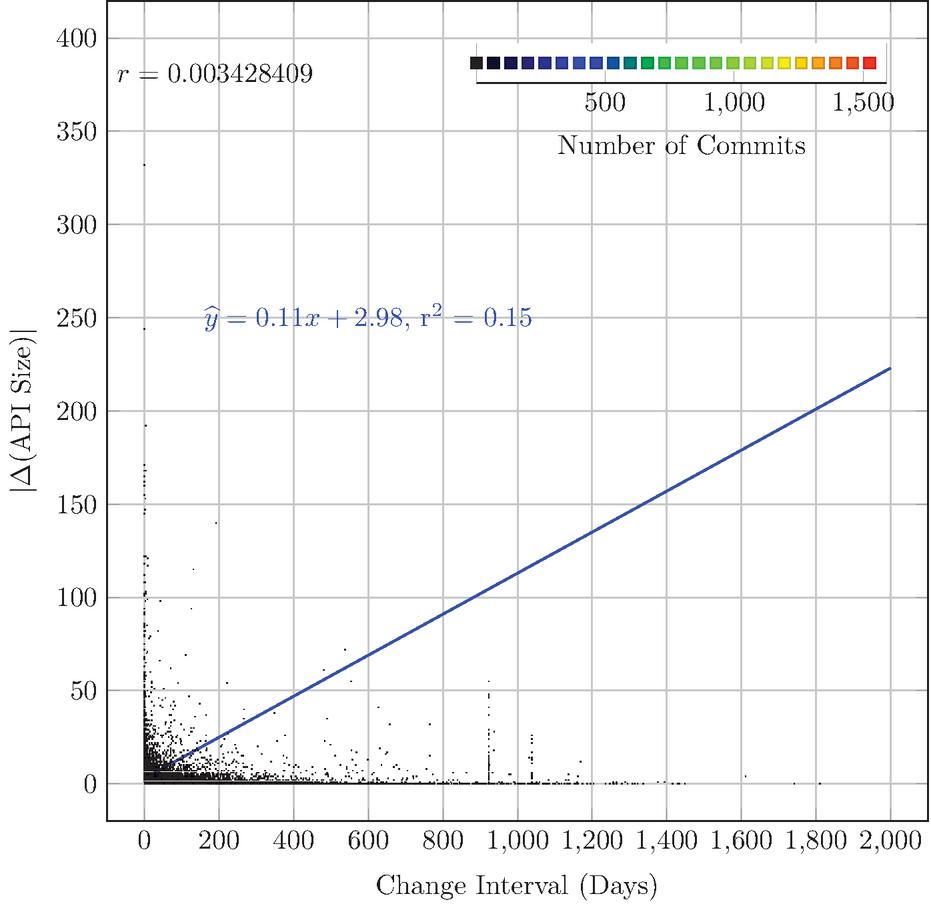
Figure 15 Speed of change: How much time does it take to grow or shrink the API?
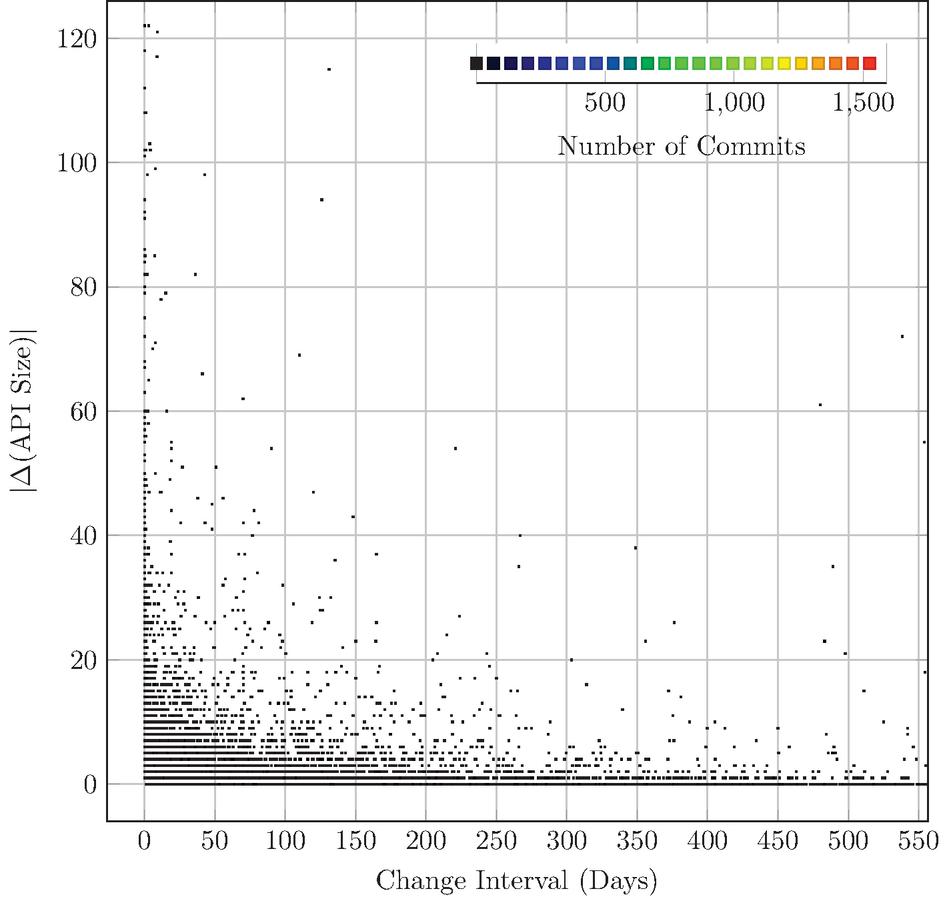
Figure 16 Speed of change: How much time does it take to grow or shrink the API? (like Figure 15, but zoomed to show frequent changes).
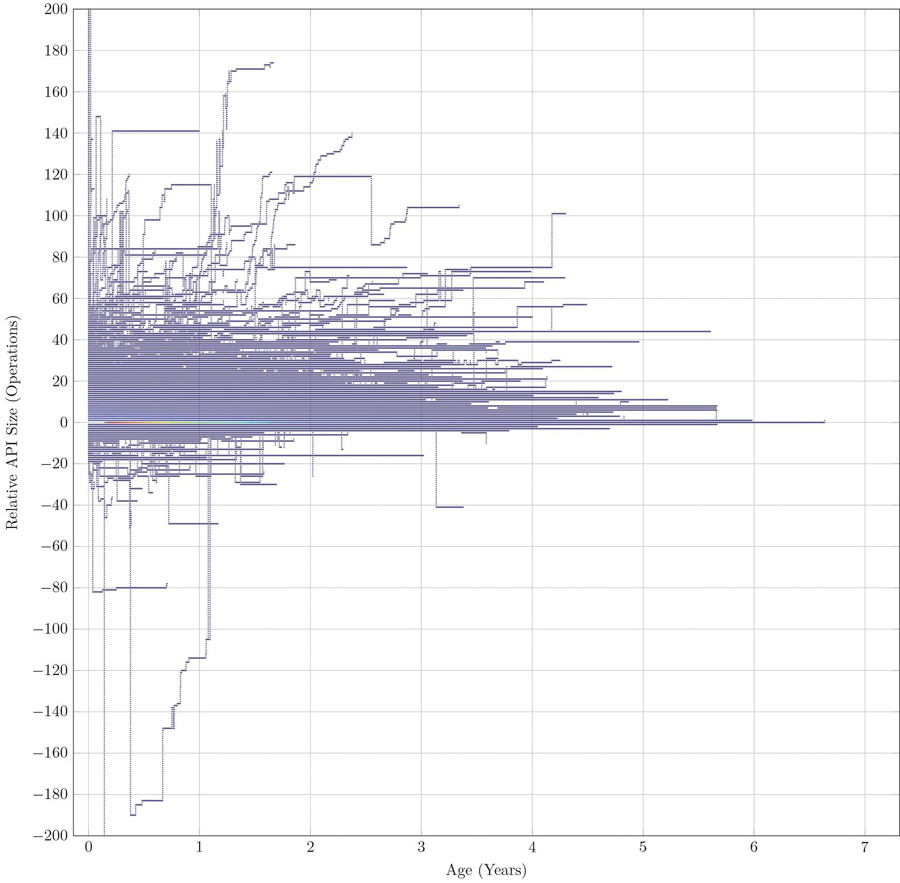
Figure 17 API Size Evolution Overview. For all APIs with more than 10 commits we plot their relative size over time. Positive values indicate that the API grows larger w.r.t. its initial commit. Each trajectory representing the history of a different API is interpolated holding the size of the previous commits until the next one. The colored dots on the horizontal axis highlight the many APIs whose size remains the same as the initial commit.
3.4.2 API Growth Speed
The instantaneous API growth speed
| (4) |
represents the speed in terms of variation of operations per unit of time (i.e., operations/day): a negative speed value indicates how rapidly an API has been shrinking (some operations were removed) and conversely, a positive speed value indicates how quickly the number of the API operations is growing.
APIs may change according to different patterns: some of them remain unchanged for months until multiple commits introduce or delete operations in a small amount of time, for example in the same day, and the other way around. These rapid changes cause a huge variations of the average computed on the entire history of every API. The high values shown in the tails of the distribution of Figure 18 are the direct consequences of the introduction of changes in the APIs, where the values have been amplified by the short amount of time (e.g., minutes) between the commits in which they were introduced.
We measured the speed at every commit (Figure 18) as well as aggregated it over the history of each API by measuring the total size variation defined below (Figure 19).
3.4.3 Total size variation
We also computed the total size variation of each API, measured by comparing the size of the last commit and the first commit of its history:
| (5) |
where is the last commit of the history of the given .
The histogram shown in Figure 19 shows a skewed distribution with more APIs having a positive total size variation up to +174 operations than the ones having a negative one. In the collection we found a very large API with 654 operations in its first commit, which will loose most of its operations as it evolves.
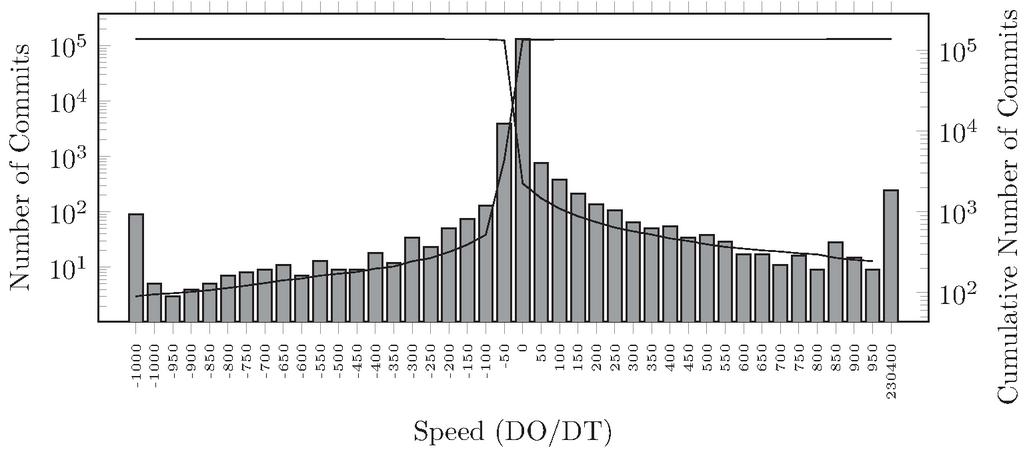
Figure 18 Speed of change distribution: operations/day (log scale).
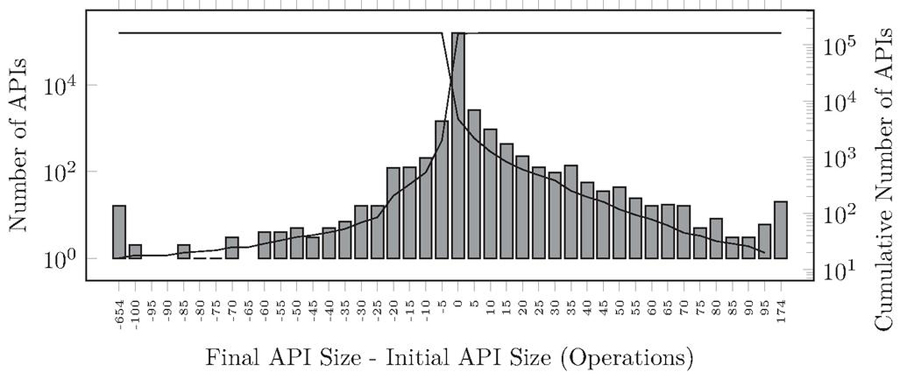
Figure 19 Total API size change (log scale).
If we further classify APIs in terms of whether they grow, shrink, or simply do not change, we obtain the groups shown in Table 4. The first table (a) counts how many APIs have grown larger or smaller over their entire histories. Here we see that 5% of the APIs shrink, while 37.6% grow. If we also consider changes occurring at every commit (b), we see that 55.8% of the APIs keep a constant size in all the commits of their history, 31.1% of them have a growing behaviour and 3.4% reduce their size constantly. Moreover, 9.7% of the APIs have a history with some commits increasing their size, and others reducing their size.
The visualization of Figure 17 shows how the API size, relative to the API initial size, changes over time for all APIs with more than 10 commits. All APIs begin their evolution at the origin (0,0) of the plot. Some will remain on the horizontal axis, these are the 16,019 ones which never change their size. The trajectory of the APIs which grow larger ends up above the X axis, this part of the visualization is rather crowded as most APIs tend to grow. The evolution of the APIs which reduce (permanently or temporarily) their size are visualized below the X axis.
Table 4 How many APIs, with more than two commits, grow or shrink their size?
| Size Change | # APIs | |
| None | 16,466 | % |
| Larger | 10,798 | % |
| Smaller | 1,448 | % |
| Total | 28,712 | |
| (a) Total API Change (Figure 19) | ||
| Size Change | # APIs | |
| None | 16019 | % |
| Growing | 8929 | % |
| Shrinking | 987 | % |
| Growing and Shrinking | 2,777 | % |
| Total | 28,712 | |
| (b) Commit API Size (Figure 12 middle) | ||
4 Discussion
Q1: How stable are API artifacts over time?
Among the APIs considered in this study, there are APIs that have more than one commit in their change history, with a maximum number of commits that reaches 736. We also found that of APIs are more than one year old. Even more, 263 of them have history spanning over more than four years. In 17 we can see that there is a case where the age exceeds six years of evolution. We can also see examples of APIs with a very particular size evaluations. Some only grow, or only shrink, and other grow and shrink. While there is big number of cases, which can be seen in the horizontal axis, where the size remain stable, despite having a high number of commits.
Q2: Do APIs tend to grow or shrink over time?
In this work we measure how the size of the APIs changes over time. By comparing the size of the APIs the moment of their birth and at the last commit, we found that in the case of of the subset of APIs having more than two commits in their change history, the size does not change. While of them grow, and become smaller.
More in details, during their lifetime, the type of evolution of the APIs changes from a commit to another. We found that of them grow in some commits and shrink in others, grow in all the commits and becomes smaller after each commit. However, we found that the size of of the APIs remains stable in all the commits.
This indicates a limitation of using the API structure size – simply defined as the number of operations – to summarize the changes occurring to the API. More metrics are needed to detect and assess the impact of changes on other components of the API description.
Q3: Does the frequency of change of an API depend on its age? By looking at the APIs ages in function of number of commits, we can clearly see in Figures 3 and 10 that the density of commits reduces significantly as the APIs ages. This can be also seen from Figure 17, which shows how the evolution trajectory of many of the APIs gets flatter as the API ages.
By computing the period of time until a new commit occurs and plotting it in Figure 11 against the time of the current commit, we also see that the change interval has a slight tendency to grow with the API age (correlation 0.38).
Q4: Is the API commit history length proportional to the API age?
Among the studied APIs we found that the API having the longest change history (up to 2605.28 days) have less than 10 commits. While the one having the highest number of commits is 1031.34 days old.
We can see from Table 3 that APIs having the maximum number of commits in the segments of APIs that are more that three years old is less than the maximum number of commits of an API in the group of APIs that are less than 3 years old. However, overall, the medians and averages of the number of commits of all the APIs shows that in the majority of the cases, the number of commits increases as the API ages. This is also confirmed by the correlation value of 0.27 and the linear model shown in Figure 10.
Q5: What is the distribution of the API size metric?
The range of sizes of the APIs in their different evolution phases goes from 0 in the case of some commits of some APIs, up to 668 operations. The histogram of Figure 12 (top) shows an exponential distribution, with various peaks (e.g., 90 operations, but also 200 operations).
We also tracked the size change from the first commit to the last one for each API. We found cases where the API ends up with 174 operations added, while others shrink losing more than 600 operations at the time of the last commit (Figure 19).
As a limitation of our work we measured the size of each description in a specific commit independently as we currently did not study the commits according to the specific API history they belong to.
Q7: How often APIs update the version of the specification language used to describe them?
Given the large number of years over which the artifacts have been pushed to GitHub, we also verify how often do APIs change the version of the modelling language used to describe them. We found that in the high majority of the cases () the OpenAPI versions remains stable during the entire lifetime of the API. Only in some very few cases ( APIs) the developers updated the OAS version
Is it possible to find – by crawling public repositories – enough machine-readable API descriptions suitable to study how Web APIs evolve over large periods of time? In this paper, we have shown that thanks to the growing adoption of the OpenAPI specification language, a sample of 875 APIs with a history of more than 2 commits can be found on GitHub.
We could also find many more API description artifacts (1322) without a commit history of significant length. While these are still interesting to analyze for synchronic studies, it remains to be seen whether developers pushed only a single commit because their APIs were committed only when stable, or we have crawled repositories of projects which never went beyond the first commit.
By analyzing basic artifact metadata (such as commit timestamps and version identifiers) we have begun to trace, measure and classify changes on APIs during their lifetime. For example, we have shown that the frequency of change of APIs is not dependent on the age of the API.
Likewise, different API developers follow different versioning practices, ranging from version identifiers incremented every other commit (like in the OpenStorage SDK shown in Figure fig:evolution-history-ex.b) to API histories with only a few explicitly identified versions over hundreds of commits. We also found examples in which the title of the API itself would change, although the OAS document used to describe it would remain the same.
Regarding the evolution of the API content, in this paper, we have focused on one possible API size metric, which has allowed us to detect changes for more than half of the APIs in the collection. We certainly need a more in-depth analysis of API artifacts to detect and measure changes beyond the length of the resource operations, not only to distinguish whether existing operations are renamed but also to spot changes in parameters, responses and schema definitions. Still, by only looking at the size we could show that the majority of the APIs in our sample, which changed their size, have a tendency to grow larger over time.
4.1 Threats to Validity
4.1.1 Selection bias
This empirical study is based on API descriptions written in the OpenAPI interface description language rather than the software itself. Which makes the results bound by how realistic are the models we are involving in this study. Moreover, we include in our dataset models which may not always representing API currently in use by some clients. They might be just prototypes or examples, or descriptions used for other purposes, such as code generation. Further classification and filtering heuristics are needed to extract the subset of real-world APIs which are used in production.
4.1.2 Sampling bias
Our dataset might be including descriptions retrieved from repositories forked several times. Which means that we might be considering some changes histories as linear and independent ones, while in reality, they belong to the same API.
5 Related Work
5.1 Software Evolution
Recent works [32, 22] tried to evaluate and find solutions for the challenges of software evolution [29], and its impact on software ecosystems, such as dynamic software product lines [34].
Other studies of software evolution evaluate the maintainability of different systems. In this direction, [9] used a number of metrics to quantify dominance in calls relations starting from the assumption that when more complex relations are present within a source code module so it will be harder for an application to be maintained. Their results seems to indicate that dominance relations do reflect some principles of code maintainability [9]. [15] defined a framework to understand the conceptual changes in an evolving system and measuring them they were able to relate their observations to the types of maintenance performed [15]. Considering change effects, impact analysis approaches [6, 10, 27] attempt to determine all possible points in the code that are dependent to a given “seed” point, involved in a modification task, in order to predict what software parts affect each other. [42] applied data mining to version histories in order to point out to programmers how some changes are related to each other [42].
5.2 API Evolution
API Evolution has also been empirically studied in software engineering [21, 24]. For example, [20] presented a large-scale study of change propagation within the Pharo ecosystem. In the same direction, the authors of [19] designed APIEvolutionMiner: a tool to extract rules by monitoring APIs changes during their evolution. This tool mines changes using deltas from revisions contained in histories and produces rules to indicate how method calls should be replaced. In our empirical study, we observe Web APIs changes based on comparing different versions of their textual documentation written in OpenAPI Specification.
In [23] the authors identify and classify the most frequent changes that happen to APIs and how these changes could be reflected in the documentation, release notes, issue tracker and API usage logs.
There are also more focused works that target a specific type of software, such as Android applications. In [7] the authors conducted a study on 5,848 free Android application selected from the Google Play Market. Following our same approach for data collection, the authors built a Crawler downloading free Android apps. The crawler was run for one week and resulted a collection of 25,869 apps, out of which they filtered only apps having at least 10 votes to prune out unreliable ratings, and also apps having their Android PacKage (APK) file that is convertible into a JAR. The goal of this study is to analyze how the ratings that an app had received are correlated with the fault- and change-proneness of the APIs such app relied upon. The study included also the result of a survey that involved 45 professional Android developers and showed that according to most of them, there is a direct relationship between problems experienced with the adopted APIs and the users’ ratings that their apps received.
Several quantitative analysis show that software artifacts evolve over time and that the evolution of their content is not necessarily linear [29, 28]. Which means their size and complexity are not necessarily increasing with time.
5.3 Web API Evolution
At the ICWE2021 conference we presented a feasibility study [26] where we consider the size of an API as a metric to detect changes in the API. In this work, we increased the size of our study dataset by collecting more up-to-date commit histories of more APIs descriptions from open-source repositories (See Table 1) and providing additional visualizations (Figures 4, 3).
Several research studies are trying to predict how the Web API systems could potentially evolve in time [30, 11, 19, 38, 13]. In [13], the authors studied the impact of the evolution of Web APIs through interviews with six developers involved in this process. They also investigated how major service providers organize the evolution of their APIs and how changes can impact clients’ applications. While [13] focused on the impact of Web APIs evolution on the clients, the authors of [38] focus on the difficulties developers face to upgrade their client applications as a consequence of the API evolution of their dependencies. The authors also investigated how RESTful Web API evolve analyzing subsequent changes in different software versions. A taxonomy of breaking and non-breaking Web API changes has been presented by [25], which we plan to use as the next step to check how often each type of change occurs in practice.
Other works aimed at proposing solutions for handling the problems that both clients and developers can face because of their Web APIs evolution. For that purpose, the authors of [11] proposed to use refactoring tools to mitigate the impact of some types of API changes. In [4] the authors propose a data-driven approach to enhance processes of APIs creation and evolution. They have analyzed how to use data gathered from APIs usage and developers in order to build indicators, usable as references, to plan the development of the next releases. Also in [12] the authors addressed challenges related to the co-evolution of APIs and their clients. They analyzed already-built artifacts in order to obtain API access points and relate their usage to clients’ behavior.
5.4 Empirical Studies in Web API Analytics
One large empirical study is [39], which studied GraphQL [8, 16] APIs by analyzing 16 commercial GraphQL schemas and 8,399 GraphQL schemas mined from GitHub projects. One of the data points selection criteria adopted by the authors is to have a API description written in the Schema Description Language (SDL). This empirical study doesn’t take into account the time dimension, and analyze all the APIs in their latest at the time of the paper’s writing. Same as [36] where the authors perform a specification based empirical study on 6619 API collected from Github. The analysis was performed on the OpenAPI description, and resulted in the extraction of four structural pattern primitives with different variants, in addition to a set of detected smells related to each pattern primitive.
[17, 18] are works that focuses on the structure of Web APIs. Their analysis starts also from API descriptions written in OpenAPI. Such as ours, the analysis performed in [17, 18] is based on metrics related to the API structure, such as the size (number of resources), number of read-only resources, number of POST and DELETE operations, number of root resources, number of links, and the number of components and their size. We plan to analyze how all such metrics evolve over time using our historical API collection as future work.
While the authors of [17, 18] perform a structural analysis of a small but curated Web API collection, in [35] the authors define additional API size metrics to measure some characteristics of Web API data models such as the number of schemas composing the data model, their usage and reuse across the same data model. They detected a medium correlation between the data model size and the size of the API structure. This opens up the question of whether the co-evolution between API operations and its data model can be observed in the dataset presented in this paper.
6 Conclusions
Web APIs are a pillar of distributed software architectures: they are the interface that makes it possible to use the Web to communicate between a system’s backend and frontend components. Managing their evolution can be very challenging because of the critical role they play and the long periods of time during which they need to be maintained. This task should be carefully planned and executed to avoid the breakage of a large number of clients, and avoid or limit the damage that can be caused by the API change. To build empirical knowledge about how real-world Web APIs actually evolve, we collected a very large dataset of API specification from public repositories available on GitHub, and fetched all their revision history. Using this dataset, in this paper we analyzed the evolution of Web API structures over time.
This study is an extension of a previous feasibility study, presented at the ICWE conference [26] in May, 2021, where we apply the same approach on a larger input dataset with a total of 395,219 commits (see Table 1 for a comparison of the two datasets and the main results of each study). To make the results comparable, we kept the same definition of the size metric, which consists on the total number of the operations found in each OAS artifact. We measured different change granularities, from fine-grained commits to coarse-grained version identifier changes. While more than the 71% of the APIs present only one commit in their histories, we selected, analyzed and visualized the history of a collection of 5,176 APIs with more than 10 commits. We analyzed also the time dimension of commit histories and trying to correlate the age of APIs with their change frequency. We were able to confirm the same observation done in our previous work: if APIs change size, they mostly tend to do so by growing over time (Table 4). We observed also how the APIs and their histories distribute themselves in time (Table 3) and whether different OpenAPI/Swagger versions are scattered over those histories (Table 2).
7 Future Work
As future work, we plan to dig deeper in the change granularity by introducing more metrics to detect changes related to the complexity, the HTTP methods and the data model (JSON Schema) of the APIs over time. Based on these metrics we will define refined heuristics to classify the reoccurring change types. The goal is to be able to empirically identify the most common Web API evolution patterns that are more likely to happen during the lifetime of any APIs. Additionally, we will also mine anti-patterns by detecting changes that developers mistakenly introduce and then correct in their APIs before they lead to clients breakage.
Acknowledgements
This work is funded by the SNSF, with the API-ACE project nr. 184692.
Appendix: Web API Evolution case studies
We selected some particular cases from the dataset considered for this study, showing different evolution histories in terms of the API size, and visualize them from Fig 20 to 31.
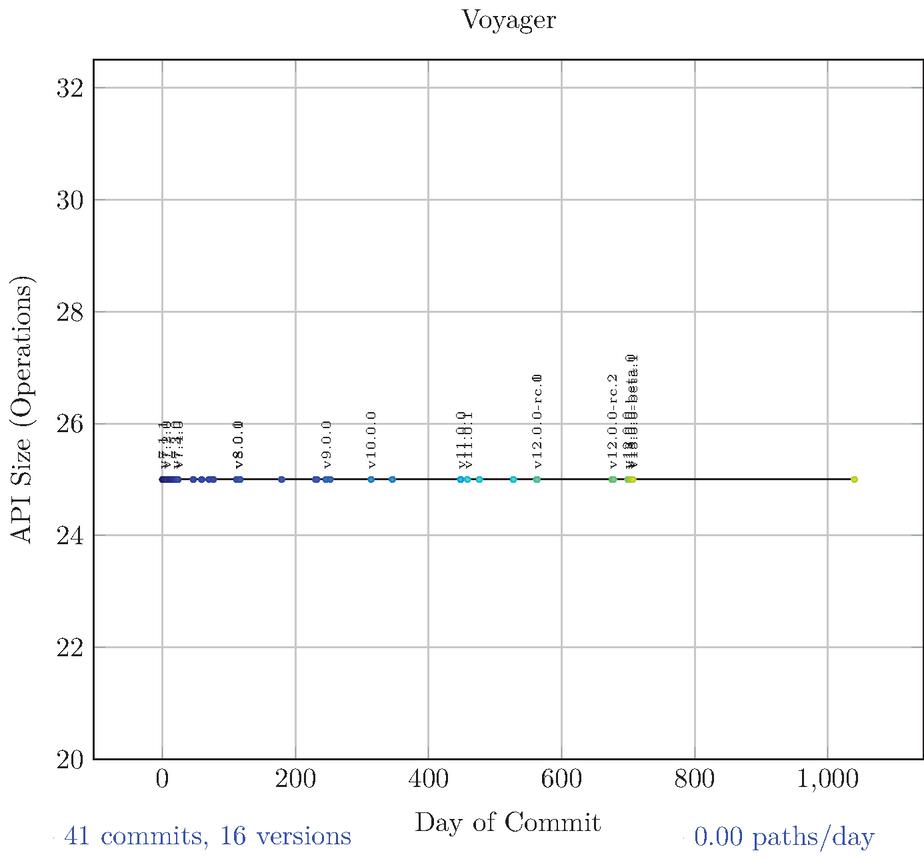
Figure 20 API evolution histories example: voyager.
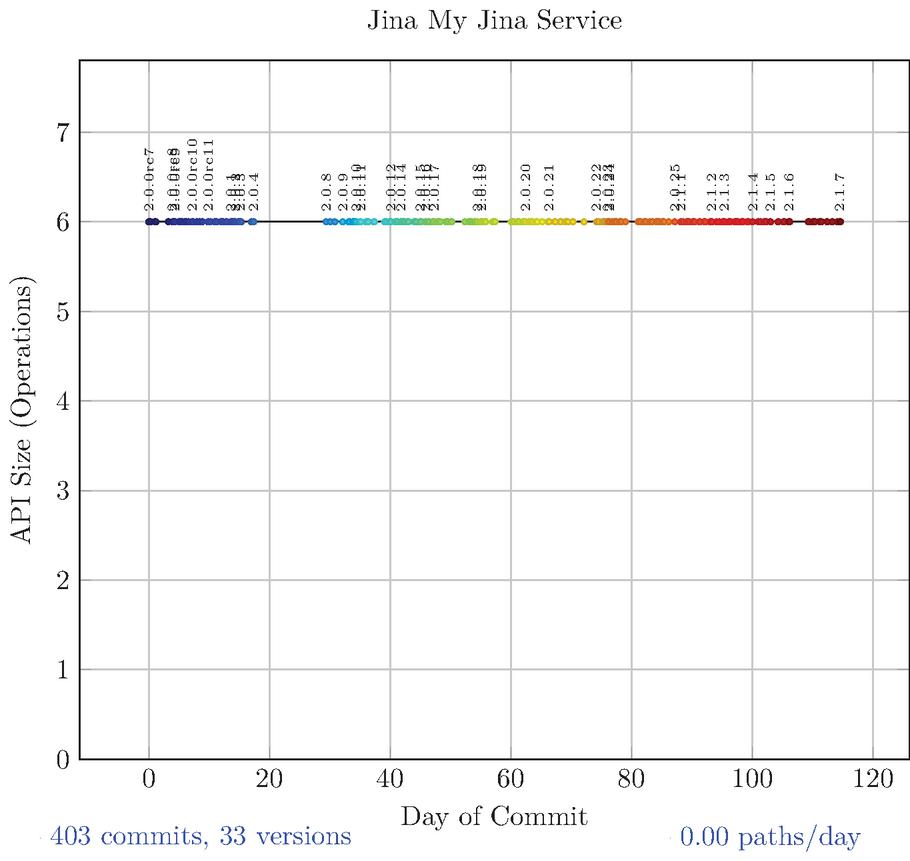
Figure 21 API evolution histories example: my Jina service.
In the Voyager case study, shown in Figure 20, we detected 41 commits and 16 unique versions. Despite the commits and progressive versions found in its artifacts (6 major and 8 minor version upgrades), this API doesn’t change size during its lifetime, pointing out the need to use different metrics in order to detect its changes. The same behaviour is shown by Jina Service (Figure 21) where 33 versions are introduced across 403 commits.
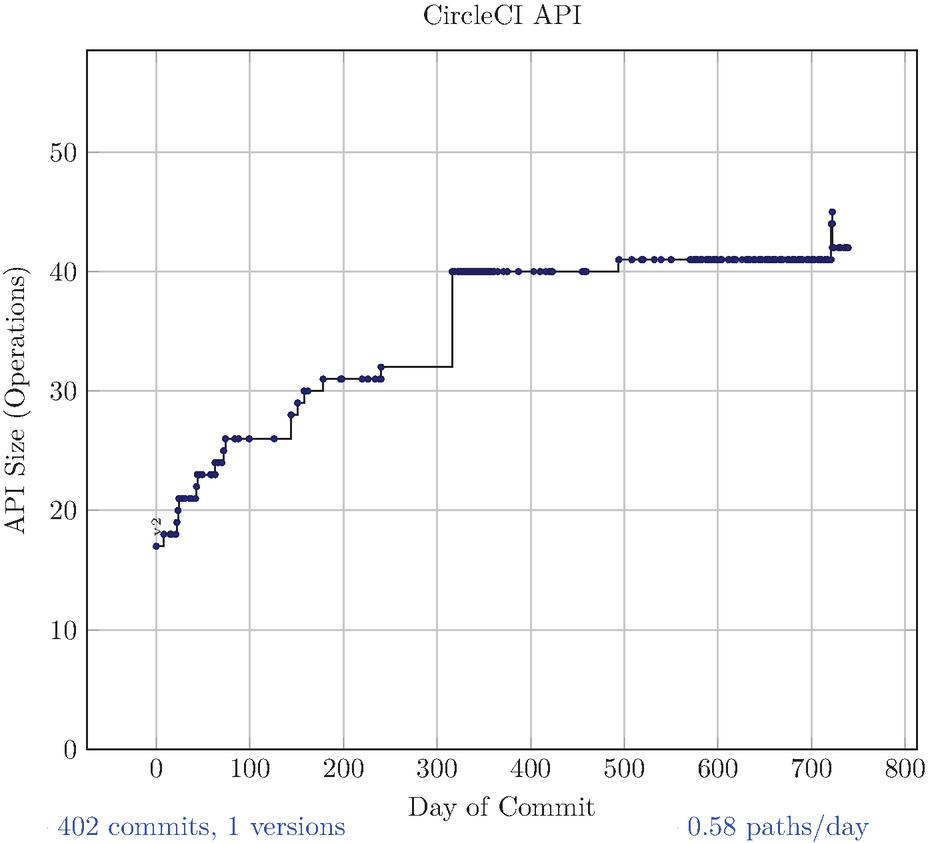
Figure 22 API evolution histories example: circle CI API.
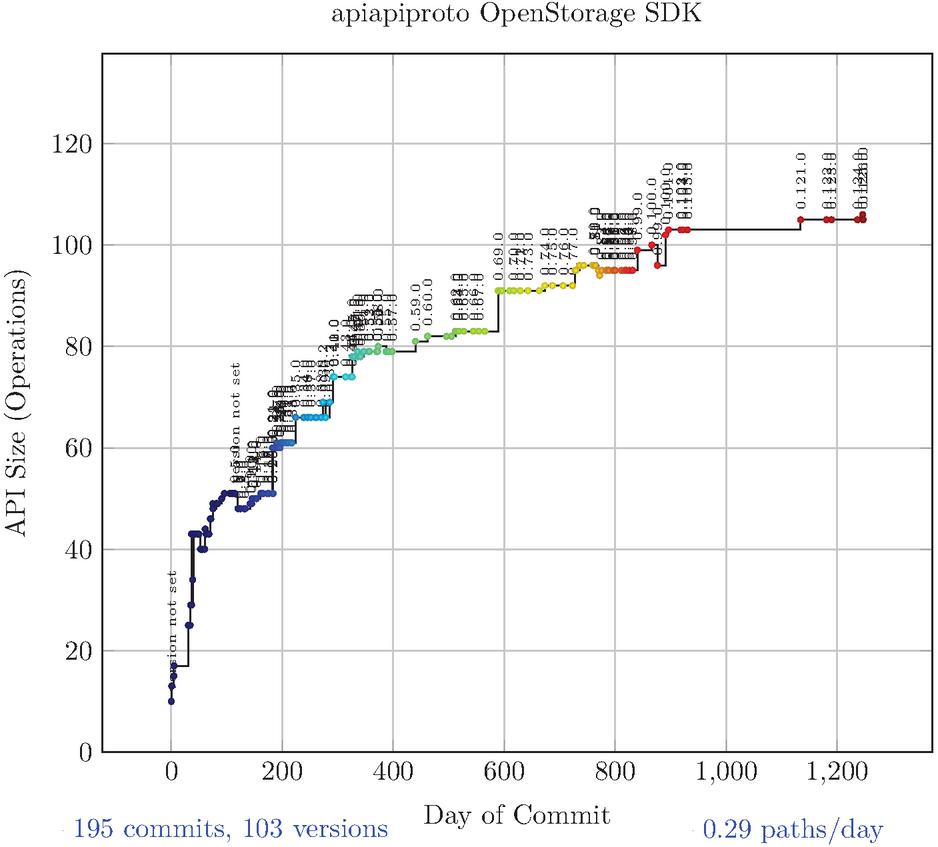
Figure 23 API evolution histories example: apiapiproto OpenStorage SDK.
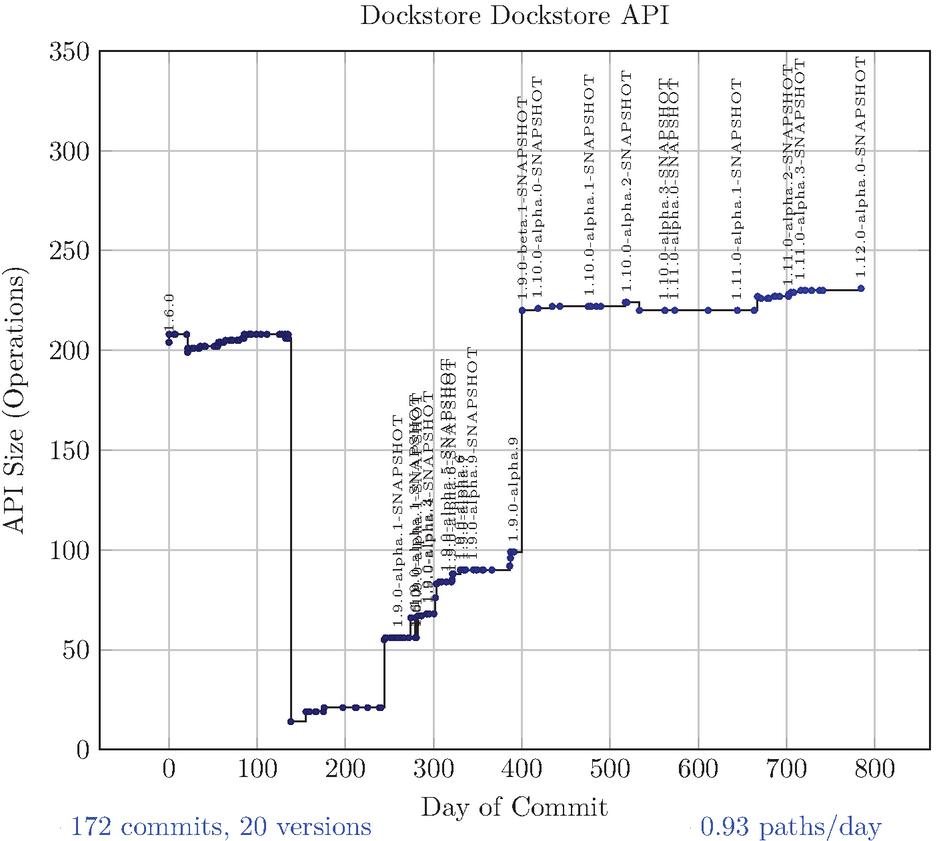
Figure 24 API evolution histories example: dockstore dockstore API.
The OpenStorage SDK case 23 has a growing behaviour where additions are introduced almost at every commit for a total of 103 versions added across 195 commits. A similar growth, which steadily grow all the time, is shown in Figure 27, where 70 versions are distributed across 126 commits in less than 2 years and in Figure 22 with only one version – defined at the beginning of the project’s life – kept until the last commit available.
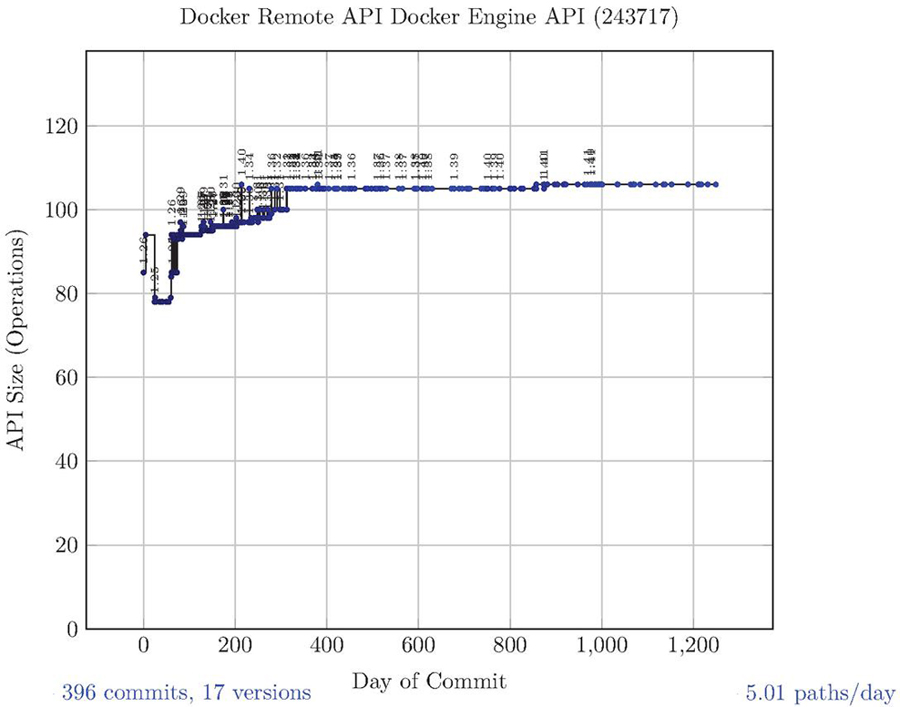
Figure 25 API evolution histories example: docker remote API, docker engine API.
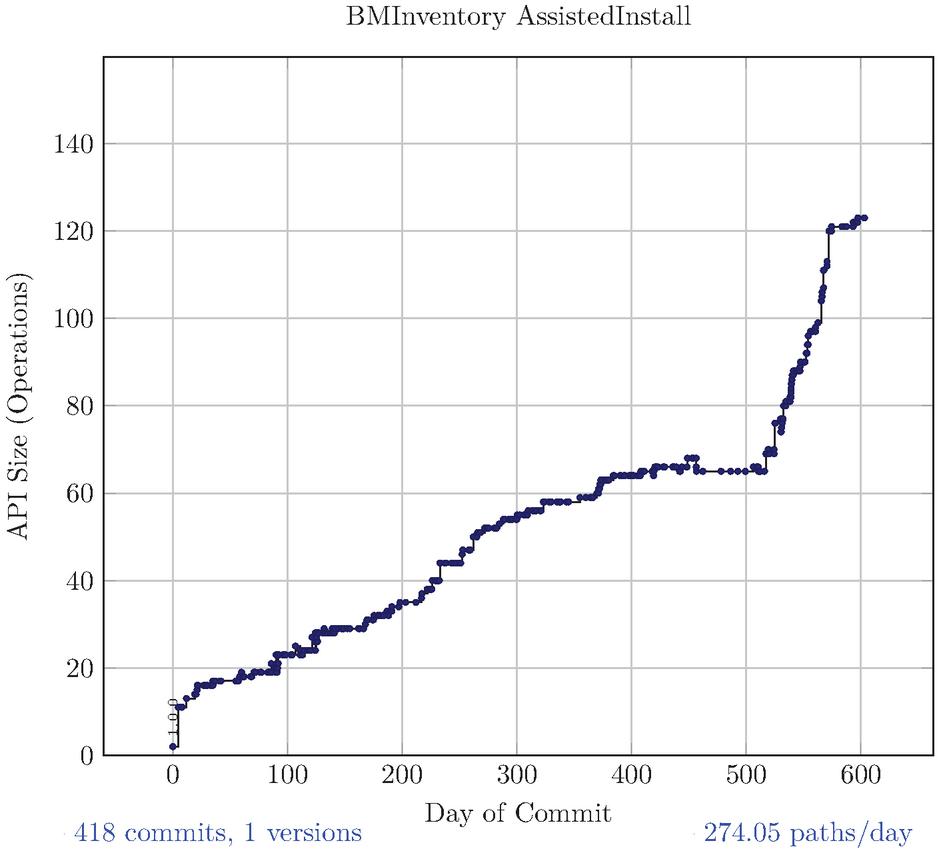
Figure 26 API evolution histories example: BMInventory AssistedInstall.
Also BMInventory AssistedInstall (Figure 26) presents a growing behaviour with only one version introduced at the beginning and kept for less than two years, across 418 different commits. This case study is one of the few which allows to follow the growth of a relatively large API (with more than 120 operations) since its inception two years before (one operation on the first commit).
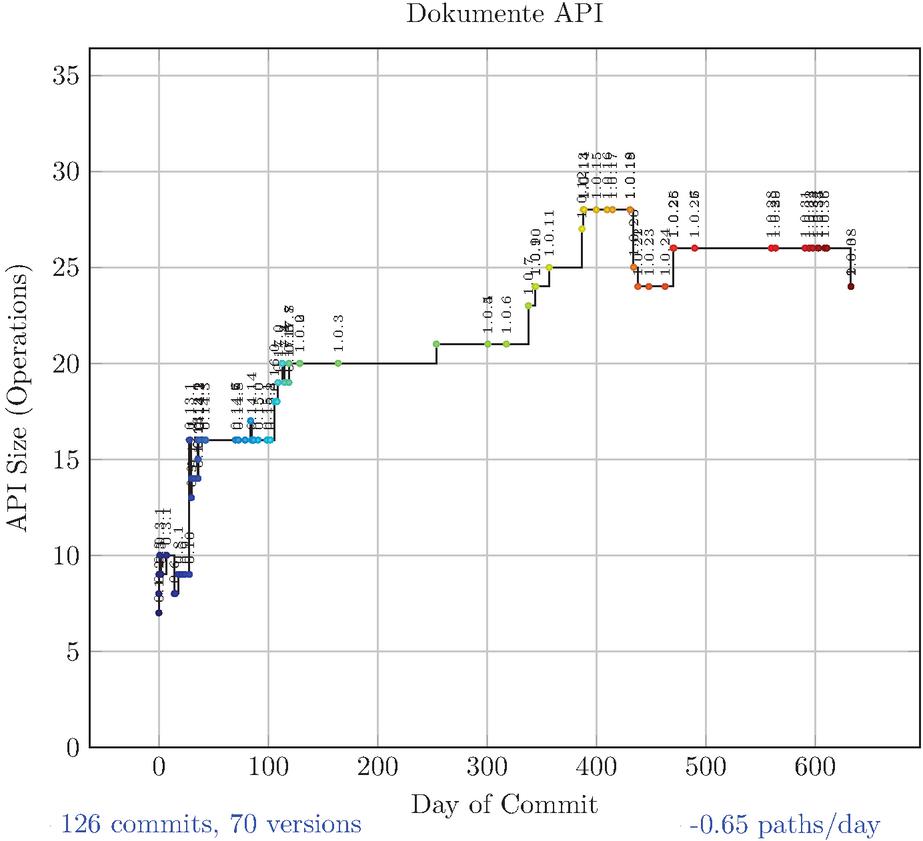
Figure 27 API evolution histories example: dokumente API.
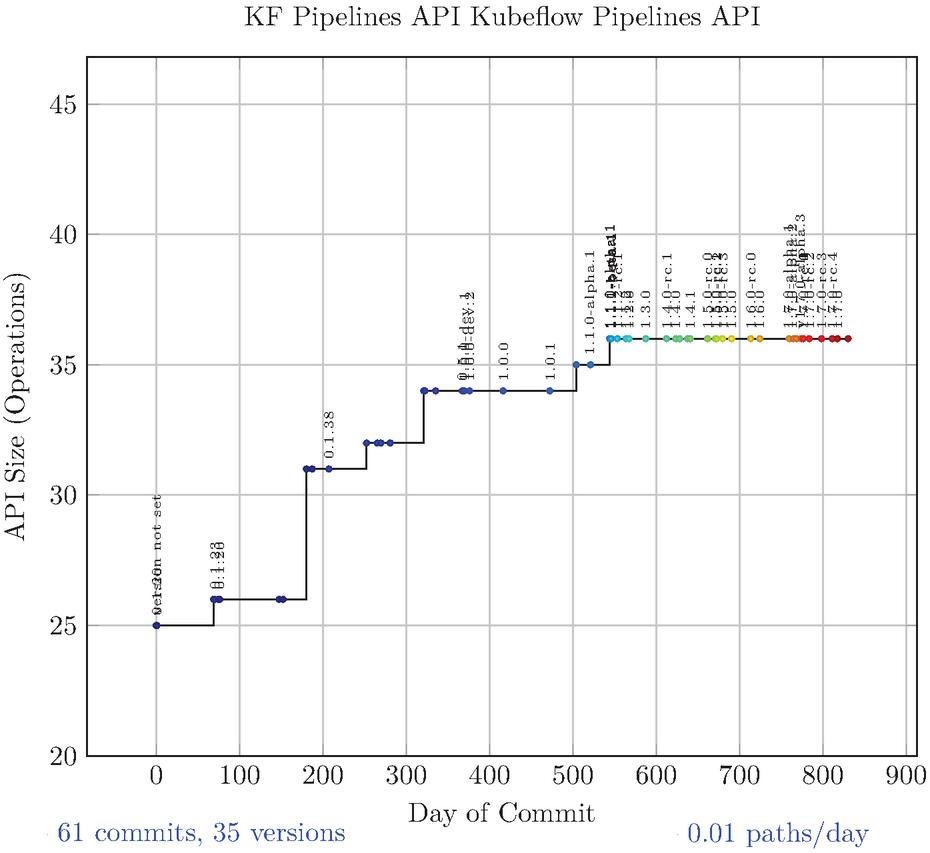
Figure 28 API evolution histories example: KF pipelines API kubeflow pipelines API.
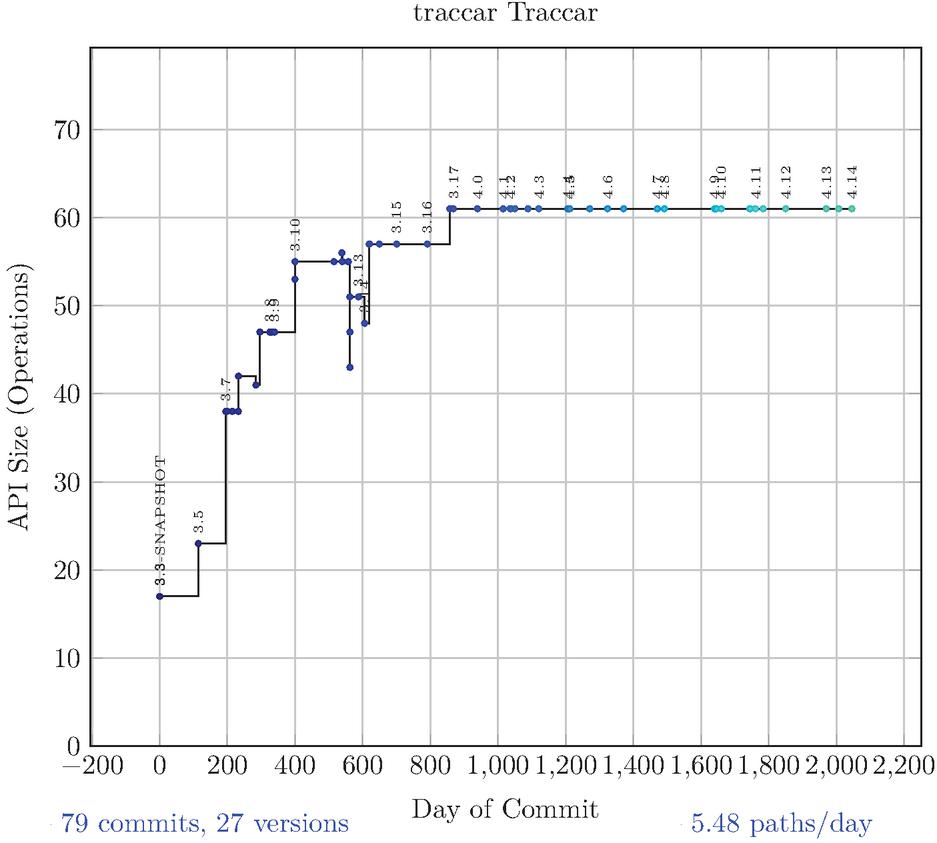
Figure 29 API evolution histories example: traccar traccar.
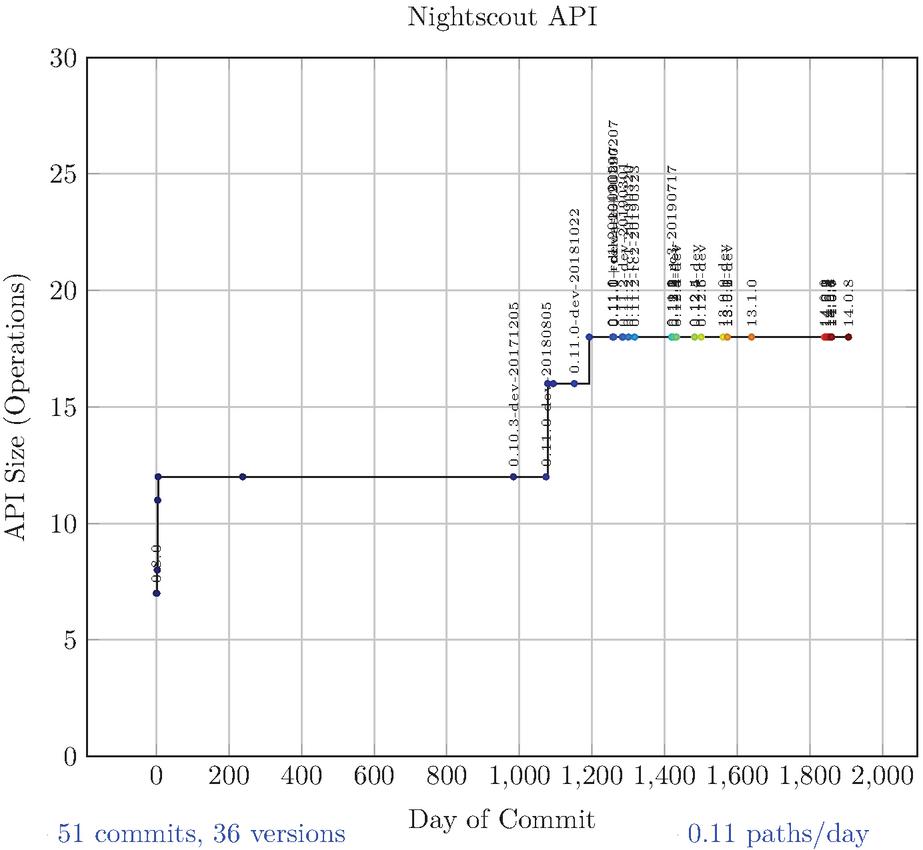
Figure 30 API evolution histories example: nightscout API.
Nightscout API, shown in Figure 30, instead shows a considerable variation at age 0, later followed by a zero-variance period and again, between days 1,000 and 1,200, another rapid growth, later followed with no variations in size but with an increased density of versions addition until the end of its life.
Dockstore API (Figure 24) both grows and shrinks over its history of 172 commits over more than 2 years. The final size is relative small while size variations shown in its history are characterized by rapid changes in deletion (almost 200 operations) and later in addition (more than 100 operations).
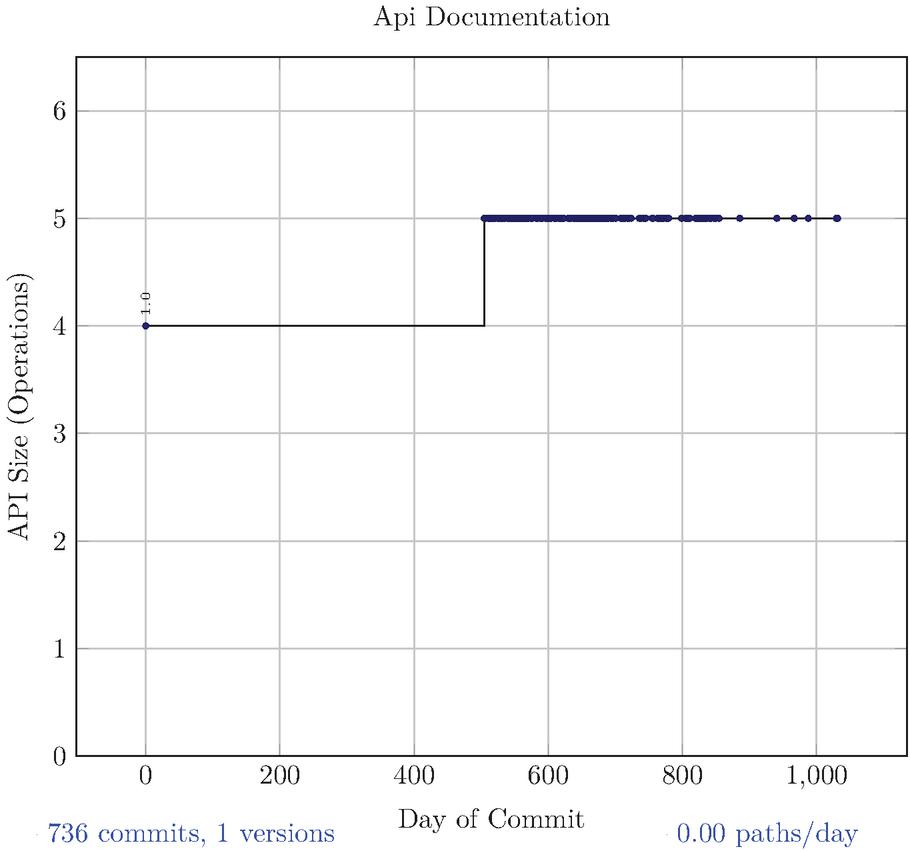
Figure 31 API evolution histories example: Api documentation. This anonymouos API has the highest number of commits in the dataset.
In Figure 25 we can observe the Docker Remote Engine API which shows 17 versions, introduced in more than 3 years, across 396 commits. There we can note a relative high growth in almost the first 300 days, while from that point to the end the evolution is characterized by few additions.
A mixed growth-and-flat behavior is detected in Traccar API (Figure 29 in which the first part of is life is characterized by an high speed growth (more than 40 operations added), with some quick deletions, while in the next part of its evolution it changed its behaviour as a flat one (with the presence of version variations), similarly to Figure 20.
The last case is shown Figure 31. This is the API with the most commits in the entire collection. After the initial jump, the size remains constant over almost 3 years of changes. Also in this case, the version remains fixed at 1.0.
References
[1] OpenAPI Initiative. https://www.openapis.org/. Accessed: 2020-12-30.
[2] Prance. https://pypi.org/project/prance/. Accessed: 2020-12-28.
[3] open-api-spec-validator. https://github.com/p1c2u/openapi-spec-validator. Accessed: 2020-12-29.
[4] Alberto Abelló, Claudia P. Ayala, Carles Farré, Cristina Gómez, Marc Oriol, and Oscar Romero. A data-driven approach to improve the process of data-intensive API creation and evolution. In Proc. of the Forum and Doctoral Consortium Papers Presented at CAiSE, volume 1848, pages 1–8. CEUR-WS.org, 2017.
[5] Gámez-Díaz Antonio, Fernandez Pablo, and Antonio Ruiz-Cortés. An analysis of restful apis offerings in the industry. In Proc. International Conference on Service-Oriented Computing (ICSOC), pages 589–604, 2017.
[6] R. Arnold. Software change impact analysis. 1996.
[7] Gabriele Bavota, Mario Linares-Vasquez, Carlos Eduardo Bernal-Cardenas, Massimiliano Di Penta, Rocco Oliveto, and Denys Poshyvanyk. The impact of api change-and fault-proneness on the user ratings of android apps. IEEE Transactions on Software Engineering, 41(4):384–407, 2014.
[8] Gleison Brito and Marco Tulio Valente. REST vs GraphQL: A Controlled Experiment. In 2020 IEEE International Conference on Software Architecture (ICSA), pages 81–91. IEEE, mar 2020.
[9] E. Burd and M. Munro. An initial approach towards measuring and characterising software evolution. In Sixth Working Conference on Reverse Engineering (Cat. No.PR00303), pages 168–174, 1999.
[10] A. Cimitile, A.R. Fasolino, and G. Visaggio. A software model for impact analysis: a validation experiment. In Sixth Working Conference on Reverse Engineering (Cat. No.PR00303), pages 212–222, 1999.
[11] Danny Dig and Ralph Johnson. How do apis evolve? a story of refactoring. Journal of software maintenance and evolution: Research and Practice, 18(2):83–107, 2006.
[12] Anna Maria Eilertsen and Anya Helene Bagge. Exploring api/client co-evolution. In 2nd IEEE/ACM International Workshop on API Usage and Evolution (WAPI@ICSE), pages 10–13, 2018.
[13] Tiago Espinha, Andy Zaidman, and Hans-Gerhard Gross. Web api growing pains: Stories from client developers and their code. In Proc. IEEE Conference on Software Maintenance, Reengineering, and Reverse Engineering (CSMR-WCRE). IEEE, 2014.
[14] Roy Thomas Fielding. REST: Architectural Styles and the Design of Network-based Software Architectures. Doctoral dissertation, University of California, Irvine, 2000.
[15] Nicolas Gold and Andrew Mohan. A framework for understanding conceptual changes in evolving source code. In Proceedings of the International Conference on Software Maintenance, ICSM ’03, page 431, USA, 2003. IEEE Computer Society.
[16] Olaf Hartig and Jorge Pérez. Semantics and complexity of GraphQL. In Proc. World Wide Web Conference, pages 1155–1164, 2018.
[17] Florian Haupt, Frank Leymann, Anton Scherer, and Karolina Vukojevic-Haupt. A framework for the structural analysis of rest apis. In 2017 IEEE International Conference on Software Architecture (ICSA), pages 55–58. IEEE, 2017.
[18] Florian Haupt, Frank Leymann, and Karolina Vukojevic-Haupt. Api governance support through the structural analysis of rest apis. Computer Science-Research and Development, 33(3):291–303, 2018.
[19] A. Hora, A. Etien, N. Anquetil, S. Ducasse, and M. T. Valente. APIEvolutionMiner: Keeping api evolution under control. In Proc. IEEE Conference on Software Maintenance, Reengineering, and Reverse Engineering (CSMR-WCRE), pages 420–424, 2014.
[20] André Hora, Romain Robbes, Marco Tulio Valente, Nicolas Anquetil, Anne Etien, and Stéphane Ducasse. How do developers react to api evolution? a large-scale empirical study. Software Quality Journal, 26(1):161–191, 2018.
[21] Daqing Hou and Xiaojia Yao. Exploring the intent behind api evolution: A case study. In 2011 18th Working Conference on Reverse Engineering, pages 131–140. IEEE, 2011.
[22] Holger Knoche and Wilhelm Hasselbring. Continuous api evolution in heterogenous enterprise software systems. In 2021 IEEE 18th International Conference on Software Architecture (ICSA), pages 58–68, 2021.
[23] R. Koçi, X. Franch, P. Jovanovic, and A. Abelló. Classification of changes in api evolution. In Proc. 23rd International Enterprise Distributed Object Computing Conference (EDOC), pages 243–249, 2019.
[24] Maxime Lamothe, Yann-Gaël Guéhéneuc, and Weiyi Shang. A systematic review of api evolution literature. ACM Computing Surveys (CSUR), 54(8):1–36, 2021.
[25] Arnaud Lauret. The Design of Web APIs. Manning, 2019.
[26] Fabio Di Lauro, Souhaila Serbout, and Cesare Pautasso. Towards large-scale empirical assessment of web apis evolution. In 21st International Conference on Web Engineering (ICWE2021), Biarritz, France, May 2021. Springer, Springer.
[27] J. Law and G. Rothermel. Whole program path-based dynamic impact analysis. In 25th International Conference on Software Engineering, 2003. Proceedings., pages 308–318, 2003.
[28] M.M. Lehman, D.E. Perry, and J.F. Ramil. Implications of evolution metrics on software maintenance. In Proceedings. International Conference on Software Maintenance (Cat. No. 98CB36272), pages 208–217, 1998.
[29] M.M. Lehman, J.F. Ramil, P.D. Wernick, D.E. Perry, and W.M. Turski. Metrics and laws of software evolution-the nineties view. In International Software Metrics Symposium, pages 20–32, Albuquerque, NM, November 1997.
[30] Jun Li, Yingfei Xiong, Xuanzhe Liu, and Lu Zhang. How does web service API evolution affect clients? In Proc. 20th International Conference on Web Services (ICWS), 2013.
[31] Daniel Lübke, Olaf Zimmermann, Cesare Pautasso, Uwe Zdun, and Mirko Stocker. Interface evolution patterns — balancing compatibility and flexibility across microservices lifecycles. In Proc. 24th European Conference on Pattern Languages of Programs (EuroPLoP 2019). ACM, 2019.
[32] Tarek Mahmud, Mujahid Khan, Jihan Rouijel, Meiru Che, and Guowei Yang. Api change impact analysis for android apps. In 2021 IEEE 45th Annual Computers, Software, and Applications Conference (COMPSAC), pages 894–903. IEEE, 2021.
[33] Cesare Pautasso and Olaf Zimmermann. The Web as a software connector: Integration resting on linked resources. IEEE Software, 35:93–98, January/February 2018.
[34] Clément Quinton, Michael Vierhauser, Rick Rabiser, Luciano Baresi, Paul Grünbacher, and Christian Schuhmayer. Evolution in dynamic software product lines. Journal of Software: Evolution and Process, 33(2):e2293, 2021.
[35] Souhaila Serbout, Fabio Di Lauro, and Cesare Pautasso. Web apis structures and data models analysis. In Proc. International Conference on Software Architecture (ICSA). IEEE, 2022. to appear.
[36] Souhaila Serbout, Cesare Pautasso, Uwe Zdun, and Olaf Zimmermann. From OpenAPI fragments to api pattern primitives and design smells. In Proc. European Conference on Pattern Languages of Programs (EuroPLoP), 2021.
[37] S. M. Sohan, Craig Anslow, and Frank Maurer. A case study of Web API evolution. In Proc. IEEE World Congress on Services, pages 245–252, 2015.
[38] Shaohua Wang, Iman Keivanloo, and Ying Zoua. How do developers react to RESTful API evolution? In Proc. International Conference on Service-Oriented Computing, page 245–259. Springer, 2014.
[39] Erik Wittern, Alan Cha, James C Davis, Guillaume Baudart, and Louis Mandel. An empirical study of graphql schemas. In International Conference on Service-Oriented Computing, pages 3–19. Springer, 2019.
[40] J. Yang, E. Wittern, A. T. T. Ying, J. Dolby, and L. Tan. Towards extracting web api specifications from documentation. In 2018 IEEE/ACM 15th International Conference on Mining Software Repositories (MSR), pages 454–464, 2018.
[41] Jerin Yasmin, Yuan Tian, and Jinqiu Yang. A first look at the deprecation of restful apis: An empirical study. In 2020 IEEE International Conference on Software Maintenance and Evolution (ICSME), pages 151–161. IEEE, 2020.
[42] T. Zimmermann, A. Zeller, P. Weissgerber, and S. Diehl. Mining version histories to guide software changes. IEEE Transactions on Software Engineering, 31(6):429–445, 2005.
Biographies

Fabio Di Lauro is a Ph.D. student in the Design and Web Information Systems Engineering research group at the Software Institute at USI Lugano, Switzerland, under the supervision of Prof. Dr. Cesare Pautasso. He completed his undergraduate studies at Università degli Studi di Milano, Italy in Information and Communication Technologies in 2011. Currently, he is working on analyzing the evolution of Web APIs.

Souhaila Serbout is a Ph.D. student in the Design and Web Information Systems Engineering research group at the Software Institute at USI Lugano, Switzerland, under the supervision of Prof. Dr. Cesare Pautasso. She carried out a Masters’s in New Technologies of Informatics at the Faculty of Informatics of the University of Murcia, Spain. In 2018, obtained a state engineer’s degree in computer science from Ecole Nationale Supérieure d’Informatique et d’Analyse des Systèmes in Rabat, Morocco. Currently, she works on visualizing and analyzing Web APIs structures, data models and patterns to find the mismatches between developers’ expectations and real-world APIs designs.

Cesare Pautasso is full professor at the Software Institute at USI Lugano, Switzerland. He leads the Architecture, Design and Web Information Systems Engineering research group, which focuses on building experimental systems to explore the intersection of Text-to-Visual modeling languages, API analytics and liquid software architectures. He is the general chair for EuroPLoP 2022 and SOSE 2022. He was the program co-chair for ICWE 2021, ICSOC 2013, ECOWS 2010 and Software Composition 2008 and the ICWE 2016, ECOWS 2011 general chair. He is the co-editor of the IEEE Software Insights department. His e-books on Email Anti-Patterns, Software Architecture, Business Process Management, and API visualization are available on LeanPub.
Journal of Web Engineering, Vol. 21_6, 1937–1980.
doi: 10.13052/jwe1540-9589.2167
© 2022 River Publishers