Performance of End-to-end Model Based on Convolutional LSTM for Human Activity Recognition
Young Ghyu Sun1, Soo Hyun Kim1, Seongwoo Lee1, Joonho Seon1, SangWoon Lee2, Cheong Ghil Kim3 and Jin Young Kim1,*
1Department of Electronic Convergence Engineering, Kwangwoon University, Seoul, Korea
2Department of Multimedia, Namseoul University, Cheonan, Korea
3Department of Computer Science, Namseoul University, Cheonan, Korea
E-mail: yakrkr@kw.ac.kr; kimsoogus@kw.ac.kr; swoo1467@kw.ac.kr; dimlight13@kw.ac.kr; quattro@nsu.ac.kr; cgkim@nsu.ac.kr;
jinyoung@kw.ac.kr
*Corresponding Author
Received 09 February 2022; Accepted 31 May 2022; Publication 27 August 2022
Abstract
Human activity recognition (HAR) is a key technology in many applications, such as smart signage, smart healthcare, smart home, etc. In HAR, deep learning-based methods have been proposed to recognize activity data effectively from video streams. In this paper, the end-to-end model based on convolutional long short-term memory (LSTM) is proposed to recognize human activities. Convolutional LSTM can learn features of spatial and temporal simultaneously from video stream data. Also, the number of learning weights can be diminished by employing convolutional LSTM with an end-to-end model. The proposed HAR model was optimized with various simulation environments using activities data from the AI hub. From simulation results, it can be confirmed that the proposed model can be outperformed compared with the conventional model.
Keywords: Human activity recognition, video-based model, deep learning, convolutional long-short term memory, end-to-end model.
1 Introduction
Human Activity Recognition (HAR) is one of the longstanding research topics playing an important role in many applications [1]. However, many challenges still remain like viewpoint variations, clothing, the high changes in body shape, etc. To solve these challenges and improve performance, machine learning and deep learning methods have been applied [2]. Generally, extracting hand-crafted features from data and learning classifiers on the acquired features are required in machine learning methods. However, the hand-crafted feature extraction process may cause an increase in resources [3]. And both the spatial features and temporal features are needed to accurately recognize the human activity. In order to relieve the matters, deep learning methods have been employed in recent years. As a result, the features can be automatically selected from raw data and used to classify human activity [7].
HAR approaches can depend on the data type. The data for HAR is divided to sensor data, image data and video data. Firstly, the sensor data are usually represented as one-dimension form such as sequence data which include temporal information. Long short-term memory (LSTM) has been used to learn features from one dimension data for HAR [5]. Secondly, image data is generally expressed in a two-dimensional form. It is difficult to recognize activities directly from image data since the image data include only spatial information. Thus, the image data are often used to estimate the human pose. Convolutional neural network (CNN) has been employed for training spatial information [6]. Furthermore, CNN has been utilized to precisely analyze sensor data by transforming one-dimension data to two-dimension [7]. Finally, the video data are represented as a three-dimensional form including spatial and temporal information. It is essential to figure out temporal information as well as spatial information in the video-based HAR model. Three-dimensional CNN (3D-CNN) was proposed to extract temporal information as the video-based model [8]. The input type of 3D-CNN can consist of height, width, and timestep of video frames in a video-based model. The spatial and temporal information of the video data can be extracted by the convolution operation using filters in 3D-CNN. However, the temporal information can be lost in the pooling process because the results of convolution operation are compressed. Convolutional LSTM was proposed for predicting a spatiotemporal sequence [9]. And compared with fully connected LSTM, it can be decreased the number of weights. Consequently, convolutional LSTM can be used to design an end-to-end trainable model.
In this paper, the end-to-end model with convolutional LSTM is proposed for recognizing human activity. Unlike the conventional approaches, which are block-based model, end-to-end model is used to unify the process between input and output. Because the blocks respectively involve diverse parameters and hyperparameters, the block-based model is difficult to optimize performance compared with the end-to-end model. In addition, convolutional LSTM can learn spatial features as well as temporal features from video data. A shape of component is a one-dimensional tensor in fully connected LSTM, while a form of three-dimensional tensors is treated in convolutional LSTM. For exact evaluation, the proposed model is simulated in terms of various convolutional LSTM structures.
The main contributions of this paper are summarized as follows.
• The end-to-end model based on the deep learning algorithm is proposed for HAR. Convolutional LSTM is employed to design the end-to-end model for HAR.
• The excellent performance of extracting temporal features can be confirmed by the proposed model based on convolutional LSTM compared with the end-to-end model based on the conventional deep learning algorithm.
• The proposed HAR model is evaluated in various environments to analyze the applicability of convolutional LSTM.
The remainder of this paper is organized as follows. In Section 2, the proposed system model is described for HAR. The evaluation methods and performance metrics are explained for validating the performance of the proposed model in Section 3. Simulation environment and results are shown in Section 4. Finally, concluding remarks are given in Section 5.
2 System Model
The video-based model using three-dimension type data should be able to acquire the spatial and temporal features for human activity recognition. There are diverse deep learning algorithms for the video-based HAR model. In CNN-LSTM, which is a hybrid deep learning model, CNN can extract the spatial features and LSTM is able to extract the temporal features from video data [10]. CNN and LSTM were combined in sequence for extraction of the spatial and temporal features. However, the spatial features resulting from CNN may be lost by converting one-dimension data for input of LSTM. 3D-CNN was studied to validate the ability of extracting temporal features from video data [8]. As well as the spatial features, the temporal features are extracted by the convolution operation using 3D-filters. However, the extracted temporal features may be damaged due to the pooling process compressing the features. To mitigate the loss of the spatial and temporal features, convolutional LSTM has been proposed by placing convolution operation into LSTM structure [9]. Due to the aforementioned properties of convolutional LSTM, it is utilized to establish the proposed HAR model.
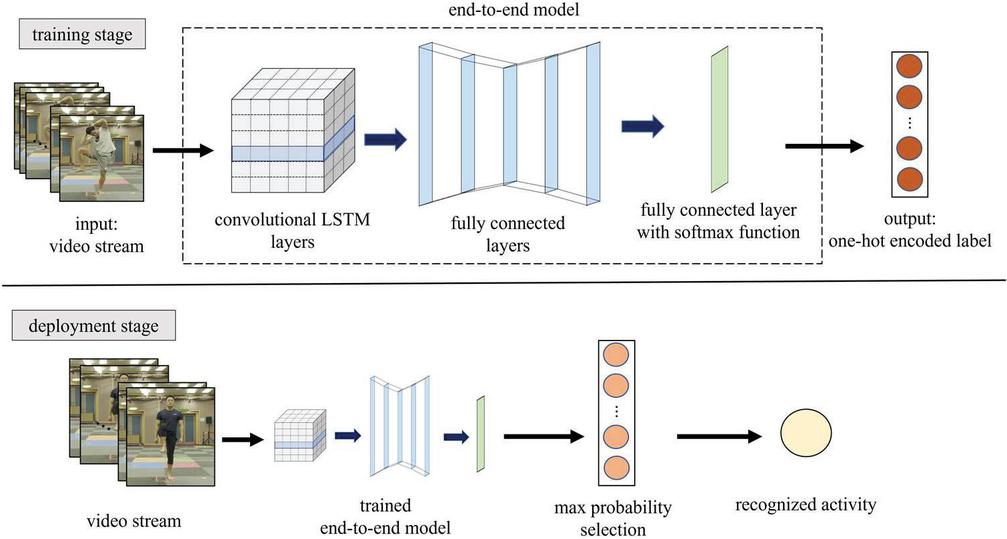
Figure 1 Block diagram of the proposed end-to-end model based on convolutional LSTM.
2.1 Proposed End-to-End Model
In this paper, it is used convolutional LSTM to design the end-to-end model for recognizing human activity. In Figure 1, the structure of the proposed end-to-end HAR model is shown. The input and output of the proposed model are video frames and a probability of classes recognizing, respectively. There are two stages which are training stage and deployment stage. In the training stage, the model is learned by the dataset composed of the video stream and one-hot encoded label. The proposed end-to-end model consists of convolutional LSTM layers, fully-connected layers, and fully-connected layer with softmax function. The spatial and temporal information are usually treated by convolutional LSTM layers. The fully-connected layer with softmax function is employed to build the output type as probability of classes. In deployment stage, the trained end-to-end model outputs the likelihood probability of classes from the video stream. The human activity is recognized by selecting the class of maximum likelihood probability.
2.2 Convolutional LSTM
Convolutional LSTM has been achieved a great performance in solving the prediction problem containing spatial and temporal information [9]. Unlike traditional LSTM models, convolutional LSTM deals with 3D tensor data to solve the problem of containing spatial and temporal information. Figure 2 represents the structure of convolutional LSTM. All values calculated in the convolutional LSTM consist of three dimensions, one temporal dimension, and two spatial dimensions. The convolutional LSTM determines the future state by using the information on adjacent past spatiotemporal states by convolution operations represented as Equations (1), (2), (3), (4), and (5).
| (1) | ||
| (2) | ||
| (3) | ||
| (4) | ||
| (5) |
where , , , , and are the input gate, forget gate, memory cell state, output gate, and sequence of hidden state, respectively. is a sigmoid function. * denotes the convolution operator. denotes the Hadamard product. , and are weight matrices and are bias vector. The input gate selects the data to be stored for the next state. The forget gate performs the function of selecting data with a low contribution to predictive model generation among state data. The output gate determines which state information will be routed to the output.
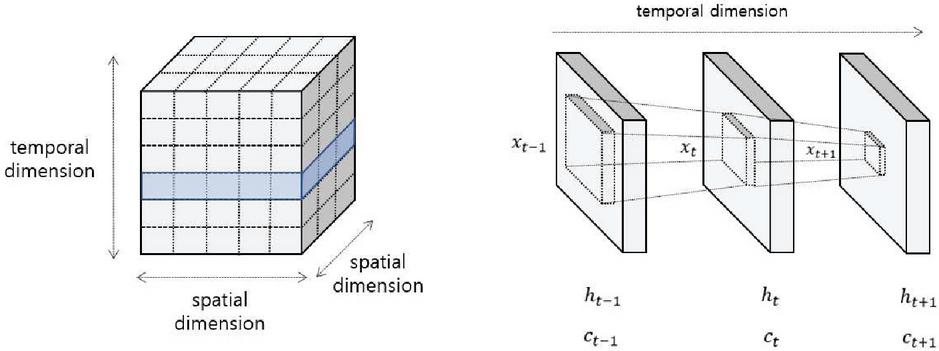
Figure 2 The structure of convolutional LSTM model.
3 Performance Analysis
The deep learning models are required for the process of model validation and evaluation, after the models are designed and learned. It is needed to model validation for confirming that the models have been trained as intended. The model evaluation learned on the training dataset is needed to check the performance of models on the test dataset as a new environment. By validating and evaluating the deep learning models, the overfitting and underfitting of models can be prevented. The HAR based on the deep learning model can be treated as the classification problem. Holdout, cross-validation, and bootstrap are mainly utilized to evaluate and validate the classification performance of the deep learning model. The holdout method randomly splits the dataset into training, validation, and test dataset. For the simplicity, the method is often employed for large datasets. However, high variability may be caused by the significant difference in the training and test dataset. The cross-validation method divides the dataset into k folds and is repeated k times. The performance of the model is measured by averaging the performance of overall k trials. The cross-validation method is more reliable compared to the holdout method and can utilize dataset more effectively. However, the computational cost is increased owing to the k repetition. Therefore, the cross-validation method is often used for small datasets. The bootstrap method decreases the high variability by resampling the dataset with replacement many times. Because of many times resampling, the method has heavy computation. Compared to the cross-validation method, the bootstrap method is more applicable for small datasets. In this paper, the cross-validation method is employed considering dataset size, reliability, and computational cost. In addition, to obtain a generalization of classification performance, ensemble averaging is applied. The commonly used metrics for classification matters are employed to measure numerical performance.
3.1 K-fold Cross-validation
K-fold cross-validation is usually used for model evaluation and selection by tunning hyperparameters [11]. In k-fold cross-validation, the training dataset is split into k parts. One group is utilized for validation dataset, and the remaining groups are merged as the training dataset. The cross-validation performance is measured by iterating k times. From each iteration, the performance metric values can be measured by using non-overlapping training and validation dataset. The average performance metric value is calculated as cross-validation performance. The equation of cross-validation performance is defined as follows:
| (6) |
where CV denotes cross-validation performance, represents performance metric value of th iteration. In the simulation, the 10-fold cross-validation is used to tune the hyperparameters of the model. The process of 10-fold cross-validation is described in Figure 3. In the training stage, the hyperparameters, which are the number of filters, filter size, and striding size, are tuned by the performance of 10-fold cross-validation. Furthermore, the hyperparameters of the model are adjusted upon four performance metrics.
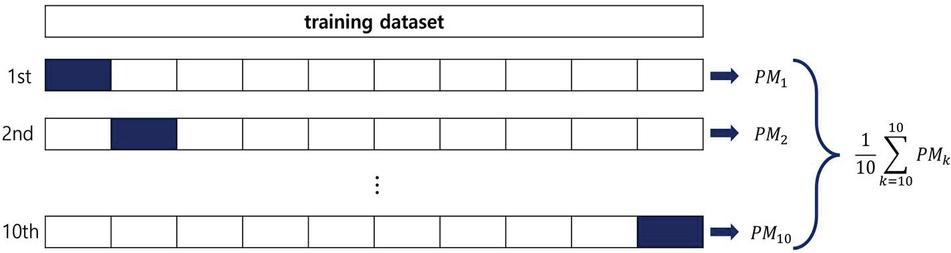
Figure 3 Procedure of the 10-fold cross-validation.
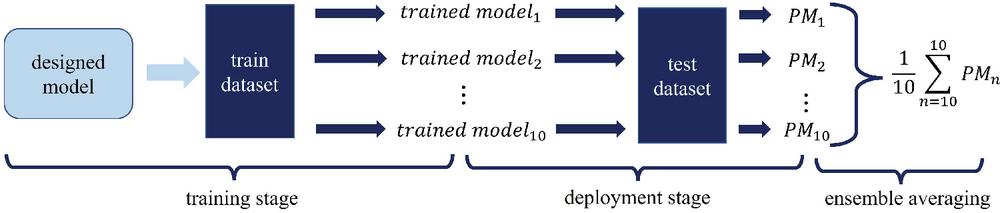
Figure 4 Process of ensemble averaging.
3.2 Ensemble averaging
Ensemble averaging is used to attain better generalization performance by combining several individual models [12]. The models with the same network structure are trained by the same training dataset. The trained models are generated with different weight values. From each trained model, performance metric values result in the same test dataset. The result is calculated by ensemble averaging using the performance metrics values. The equation of ensemble averaging is defined as follows:
| (7) |
where EA denotes outcome of ensemble averaging, represents performance metric value of th trained model. In the simulation, 10 trained models are generated and used for ensemble averaging. The process of ensemble averaging represents in Figure 4. The trained models are generated in the training stage. The performance metric values result from trained models and test datasets in the deployment stage. The ensemble average of the performance metric is calculated to evaluate model performance.
3.3 Performance Metrics
In this paper, four performance metrics which are Precision, Recall, F1-score, and Matthews correlation coefficient (MCC) [13] are used to evaluate the proposed model. The metrics are defined as follows:
| (8) | |
| (9) | |
| (10) | |
| (11) |
where TP, FP, TN, FN denote true positive, false positive, true negative, false negative, respectively. True positive represents an outcome where the model correctly predicts the positive class, false positive denotes a result that the model wrongly predicts the positive class, true negative means an outcome that the model correctly predicts the negative class, false negative represents a result where the model incorrectly predicts the negative class. Precision is called positive predictive value and ratio of actual positive classes among predicted positive classes. Recall is called sensitivity and ratio of predicted positive classes among actual positive classes. F1-score is calculated as harmonic mean of Precision and Recall. F1-score can be usually used to evaluate the classification performance of the model because it is improper to apply Accuracy for confirming the classification performance in imbalanced class data. MCC is called phi coefficient and utilized as a measure of the quality of classification. MCC is effective in evaluating performance of the model since it is calculated by all instances of the confusion matrix unlike other metrics.
4 Simulations Results
In this Section, a simulation environment is described including data organization, parameters setting. Based on performance metrics, simulation results are shown and analyzed in tables and figures.
Five fitness activities data from AI hub [14] were utilized to simulate the proposed model. Five activities consist of standing-side, cross-lunge, side-lunge, knee-up, and good-morning. Figure 5 represents an example of five fitness activities data. The number of train data, validation data, and test data are 5,216, 1,205, and 1,205, respectively. The number of frames was set to be 15 for the input of the model.
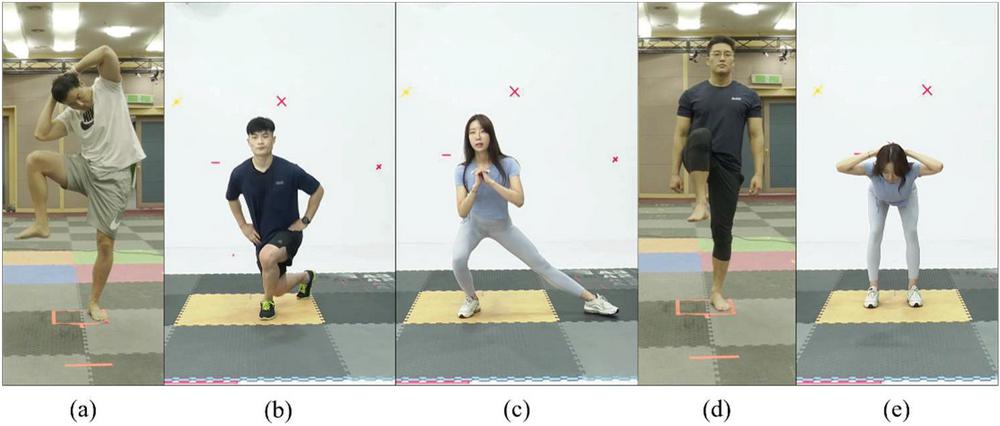
Figure 5 Examples of activities data from AI hub; (a) standing-side; (b) cross-lunge; (c) side-lunge; (d) knee-up; (e) good-morning.
The model was designed as one convolutional LSTM layer, seven fully-connected layers, one fully-connected layer with softmax function. The hyperparameters of the model affect the classification performance. The number of filters, filter size, and striding size are selected and adjusted to find the proposed model with maximum performance. To analyze the influence of the number of filters, filter size and striding size were set to be 4 by 4 and 4, and then the number of filters was changed from 8 to 128. Furthermore, the filter size was adjusted up to 8 by 8 for investigating the effect of the filter size with the number of filters and striding size set to be 64 and 4. The striding size was also changed up to 8 with the number of filters and filter size set to be 64 and 4 by 4. The simulation setting represents in Table 1.
Table 1 Simulation parameters
| Parameter | Value | Description |
| # of class | 5 | human activities: standing-side, cross-lunge, side-lunge, knee-up, good-morning |
| input shape | 160 90 15 | video resolution: width height frame |
| # of channels | 3 | color video data |
| # of filters | 8, 16, 32, 64, 128 | hyperparameter in convolutional LSTM layer |
| filter size | 2 2, 4 4, 6 6, 8 8 | hyperparameter in convolutional LSTM layer |
| striding size | 2, 4, 6, 8 | hyperparameter in convolutional LSTM layer |
| # of fully-connected layers | 7 | The number of layers in fully-connected layer part of the end-to-end model |
| # of neurons | 32, 64, 128, 256, 128, 64, 32 | the number of neurons in each fully-connected layers |
| activation function | ReLU | the used activation function in fully-connected layers |
| batch size | 64 | The number of training dataset used in one iteration |
| epoch | 100 | learning cycle to entire training dataset |
Simulation results are shown as confusion matrix and performance metrics for evaluating the performance of the proposed end-to-end model. To figure out the ability to extract temporal features of convolutional LSTM, the end-to-end model based on convolutional LSTM was compared with the end-to-end model based on 3D-CNN.
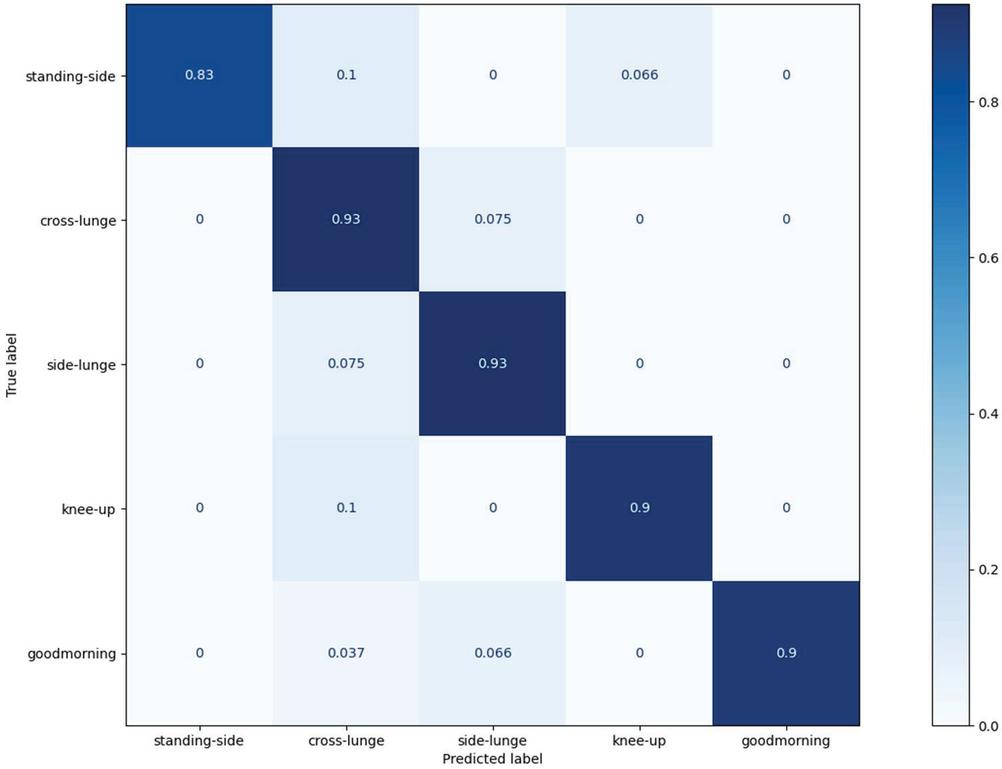
Figure 6 Confusion matrix for proposed model.
Figure 6 represents the confusion matrix for the proposed end-to-end model. The hyperparameters which are the number of filters filter size and striding size were set to be 64, 4 by 4, 4. It was shown that classification accuracy was reached 90% except for the standing-side class. The misidentified data was usually classified as cross-lunge class. From these results, it can be analyzed that the motion of the cross-lunge class includes many similar motions of other classes. Although the classification accuracy of the standing-side class had 83%, the proposed end-to-end model was shown outstanding performance in human activity recognition.
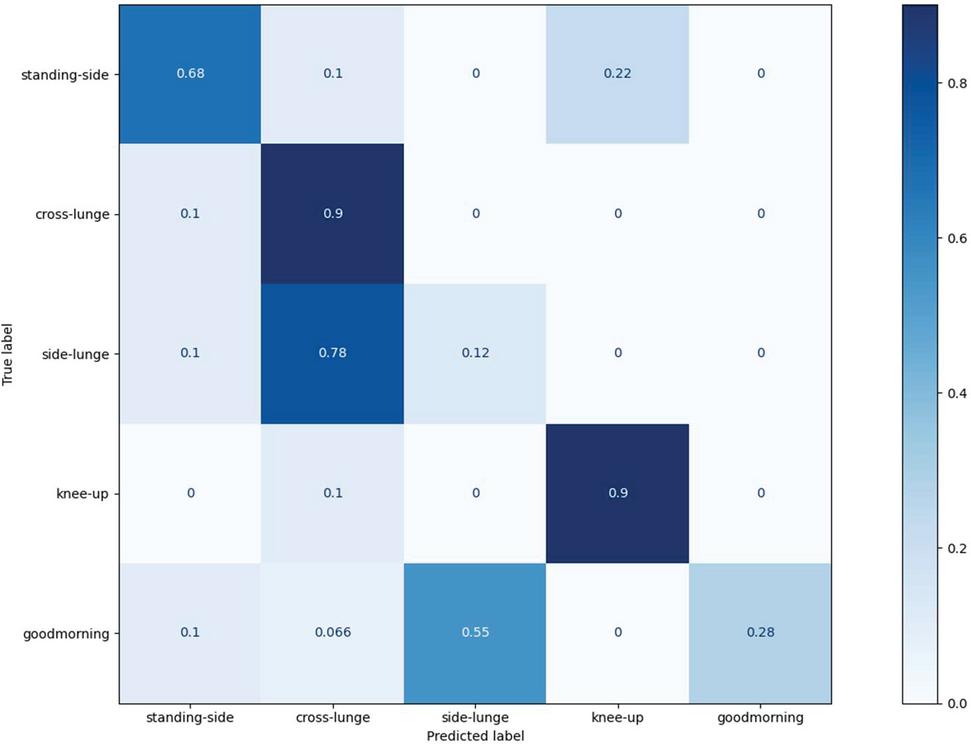
Figure 7 Confusion matrix for conventional model.
Figure 7 denotes the confusion matrix for the end-to-end model using 3D-CNN. To compare the performance, the hyperparameters which are the number of filters, filter size, and striding size was set to be 64, 4 by 4, 4 like as the proposed end-to-end model. The classification accuracy reached 90% only became the cross-lunge class and the knee-up lunge. The end-to-end model based on 3D-CNN had deficient classification performance in the other classes. Especially, the side-lunge class and good-morning class were described insufficient classification accuracy. From Figure 4, it can be understood that it is difficult to extract the temporal information for 3D-CNN. Precision, Recall, F1-scores, and MCC for the end-to-end model based on convolutional LSTM and 3D-CNN, respectively, were shown in Table 2. The four performance metrics were calculated based on confusion matrixes represented in Figures 6 and 7. The proposed model was outstanding in terms of all performance metrics compared with the conventional model.
Table 2 Performance metrics for the proposed and conventional models
| Model | Precision | Recall | F1-score | MCC |
| ConvLSTM | 0.9094 | 0.8962 | 0.8986 | 0.8725 |
| 3D-CNN | 0.6272 | 0.5793 | 0.5456 | 0.4890 |
From the confusion matrix and performance metrics, it can be confirmed that the end-to-end model using convolutional LSTM has the superior ability to extract temporal features from video data compared with the end-to-end model based on 3D-CNN.
The proposed end-to-end model was simulated in a various simulation environment to analyze applicability of convolutional LSTM. Performance metrics were calculated by changing the hyperparameters which are the number of filters, filter size, and striding size. Table 3 denotes the performance metrics varied with the number of filters. The performance metrics with the number of filters set to be 32 denote the highest values in Table 3. Table 4 represents performance metrics varied with the filter size. From Table 4, it can be confirmed that the model with filter size set to be 6 by 6 was a supreme performance. Performance metrics varied with the stride were shown in Table 5. When the striding size was set to be 4, all performance metrics were computed at most high values.
Table 3 Performance metrics varied with the number of filters
| # of Filters | Precision | Recall | F1-score | MCC |
| 8 | 0.9112 | 0.8970 | 0.9006 | 0.8732 |
| 16 | 0.9208 | 0.9145 | 0.9157 | 0.8941 |
| 32 | 0.9290 | 0.9186 | 0.9204 | 0.9000 |
| 64 | 0.9094 | 0.8962 | 0.8986 | 0.8725 |
| 128 | 0.9127 | 0.8962 | 0.8986 | 0.8735 |
Table 4 Performance metrics varied with the filter size
| Filter Size | Precision | Recall | F1-score | MCC |
| 2 2 | 0.8896 | 0.8896 | 0.8896 | 0.8659 |
| 4 4 | 0.9094 | 0.8962 | 0.8986 | 0.8725 |
| 6 6 | 0.9136 | 0.9136 | 0.9136 | 0.8946 |
| 8 8 | 0.8672 | 0.8672 | 0.8672 | 0.8351 |
Table 5 Performance metrics varied with the striding size
| Striding Size | Precision | Recall | F1-score | MCC |
| 2 | 0.8721 | 0.8721 | 0.8721 | 0.8462 |
| 4 | 0.9094 | 0.8962 | 0.8986 | 0.8725 |
| 6 | 0.8979 | 0.8979 | 0.8979 | 0.8742 |
| 8 | 0.8962 | 0.8962 | 0.8962 | 0.8714 |
It was tried to find the proposed model with the highest classification performance. It was difficult to detect the performance variation trend of the model from simulation results. Therefore, it may empirically find the optimal hyperparameters for max performance. From performance metrics varied with the hyperparameters, the proposed model with maximum performance may be discovered as the number of filters, filter size, and striding size are set to be 32, 6 by 6, 4, respectively.
5 Conclusions
The end-to-end model based on convolutional LSTM was proposed to recognize human activity in this paper. The proposed model was compared with the conventional model for confirming the property of convolutional LSTM extracting temporal information from video stream data as well as spatial information. Furthermore, the proposed model was simulated in various experiment environments for studying the applicability of convolutional LSTM. From simulation results, it was confirmed that the proposed end-to-end model had outstanding performance than the end-to-end model using 3D-CNN. It was analyzed that convolutional LSTM is able to apply by adjusting hyperparameters widely. It is expected that the proposed end-to-end model based on convolutional LSTM can be applied to smart signage, smart home service, smart healthcare service, etc.
Acknowledgment
This research was supported in part by Culture, Sports and Tourism R&D Program through the Korea Creative Content Agency grant funded by the Ministry of Culture, Sports and Tourism in 2022 (Project Name: Development of smart sports devices for home training and gamification service technologies, Project Number: SR202107004, Contribution Rate: 50%); and in part by Institute of Information & Communications Technology Planning & Evaluation (IITP) grant funded by the Korea government (MSIT) (IITP-2022-2020-0-01846, Research and Development of Realistic Content Device Technology).
References
[1] F. Gu, M.-H. Chung, M. Chignell, S. Valaee, B. Zhou, and X. Liu, “A survey on deep learning for human activity recognition,” ACM Computing Surveys, vol. 54, no. 8, pp. 1–34, Oct. 2021.
[2] S. Neili Boualia and N. Essoukri Ben Amara, “Deep full-body HPE for activity recognition from RGB frames only” Informatics, vol. 8, no. 1, pp. 1–16, Jan. 2021.
[3] L. Pei, S. Xia, L. Chu, F. Xiao, W. Yu, and R. Qiu, “MARS: Mixed virtual and real wearable sensors for human activity recognition with multidomain deep learning model,” IEEE Internet of Things Journal, vol. 8, no. 11, pp. 9383–9396, June 2021.
[4] S. Song, C. Lan, J. Xing, W. Zeng, and J. Liu, “An end-to-end spatio-temporal attention model for human action recognition from skeleton data,” in Proceedings of the Thirty-First AAAI Conference on Artificial Intelligence (AAAI’17), San Francisco, USA, Feb. 2017, pp. 4263–4270.
[5] T. Zebin, M. Sperrin, N. Peek and A. J. Casson, “Human activity recognition from inertial sensor time-series using batch normalized deep LSTM recurrent networks,” in Proceedings of 2018 40th Annual International Conference of the IEEE Engineering in Medicine and Biology Society (EMBC), Honolulu, USA, July 2018, pp. 1–4.
[6] A. Singh, S. Agarwal, P. Nagrath, A. Saxena and N. Thakur, “Human pose estimation using convolutional neural networks,” in Proceedings of 2019 Amity International Conference on Artificial Intelligence (AICAI), Dubai, U.A.E., Feb. 2019, pp. 946–952.
[7] C. Ito, X. Cao, M. Shuzo, and E. Maeda, “Application of CNN for human activity recognition with FFT spectrogram of acceleration and gyro sensors,” in Proceedings of the 2018 ACM International Joint Conference and 2018 International Symposium on Pervasive and Ubiquitous Computing and Wearable Computers, Singapore, Singrapore, Oct. 2019, pp. 1503–1510.
[8] S. Ji, W. Xu, M. Yang, and K. Yu, “3D convolutional neural networks for human action recognition,” IEEE Transactions on Pattern Analysis and Machine Intelligence, vol. 35, no. 1, pp. 221–231, Jan. 2013.
[9] X. Shi, Z. Chen, H. Wang, D.-Y. Yeung, W.-k. Wong, and W.-c. Woo, “Convolutional LSTM Network: a machine learning approach for precipitation nowcasting,” in Proceedings of the 28th International Conference on Neural Information Processing Systems – Volume 1(NIPS’15), Montreal, Canada, Dec. 2015, pp. 802–810.
[10] Md. Z. Islam, Md. M. Islam, and A. Asraf, “A combined deep CNN-LSTM network for the detection of novel coronavirus (COVID-19) using X-ray images,” Informatics in Medicine Unlocked, vol. 20, no. 100412, pp. 1–11 Aug. 2020.
[11] Y. Bengio and Y. Grandvalet, “No unbiased estimator of the variance of k-fold cross-validation,” The Journal of Machine Learning Research, vol. 5, pp. 1089–1105, Dec. 2004.
[12] B. Zhang, S. Qi, P. Monkam, C. Li, F. Yang, Y.-D. Yao, and W. Qian, “Ensemble learners of multiple deep CNNs for pulmonary nodules classification using CT images,” IEEE Access, vol. 7, pp. 110358–110371, Aug. 2019.
[13] I. Markoulidakis, I. Rallis, I. Georgoulas, G. Kopsiaftis, A. Doulamis, and N. Doulamis, “Multiclass confusion matrix reduction method and its application on net promoter score classification problem,” Technologies, vol. 90, no. 4, pp. 1–22, Nov. 2021.
[14] Fitness gesture image in AI hub. Retrieved from: https://aihub.or.kr/aidata/8051.
Biographies

Young Ghyu Sun received the B.Sc. (summa cum laude) and M.Sc. degree from the Department of Electronic Convergence Engineering, Kwangwoon University, Seoul, Korea, in 2018 and 2020, respectively, where he is currently pursuing the Ph.D. degree. He was a recipient of the IEEE Student Paper Gold Award in 2020. His research interests include wireless communication systems, deep learning, and internet of energy, etc.

Soo Hyun Kim received the B.Sc. and M.Sc. degree from the Department of Electronic Convergence Engineering, Kwangwoon University, Seoul, Korea, in 2019 and 2021, respectively, where he is currently pursuing the Ph.D. degree. His research interests include wireless communication systems, and machine learning applications for internet of energy etc.

Seongwoo Lee received the B.Sc. (magna cum laude) degree from the Department of Electronic Convergence Engineering, Kwangwoon University, Seoul, Korea, in 2021, where he is currently working toward the M.Sc. degree. He was a recipient of the Best Paper Award of IIBC in 2021. His research interests include smart grid, internet of energy, deep learning, etc.

Joonho Seon received the B.Sc. degree from the Department of Electronic Convergence Engineering, Kwangwoon University, Seoul, Korea, in 2021, where he is currently pursuing the Ph.D. degree. His research interests include internet of energy, deep learning, smart grid, etc. He received the Best Paper Awards from the Institute of Internet, Broadcasting and Communication (IIBC) conference (2021).

SangWoon Lee received the B.S., M.S. in electrical engineering and Ph.D degrees in electrical and electronics engineering from Yonsei University, Seoul, Korea, in 1987, 1989 and 2005, respectively. From 1991 to 2005, he worked as a research engineer and project manager of R&D Center of MBC (MunHwa Broadcasting Corp.), Seoul Korea. In 2005, he joined Yonsei University, Seoul, Korea, as a Research Professor in the Dept. of Electrical and Electronics and a research fellow for the CABT (Center for Advanced Broadcast Technology). Currently, he is working as a professor in the Department of Multimedia at Namseoul University, Cheon-An City Korea. His main research areas are mobile multimedia broadcasting and intelligent transportation systems. He is active as a Korean Deligate for ITU-R SG6, SG1, and ISO TC204 and President of Korea ITS Society.

Cheong Ghil Kim received the B.S. degree in computer science from the University of Redlands, CA, USA, in 1987, and the M.S. and Ph.D. degrees in computer science from Yonsei University, South Korea, in 2003 and 2006, respectively. He is currently a Professor with the Department of Computer Science, Namseoul University, South Korea. His research areas include multimedia embedded systems, mobile AR, and 3-D contents.

Jin Young Kim received the B. S., M. S., and Ph. D. degrees from the School of Electrical Engineering, Seoul National University (SNU), Seoul, Korea, in 1991, 1993, and 1998, respectively. He was Member of Research Staff at the Institute of New Media and Communications (INMC) and at the Inter-university Semiconductor Research Center (ISRC) of the SNU from 1994 to 1998. He was Postdoctoral Research Fellow at the Department of Electrical Engineering, Princeton University, NJ, U.S.A, from 1998 to 2000. He was Principal Member of Technical Staff at the Central Research and Development Center, SK Telecom, Korea, from 2000 to 2001. He is currently Full Professor at the School of Electronics Engineering, Kwangwoon University, Seoul, Korea. He had his sabbatical leave as Visiting Scientist at the LIDS (Laboratory of Information and Decision Systems), Massachusetts Institute of Technology (M.I.T), MA, U.S.A from 2009 to 2010.
His research interests include artificial intelligence, design and implementation of wireline/wireless multimedia communication systems with basis on modulation/demodulation, synchronization, and detection/estimation theory. He received the Best Paper Awards from several academic conferences and societies including Jack Neubauer Best Systems Paper Award from IEEE VT Society (2001), the Award of Prime Minister of Korea Government (2011), He is now Senior Member of IEEE, Regular Member of IET and IEICE.
Journal of Web Engineering, Vol. 21_5, 1671–1690.
doi: 10.13052/jwe1540-9589.21512
© 2022 River Publishers