A Systematic Mapping Study on Quality Attribute Traceability
Ehsan Sharifi, Ahmad Abdollahzadeh Barforoush* and Haider S. Al dabbagh
Department of Computer Engineering, Amirkabir University of Technology, Tehran, Iran
E-mail: ahmad@ce.aut.ac.ir
*Corresponding Author
Received 30 July 2022; Accepted 13 September 2022; Publication 09 November 2022
Abstract
Quality attribute traceability (QAT), as a sub-discipline of software traceability, ensures that quality attributes are considered in all phases of software development. QAT is one of the most critical and challenging research areas in requirement engineering. In recent years, several studies have been conducted on quality attribute traceability. However, researchers in this field have problems to identifying the research status of this field due to the lack of a comprehensive secondary study that reveals research trends and gaps. Evidence-based software engineering (EBSE) proposes systematic mapping study (SMS) and systematic literature review (SLR) methods for secondary studies on software engineering. In this paper we use the semantically enhanced SMS method in the QAT research area. In order to improve SMS, we introduce a concept classification approach. In this approach by using a QAT domain ontology, the keywords classification process is improved. The most important innovation of this study is the presentation of the QAT research tree. This research tree has been created by gathering research topics identified in this field along with existing gaps. Identified research topics include “QAT Approach,” “QAT Development,” “QAT Model,” “QAT Framework,” and “QAT Algorithm”. The results also indicate that “QAT Frameworks” is a research trend, and most recent studies have focused on this topic. On the other hand, “Trace Maintenance” and “Trace Integrity” are the research gaps in this field. In this article, active researchers, journals, conferences and countries in the field of QAT are also introduced. We also introduce a set of tools that facilitate the SMS process.
Keywords: Traceability, quality attribute, systematic mapping study, concept classification.
1 Introduction
Quality attributes affect the quality of software (IEEE, 1990). Software quality is equivalent to how the quality attributes are met (IEEE, 1998). In software engineering, system success and user satisfaction are directly related to the realization of quality attributes (Mehdi Mirakhorli and Cleland-Huang, 2012). Monitoring the realization of quality attributes during the development process is essential for ensuring the quality of the final product. Traceability plays a vital role in achieving this goal. Traceability is an essential mechanism for controlling the quality attributes (Barbacci et al., 1997). Traceability defines as follows based on the CoEST1: “the ability to describe and follow the life of a requirement in both a forwards and backward direction (i.e., from its origins, through its development and specification, to its subsequent deployment and use), and through periods of ongoing refinement and iteration in any of these phases.”
Quality attribute traceability (QAT) is a special type of requirements traceability. QAT allows the tracing of quality attributes in various software artifacts such as architecture, design, and source code. This type of traceability offers several advantages. In the initial steps of a project, risk identification and cost estimation are some of its benefits. Ensuring the realization of quality attributes by the proposed architecture plays a vital role in the QAT. In the maintenance step, QAT provides change impact analysis and prevents problems such as “architectural erosion” (Mehdi Mirakhorli and Cleland-Huang, 2012).
However, establishing a QAT is challenging. One of the main challenges is the “multi-level” nature of QAT. High-level architectural decisions are typically related to a wide range of subsequent lower-level decisions. Therefore, solutions must explicitly link high-level decisions to their related components at other levels. “Multi-path” is the next challenge. Different architectural decisions are described from different perspectives. Therefore, traceability must be established in practice from one or more paths. The next significant challenge is “multi-granularity.” QAT is generated at varying levels of granularity, such as layers, components, classes, methods, and even variables (Mehdi Mirakhorli and Cleland-Huang, 2012).
The above challenges highlight the complexities of the QAT. Numerous studies have examined these challenges in recent years. Researchers who are new to this research area need secondary studies to understand the status of the existing research trends and gaps. Secondary studies can help researchers identify approaches that are relevant to their needs and prevent them from reworking and wasting time. Cleland-Huang et al. have conducted a secondary study in the QAT area (Cleland-Huang et al., 2014). This secondary study aimed to classify approaches in the QAT area up to 2012. The main limitation of this study is the lack of a systematic approach.
Evidence-based software engineering presents two systematic approaches to performing reliable, repeatable, unbiased, and comprehensive secondary studies (Kitchenham et al., 2004). These approaches are systematic mapping study (SMS) and systematic literature review (SLR). SMS and SLR are complementary, and each serves a distinct function. The main goal of SMS is to classify research patterns and categorize topics in the field of study. This method is appropriate for starting a research project and deciding the research topic. However, the goal of the SLR is to identify the most important studies in a field to answer one or more specific research questions. This method is used when you are sure of the research field you want to pursue. SMS research questions are more general, and the SMS process is usually completed before the SLR.
As no systematic secondary studies have been conducted in this area to date, evidence-based software engineering recommends the first SMS and then SLR (Kitchenham et al., 2004). Therefore, we use the SMS method to perform a secondary study based on the Peterson et al. guidelines (Petersen et al., 2015). SMS can be beneficial for a wide range of scholars. The researchers will identify the current trends in this field by reading this paper. Moreover, by avoiding duplication, the correct research path is demonstrated. On the other hand, practitioners also identify novel ideas regarding approaches and frameworks and provide the possibility of using and promoting them in the software industry.
One of the major activities of the SMS process is keyword classification. This type of classification divides articles into categories based on their subject matter and research area. In the absence of standard classifications, the keyword clustering method has a theoretical foundation that can be referenced by other researchers if performed correctly. To perform the classification, we need to extract the keywords of the articles. Existing approaches to keyword extraction have two main problems. First, these methods usually select keywords based on the number of repetitions. High repetition of a term does not necessarily mean that it is a keyword. Another problem is the lack of attention to the semantic similarity between terms, which may cause terms that are semantically equivalent to be identified as separate keywords. These problems affect the quality of the SMS process.
In this paper, to solve the above challenge, an ontology-based semantic approach is introduced to improve the keyword identification process. The proposed approach consists of three main steps. In the first step, an ontology of concepts in the field of QAT is created. The second step of the proposed solution is to identify suitable keywords. Suitable keywords are words that play an important role in identifying the subject of the article. To determine the suitability of a keyword, the three characteristics of relevance, effectiveness, and the number of repetitions are examined. In the third step, each suitable keyword is mapped to a concept in the ontology that has the closest semantic similarity.
This study has four significant achievements. The first and most important of these is to offer a QAT research tree, which is achieved by identifying research topics and gaps in QAT. Research topics are extracted by identifying the studies conducted in the QAT. This outcome is one of the apparent outputs of the SMS. Accordingly, studies in this domain fall into five categories: The “QAT Approach,” “QAT Development,” “QAT Model,” “QAT Framework,” and “QAT Algorithm” are the main research topics identified in QAT.
Research gaps are not identified only by extracting studies conducted in the QAT area. However, because QAT is a research sub-branch of software traceability, it can inherit its gaps. Therefore, we construct the QAT research tree by identifying the gaps in software traceability through existing secondary studies and combining them with identified QAT research topics.
The second outcome of this study is the identification of research trends in QAT. Research trends are identified by analyzing the publication dates of the selected studies. The results show that the research trend of recent years is the “QAT Frameworks”. The third achievement of this study is the identification of research gaps, which is one of the main goals of SMS. The results show that the research gaps in QAT are “Trace Integrity” and “Trace Maintenance”. The final achievement is to improve SMS results by introducing an ontology-based keyword extraction and classification.
This paper is organized as follows. In Section two, related studies are examined. In Section three, the research method is introduced, and the SMS process is planned and conducted. In Section four, the results are reported. In section five, the results are discussed. Section six examines the threats associated with the validity of the article. Finally, in Section seven, the conclusions and further studies are described.
2 Related Work
A search for similar studies in this field revealed that no similar mapping study covered all the studies conducted in this field. Hence, we review some research in this field. Cleland-Huang et al. (2014) conducted the QAT study. They divided QAT approaches into three groups. The first group involved studies that implicitly enabled traceability through software architecture-related activities. The second group encompasses customized methods, such as object-oriented or aspect-oriented methods, which explicitly allow QAT. Eventually, the third group makes traceability possible through architectural decisions. They aimed to provide a classification of existing approaches proposed before 2012. Therefore, they did not use a systematic approach. Cleland-Huang et al. (2015) introduced the research trends of software traceability. However, they did not focus on QAT. Additionally, they did not apply a systematic method.
Another systematic literature review (SLR) was conducted in 2018 and reviewed 114 papers on requirements traceability techniques between 2006 and 2016 (B. Wang et al., 2018). The primary research questions of this study are designed to identify researchers, challenges, and techniques in this field that result in the identification of 10 fundamental challenges in this field and the classification of traceability techniques into six classes and 25 sub-classes. A remarkable point of this study is the introduction of QAT as one of the challenges in this field. Another Systematic Mapping Study (SMS) in the field of software product line (SPL) traceability was conducted in 2016 (Vale et al., 2017). Sixty-two final papers were selected from the research conducted between 2001 and 2015. Objectives, strategies, application domain, research interests, challenges, rigor, and industrial relevance are seven aspects in which research questions have been raised. In this study, special attention was not paid to the issue of QAT.
Borg et al. (2014) is a systematic mapping that reviews information retrieval-based approaches in trace link recovery. Extraction viewpoints such as rule-based, ontology-based, and machine learning were not considered in this study. Hence, it covers only a small portion of the studies on software traceability. On the other hand, in this study, also secondary studies performed in this field have been accepted as included papers. Another critical point is the lack of focus on QAT in this study.

Figure 1 The general SMS process as an activity diagram.
Charalampidou et al. (2021) is a mapping study of software traceability that intends to perform all studies conducted in the field of software traceability with no specific limitations. The first, second, and fourth questions considered in this mapping study are about identifying the type of traceability artifacts, activities that have produced these artifacts, objectives, how to measure the substantiation of these objectives, and identifying validation methods of the traceability approach. However, the third question of this study is about identifying the quality attributes that have been evaluated in studies related to software traceability. This question aims to determine the quality advantages that can be achieved by establishing or maintaining traceability links. Another objective of this study is to identify the quality attributes affected by the proposed approach.
The results of this study indicate that maintainability quality attribute and other related attributes, such as testability and understandability, are the most affected by traceability. There is a fundamental difference between this study and ours. In this study, the effect of traceability on quality attributes is investigated in general terms, and the traceability of quality attributes is not considered. However, the primary purpose of our study is to identify the approaches that provide QAT.
3 Research Method
In this study, the guidelines proposed by Petersen et al. (2015a) are adopted as the research methodology. However, some changes are made to the guidelines to improve the quality of the SMS process. Figure 1 shows the general SMS process, which consists of three phases: planning, conducting, and reporting.
3.1 Planning the Mapping Study
Planning is the first phase of an SMS, consisting of several activities.
3.1.1 Determining the study scope and defining research questions
Determining the study scope and defining the research questions are the initial activities of the planning phase. The goal of this study is formulated based on the Goal Question Metric (GQM) approach and is similar to the research conducted by (Charalampidou et al., 2021). The goal is:” collect and analyze studies conducted in the field of QAT to (1) identify active research topics in this field, (2) identify research gaps, (3) identify active researchers in this field, (4) identify active conferences and journals in this field, and (5) identify active countries in this field”. The research domain includes all studies conducted in the QAT. The research questions are as follows.
• Q1: What are the main research topics in the field of QAT?
• Q2: What are the main research gaps in the field of QAT?
• Q3: What are the active researchers in the field of QAT?
• Q4: What are the active conferences and journals in the field of QAT?
• Q5: What are the occupied countries in the field of QAT?
The first group of individuals who benefit from responding to these questions is QAT researchers. Avoiding duplication of efforts and focusing on issues in this area are important achievements for researchers. On the other hand, by observing trends and gaps, practitioners improve the quality of software products by offering practical solutions. The response to these questions is also helpful for researchers who have recently entered this field and plan to identify pioneers, countries, journals, and conferences in this area and quickly identify the correct route. By referring to the results of this research, they can be directly connected to the communities and individuals associated with this field and start their research.
3.1.2 Planning the searching method
Planning the search method is the second step in the planning phase. In this activity, the space, string, and search strategies are determined. The search space includes related journals and conferences in the research field. Before initiating the search, the search spaces should be defined and completed incrementally and repeatedly. A search string is used to search the topic, abstract, and entire text of the related studies. Depending on the database, changes are made to the search string structure. Table 1 represents the search strings related to the study database. The first row in Table 1 lists the search string in a general format. We use IEEE Xplore, ACM Digital Library, and Scopus for this mapping study. We use these citation databases because they are highly comprehensive and have been used in several authoritative mapping studies. We employ a manual search method using the backward snowballing technique (Petersen et al., 2015). This strategy is performed using a seven-stage process, as shown in Figure 2.
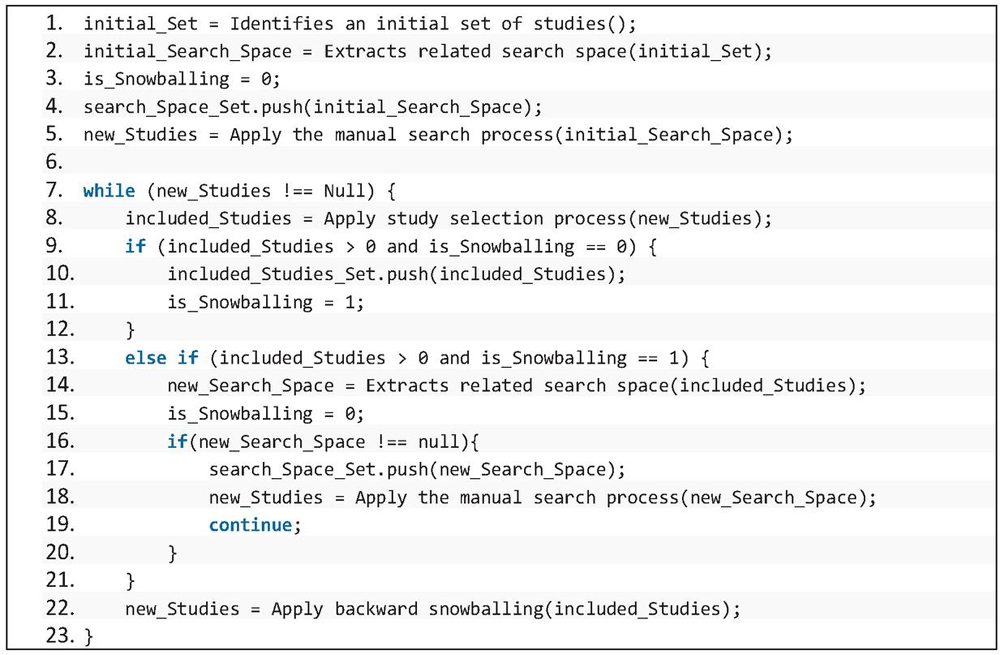
Figure 2 Search strategy as a pseudo code.
3.1.3 Defining study selection
The study selection method is defined as the third activity of the planning phase. This activity establishes the inclusion and exclusion criteria and explains the study selection strategy. The main aim is to identify high-quality studies in the existing set of studies. Thus, strict criteria must be defined to include or exclude studies. The only inclusion criterion in the SMS is the focus of this study on QAT. Accordingly, relevant studies on QAT are candidates for the final included studies. Table 2 shows the exclusion criteria. Studies with one exclusion criterion are excluded from the final included studies. We applied the Journal Citation Report (JCR) index to rank the journals. Thomson Reuters is a multinational corporation with several subsidiaries, one of which is Web of Science (WOS). The WOS is a scientific citation index that enables comprehensive citation searches, and indexed articles are known as ISI articles. A group of journals with impact factors in this database is called the JCR.
Table 1 Search strings
| Library | Search String |
| – | (“non-functional requirement” OR “quality attribute” OR “quality requirement” OR “NFRs”) AND (“trace” OR “traceability” OR “trace retrieval” OR “tracing”) |
| ACM Digital Library | acmdlTitle:(“non functional requirement” “quality requirement” “quality attribute” “non functional property” “NFR”) AND acmdlTitle: (“trace” “tracing” “traceability”) OR (recordAbstract:(“non functional requirement” “quality requirement” “quality attribute” “non functional property” “NFR”) AND recordAbstract:(“trace” “tracing” “traceability”)) OR (keywords.author.keyword:(“non functional requirement” “quality requirement” “quality attribute” “non functional property” “NFR”) AND keywords.author.keyword:(“trace” “tracing” “traceability”)) |
| IEEE Xplore | ((non-functional requirement) OR (Quality attribute) OR (Quality requirement) OR (NFR)) AND (trace) |
| Scopus | ((“non-functional requirement” OR “quality attribute” OR “quality requirement” OR “NFR”) AND (“trace*”)) |
Table 2 Exclusion criteria
| No. | Description |
| 1 | If the study is not an original study (SLR, SMS, Survey, etc.) |
| 2 | If the study is a journal and not in JCR |
| 3 | If the paper is a conference and has the following conditions: |
| (Qualis B4) or (ERA B) |
Q is derived from Quartile and indicates the ranking of journals in their field categories. For example, Q1 indicates that the journal is in the top 25% of the category. On the other hand, Qualis and Excellence in Research in Australia (ERA) are the two ranking methods used in this article for conference ranking. In the ERA ranking, articles are ranked between A (best) and C (worst). In the Qualis method, which uses the H-index, the articles are organized between A1 (best) and B5 (worst). Empirical threshold limits are employed to define these criteria. Moreover, according to item 4 of Table 2, articles rated lower than B in the ERA system or lower than B4 in the Qualis system will not be included in the final lists. The choice of B or B4 is also based on experience.
The study selection strategy consists of two stages: Stage I evaluates studies according to their topics, keywords, publication information, and abstracts, while Stage II evaluates studies according to their entire content. The inclusion or exclusion of studies is determined for each stage.
3.1.4 Determining an evaluation strategy for search and selection
Determining an evaluation strategy for the search and selection processes is the fourth step of the planning phase. The present study employs the test set strategy, which is one of the most common SMS evaluation approaches proposed by Petersen et al. (2015a). Based on the test set strategy, the search begins by referring to the field’s pioneers and investigating their research activities. A set of related studies is used to create a test set. Finally, the identified studies are compared as included studies to the test set for evaluation.
3.1.5 Planning data extraction
Information is extracted from the included studies to answer the research questions. Table 3 presents the items required for data extraction. The data are selected so that the research questions could be answered. Identifying the list of keywords is essential for answering Research Questions 1 and 2. To answer other questions, it is necessary to extract author names, publication year, publication place, and publication country. An examination of the topics, abstracts, and keywords identified by the authors provides a set of related terms that express the overall concept of the study. The entire text is examined for cases where it is impossible to extract suitable keywords from the three mentioned sources. Subsequently, the effective keywords are extracted. Effective keywords play an essential role in recognizing the topic of a study. Selecting keywords according to the number of repetitions could reduce the classification accuracy. For instance, the most repeated keyword in this study is “traceability,” but it does not influence classification because most studies in this field are related to traceability, and it could not be treated as a distinct cluster.
Table 3 Data extraction form items
| Item | The Reason for Selection |
| Article title | To identify the article |
| Authors’ names | To answer the research question 3 |
| Year of Publication | To answer the research question 3 |
| Location of publication | To answer the research question 4 |
| Country | To answer the research question 5 |
| Keywords | To answer the research questions 1,2 |
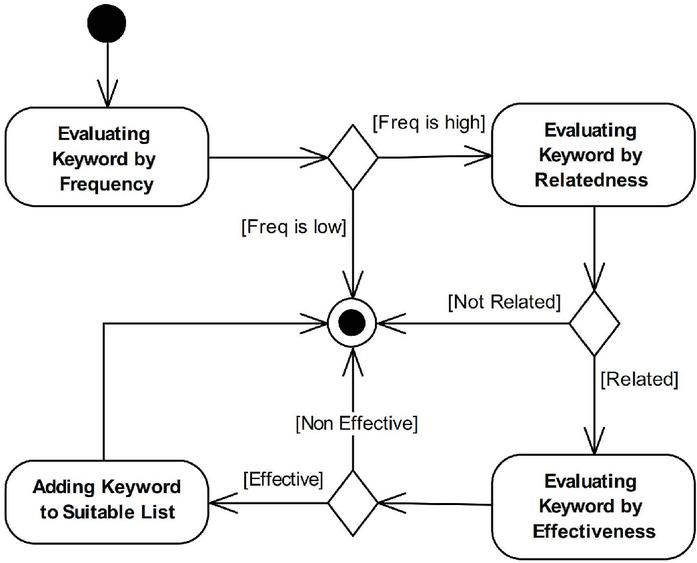
Figure 3 The heuristic method of suitable keywords selection.
Table 4 An example of suitable keyword selection activity
| Keyword | Frequency | Relatedness | Effectiveness | Selected |
| Implicit | High | Unrelated | Ineffective | No |
| Quality Attribute | High | Related | Ineffective | No |
| Evolution | Medium | Related | Effective | Yes |
| Architecture | High | Related | Effective | Yes |
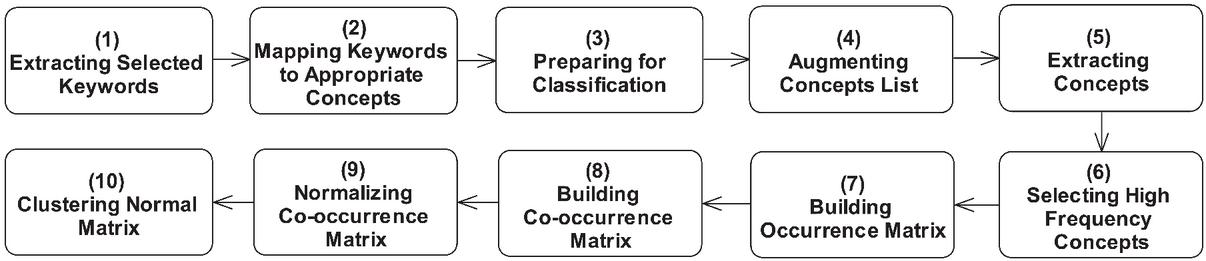
Figure 4 The keyword extraction and classification process model.
To address this problem, we propose a heuristic method for suitable keyword identification, as illustrated in Figure 3. Three criteria are used to determine whether a keyword is suitable: the number of repetitions, relatedness, and effectiveness. The relevance and usefulness of the keywords are determined by examining the first author of this article and reviewing the second and third authors. Table 4 shows some selected or rejected keywords according to this method, which is represented in Figure 4 as activity 1.
3.1.6 Planning conceptual classification
Classification is the last stage of the planning phase and is typically performed using topic-independent classification and topic-specific classification. In the former, studies are classified based on independent data on the content and topics of the studies, such as the author’s name, publication year, and publication place. This is the most common classification method in several studies. On the other hand, the latter classification method classifies studies based on their topics and research scopes.
One of the main objectives of an SMS, which is to identify research topics in a field, is achieved using a topic-specific classification method. Based on the guidelines of Petersen et al. (2015a), the topic-specific classification method can be performed in two ways. First, the existing classifications that are carried out by organizations such as IEEE and SWEBOK are adopted. Second, a new classification is created based on the data obtained from the SMS process. Keyword clustering is based on the second method. Keyword clustering is like open coding in grounded theory (Petersen et al., 2015). A theory is inductively extracted from a set of data using grounded theory-based methods. If this is performed correctly, the theory obtained is compatible with at least one dataset. Thus, if keyword clustering is performed correctly, it will have a theoretical basis that could be cited by other researchers in the absence of standard classifications.
Unfortunately, the keyword clustering process has a significant challenge, which affects classification. Overlooking the semantic relevance between keywords prevents the identification of semantically related words as being similar. This can lead to the removal of essential keywords from the classification process. It is also possible to classify two similar keywords into two separate categories. Thus, a solution is required to identify semantically related keywords. In this paper we propose conceptual clustering based on QAT domain ontology to enhance keyword clustering.
QAT Domain Ontology Generation: We improve the keywords identification and extraction process with an ontology-based solution. An ontology is employed to discover semantic relevance between keywords and provide a unified and shared understanding of concepts. According to this solution, an ontology of concepts in the QAT field is produced. The ontology used in this article is a lightweight ontology that expresses the subsumption relationships between concepts. The used definition of ontology comes from the study done by the second author of this article (Barforush and Rahnama, 2012) (Rahnama and Barforoush, 2015). The ontology development process is based on the methantology methodology.
The Methontology methodology provides a set of guidelines for performing existing activities during the development process. It determines how, when, and who to complete each activity; which techniques are more appropriate; and what will be the product of each activity. Various methodologies have been introduced to construct an ontology, which that methontology is one of the most prominent. This methodology also allows existing ontologies to be used to create an ontology. In this methodology, the existing activities are divided into management, development, and support. The management activities include control, quality assurance, and scheduling. Development activities include specification, conceptualization, formalization, implementation, maintenance, and support activities including knowledge acquisition, integration, evaluation, documentation, and configuration management. The most important activity of this methodology is the conceptualization activity, which consists of 11 steps: building a glossary of terms, building concept taxonomies, building ad hoc binary relation diagrams, building concept dictionaries, describing ad hoc binary relations, describing instance attributes, describing class attributes, describing constants, describing formal axioms, describing rules, and describing instances.
The first step in the construction of a methontology-based ontology is to build a glossary of terms in the quality attributes. This glossary of terms includes a brief description of each term in natural language, their synonyms and acronyms if they exist, and the type of the term. Terms related to this field are identified from reference papers in this field like (Cleland-Huang et al., 2014), (Mirakhorli and Cleland-Huang, 2012), keywords of the included papers, and software engineering ontologies. Wikipedia and WordNet have been used to find synonyms and descriptions related to terms in this field. Experts in this field decide the type of each term.
The second step is to build concept taxonomies in which hierarchical relationships are created. Hierarchy, taxonomy, or IS_A refers to the parent-child relationship between two concepts, in which the child has all the characteristics of its parent and may have its own characteristics. In the third step, once the hierarchical relationships between concepts have been built and evaluated, an ad hoc binary relation between concepts will be built. This step aims to establish ad hoc relationships between the concepts in the hierarchy defined in the previous step.
In the fourth step, a concept dictionary is built by specifying the required attributes and instances for each concept of the taxonomy. In the fifth step, the non-hierarchical relationships extracted in the third step are precisely described, and the relation name, source and target concepts, cardinality, inverse relation, and mathematical properties are specified.
In the sixth step, details of the instance attributes are described. Instance attributes are those whose values may differ for each concept instance. For each instance attribute, its name, the concept it belongs to, its value type, its measurement unit, precision and range of values, default values if they exist, and its cardinality are specified. The seventh Step specifies the details of the class attributes are the same. Class attributes take values in the class where they are defined. In the eighth step, the constants are defined in detail, if they exist. The ninth and tenth steps describe the formal axioms and rules that have not been considered in this study. In the final step, these instances are described.
This ontology is created once in the field and is reusable for all related research. A part of QAT domain ontology is shown in Figure 5. Complete details on the ontology are available on (http://islab.ceit.aut.ac.ir/qat-sms).
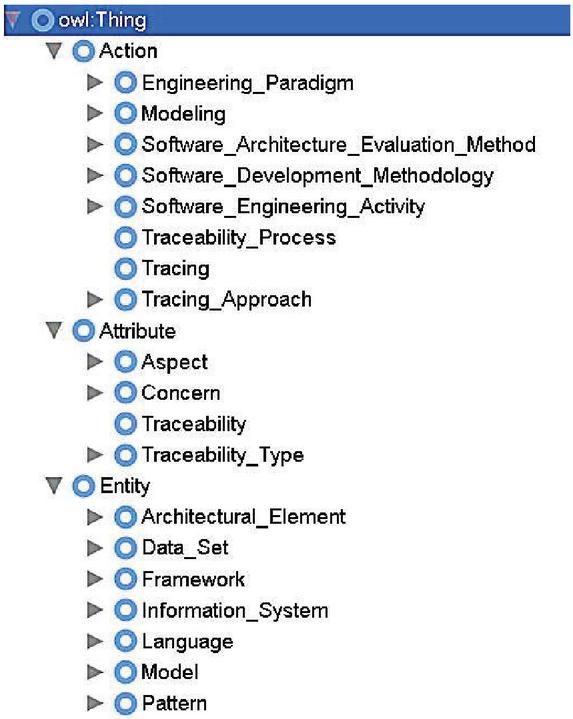
Figure 5 Part of the QAT domain ontology.
Mapping Keywords to Appropriate Concepts: According to Activity 2 in Figure 4, each suitable keyword is mapped to the most relevant concept in the ontology. This process can be done automatically or manually. In this study this activity is performed manually, Because the manual method is more accurate and the number of keywords in this research is not very high. In the mapping process, if no suitable concept is found for the keyword, the ontology is expanded with a suitable concept corresponding to the selected keyword. This iterative incremental process continues until the completion of the mapping process for all keywords.
Augmenting Concept List: Activity 4 in Figure 4 augments the concepts identified in Activity 2 with the concepts in their hierarchies. This activity causes each concept to be semantically replaced with a set of related concepts and increases the accuracy of the classification process. This activity is done automatically using the CAug tool which was developed by the first author of this article.
Concept Classification Process: Activities 5–10 in Figure 4 represent the concept classification process activities. First, the most repeated concepts are selected from the extracted concepts, forming an occurrence matrix. Cell ij represents the number of repetitions of concept i in study j. Afterward, a co-occurrence matrix is created. The co-occurrence matrix is a square matrix in which cell ij represents the simultaneous occurrence of two concepts in the entire included studies. Then, the normalized co-occurrence matrix is calculated by cosine similarity. Finally, the clustering algorithm is applied to the final matrix. The present study employs hierarchical clustering with complete linkage.
3.1.7 Evaluating the planning process
Evaluation is the final activity of the planning phase. To this end, the evaluation rubrics proposed by Petersen et al. (2015a) are employed. If the evaluation results indicate an inappropriate quality, the planning phase is revised to obtain the expected quality.
Table 5 Rubric 1: The precise description of the study scope and the definition of research questions
| Evaluation | Description | Score |
| Not described | Motives, objectives, etc. are not provided. | 0 |
| Relative | Motives, objectives, study scope, and research questions are provided. | 1 |
| Complete | Motives, objectives, study scope, and research questions are provided along with their relation to the target topics. | 2 |
Table 6 Rubric 2: search strategy selection and description
| Evaluation | Description | Score |
| Not described | One manual search performed. | 0 |
| Minimum | One manual and one backward snowballing search performed. | 1 |
| Complete | Manual, backward snowballing and forward snowballing searches performed | 2 |
Table 7 Rubric 3: search result evaluation
| Evaluation | Description | Score |
| Not described | No evaluation | 0 |
| Minimum | At least one attempt to improve the reliability of search results or to improve inclusion/exclusion | 1 |
| Relative | At least one attempt to improve the reliability of search results and to improve inclusion/exclusion | 2 |
| Complete | The entire identification attempts performed | 3 |
Table 8 Rubric 4: data extraction and classification
| Evaluation | Description | Score |
| Not described | No attempt to improve data extraction or enable comparison between studies by using the existing classifications | 0 |
| Minimum | At least one attempt to improve the reliability of data extraction | 1 |
| Relative | At least one attempt to improve the reliability of data extraction and to improve classification | 2 |
| Complete | The entire identification attempts performed | 3 |
Table 9 Rubric 5: study validation
| Evaluation | Description | Score |
| Not described | Risks and limitations not investigated | 0 |
| Completed | Risks and limitations investigated | 1 |
Tables 5–9 show the scores for the planning phase. In Table 5, the precise explanation of the study scope and description of the research questions are defined with scores from 0 to 2. Zero indicates a lack of description of the motivations, objectives, scope of the study, and research questions. A score of 1 indicates the description of the preceding items, and a score of 3 indicates the description of the preceding items and their relationship with the target audience. This study obtained a score of 1 in Table 5. Table 6 presents the selection procedure and a description of the search strategy. Because we use the manual method with backward snowballing, a score of 1 is obtained. Table 7 assesses the search results. Because the third party, other than the authors of the article, evaluated the search results using the test set method, a score of one is obtained. Table 8 assesses the data extraction and clustering process. Because an ontology-based solution is proposed to improve the keyword extraction and clustering process, a score of 2 is obtained, and the degree of assessment is relative. Table 10 assesses the validity of this study. Because the threats and limitations are expressed in this article, the score is 1. Column 1 of Table 10 represents the rubric number, column 2 indicates the score of the first phase, and column 3 provides the percentages of the scores of the mapping studies investigated by Petersen et al. (2015b). Therefore, the scores of the first phase are satisfactory compared to the results provided in Column 3.
Table 10 SMS process evaluation
| Rubric | This Study | Peterson’s SMSs | |
| Number | Evaluation Degree | Evaluation Degree | |
| 0 | 0% | ||
| 1 | 1 | 1 | 100% |
| 2 | 0% | ||
| 0 | 40% | ||
| 2 | 1 | 1 | 23% |
| 2 | 19% | ||
| 0 | 44% | ||
| 3 | 1 | 1 | 42% |
| 2 | 14% | ||
| 3 | 0% | ||
| 0 | 10% | ||
| 1 | 61% | ||
| 4 | 2 | 2 | 29% |
| 3 | 0% | ||
| 0 | 14% | ||
| 5 | 1 | 1 | 86% |
Table 11 Data extraction and classification tools
| Tool Name | URL |
| Parsifal | https://parsif.al/ |
| Protégé | https://protege.stanford.edu/ |
| BibExcel | https://homepage.univie.ac.at/juan.gorraiz/bibexcel |
| MS Excel | https://products.office.com/en/excel |
| IBM SPSS | https://www.ibm.com/analytics/spss-statistics-software |
| CAug | http://islab.ceit.aut.ac.ir/qat-sms |
3.2 The Conducting Phase
Once the planning and evaluation phases are completed, SMS can start. It is time consuming and costly to perform a complicated process without using suitable tools, which may fail to provide the required accuracy and quality. The use of a convenient tool can improve the accuracy and acceleration of the process and reduce its cost. SMS is a relatively complicated and time-consuming process with unreliable results if not appropriately managed. Accordingly, the use of suitable tools facilitates the SMS process and reduces human errors. There are various tools for performing SMS and SLR, each with advantages and disadvantages. Table 11 presents the tools used in different parts of the SMS process. In this stage, the SMS planning process is defined using the Parsifal tool. The main advantage of Parsifal is that it covers the SMS process completely. More details about these tools are provided in Appendix F.
3.2.1 Conducting the search
The initial set of studies in this field is identified based on the search strategy defined in the first stage. The first author performs this activity by conducting an informal search of the database provided in Table 1. In the first stage, 391 studies are identified based on the search strings determined in Table 1. The identified studies are loaded on Parsifal and the study selection process begins. Based on the study selection process, 42 studies are identified as included in this stage. Subsequently, three backward snowballing steps are performed, identifying 30 and 12 studies, including studies in the first and second stages. Finally, from 869 identified studies, 101 are selected as the final included studies.
3.2.2 Evaluating the search process
The evaluation of the search process and study section is performed by one student in our laboratory and is reviewed by the third author. As previously mentioned, the test set method is employed for the evaluation. The test set is collected from studies conducted by pioneering researchers in this field. As a result, 2544 studies are extracted, including the entire studies conducted by the identified researchers, without applying the search string. The collected studies are loaded on the Parsifal tool and investigated, of which forty-seven studies are applied. However, four studies did not exist on the list of identified studies. The snowballing technique is used in the identified studies. Accordingly, five studies are added to the list of definitive studies, resulting in a total number of studies 106. Finally, the similarity between the recovered studies is acceptable, above 91% in the proposed method.
3.2.3 Data extraction
The items provided in Table 3, including the author’s name, publication year, and publication place, are directly extracted from the Parsifal tool in this stage. Activities 1 and 2 in Figure 4 are applied to the included studies to extract suitable keywords and map them to appropriate concepts. Activities 1 and 2 are performed by the first author and reviewed by the second and third authors, respectively. Activity 4 is carried out using the CAug tool. CAug extracts the list of concepts from each study and augments them using an ontology.
In the concept augmentation process, each concept is augmented to the ontology root by using a list of its parent concepts. The same concepts are removed to create a list of augmented concepts. All included studies are used as inputs for the classification process.
3.2.4 Classification
Table 12 presents the inputs and outputs of the activities in Figure 4, along with the tools. Column 1 indicates the activity numbers according to Figure 2, and column 2 provides the corresponding tool. The other columns provide the inputs and outputs of these activities. The data is prepared for classification and analysis using the BibExcel software package (Astrom et al., 2009). Moreover, occurrence matrices are created using Excel. The classification is then performed using SPSS.
Table 12 Data extraction and classification activities
| No | Tools | Input | Output |
| 1 | Parsifal (by authors) | Keywords | Suitable Keywords |
| 2 | Parsifal (by authors) | Suitable Keywords | Concepts List |
| 3 | Parsifal | Included Papers | Excel Records |
| 4 | CAug | Concepts List | Augmented Concepts List |
| 5 | BibExcel | Excel Records | DIALOG format |
| 5 | BibExcel | DIALOG format | Augmented Concepts List |
| 6 | BibExcel | Augmented Concepts List | High Frequency Augmented Concepts |
| 7 | BibExcel | High Frequency Augmented Concepts | Occurrence Matrix |
| 8 | MS Excel | Occurrence Matrix | Co-occurrence Matrix |
| 9 | MS Excel | Co-occurrence Matrix | Normalized Co-occurrence Matrix |
| 10 | SPSS | Normalized Co-occurrence Matrix | Concepts Clusters |
We run this algorithm until we reach balanced clusters to obtain the number of clusters. Eventually, five clusters are determined as optimal. Table 13 presents these clusters and their related concepts. The “QAT Approach,” “QAT Development,” “QAT Model,” “QAT Framework,” and “QAT Algorithm” are the five clusters that are identified based on the included studies. Subsequently, the studies are classified based on their closeness to clusters. Some studies may fit into more than one cluster. However, the most suitable cluster is selected by investigating the concepts and abstracts. This decision is made and reviewed by the first and second authors. The inputs and outputs of SMS activities are available at http://islab.ceit.aut.ac.ir/qat-sms/.
4 Results of the SMS
This section investigates the SMS results in response to the research question. In response to Question 1, subsection 4.1. introduces the identified research topics in the field of QAT, along with their sub-topics and related studies. Subsequently, in response to Question 2, Subsection 4.2. Introduces research gaps in the field. In Subsection 4.3, based on the results of the previous two sections, a QAT research tree is introduced. Finally, Subsection 4.4. classifies studies based on their authors’ names, publication years, publication locations, and countries.
Table 13 Concepts and classifications
| Id | Category | Concepts |
| 1 | QAT Approach | Tracing_Approach, NFR_Tracing_Approach, Custom_Approach, Software_Architecture_Approach |
| 2 | QAT Development | Software_Engineering_Activity, Trace_Activity, Trace_Creation, Pattern |
| 3 | QAT Model | Architectural_Element, Trace_Model, Trace_Infrastructure, Model, Trace_Strategy_Model, Architectural_DecisionTrace_Visualization_Model, Trace_Graph |
| 4 | QAT Framework | Framework, NFR_Requirement_Management_Framework, Requirement_Engineering_Activity, Engineering_Paradigm, Requirement_Specification, Requirement_Management_Framework, |
| 5 | QAT Algorithm | Algorithm, Trace_Retrieval_Algorithm, Trace_Algorithm |
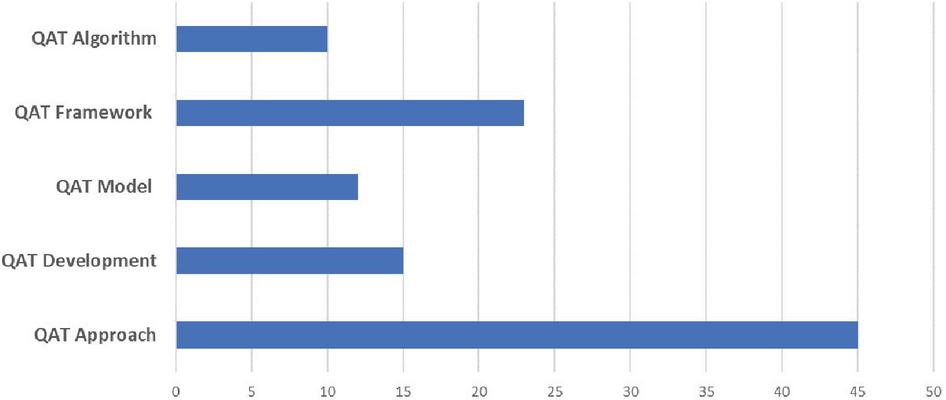
Figure 6 Number of studies based on their main topics.
Table 14 Annual distribution of articles by their main topics
| Category | ||||||
| QAT | QAT | QAT | QAT | QAT | ||
| Approach | Development | Model | Framework | Algorithm | Total | |
| 1991 | 0 | 0 | 0 | 1 | 0 | 1 |
| 1992 | 0 | 0 | 0 | 1 | 0 | 1 |
| 1994 | 1 | 0 | 0 | 0 | 0 | 1 |
| 1995 | 0 | 0 | 0 | 1 | 0 | 1 |
| 1996 | 1 | 0 | 0 | 0 | 0 | 1 |
| 1997 | 0 | 0 | 1 | 0 | 0 | 1 |
| 1998 | 1 | 0 | 0 | 1 | 1 | 3 |
| 1999 | 3 | 1 | 0 | 0 | 0 | 4 |
| 2000 | 1 | 0 | 0 | 0 | 0 | 1 |
| 2001 | 2 | 0 | 0 | 2 | 0 | 4 |
| 2003 | 4 | 1 | 1 | 0 | 0 | 6 |
| 2004 | 3 | 0 | 0 | 0 | 0 | 3 |
| 2005 | 5 | 0 | 0 | 0 | 1 | 6 |
| 2006 | 0 | 1 | 1 | 1 | 0 | 3 |
| 2007 | 4 | 0 | 0 | 0 | 0 | 4 |
| 2008 | 4 | 0 | 0 | 1 | 0 | 5 |
| 2009 | 3 | 0 | 0 | 0 | 1 | 4 |
| 2010 | 0 | 1 | 0 | 0 | 0 | 1 |
| 2011 | 2 | 1 | 2 | 1 | 0 | 6 |
| 2012 | 3 | 0 | 1 | 1 | 1 | 6 |
| 2013 | 2 | 0 | 1 | 0 | 2 | 5 |
| 2014 | 0 | 1 | 2 | 0 | 0 | 3 |
| 2015 | 1 | 2 | 2 | 0 | 1 | 6 |
| 2016 | 0 | 1 | 1 | 1 | 3 | 6 |
| 2017 | 1 | 2 | 1 | 0 | 0 | 4 |
| 2018 | 0 | 0 | 0 | 2 | 0 | 2 |
| 2019 | 1 | 2 | 0 | 3 | 0 | 6 |
| 2020 | 1 | 1 | 0 | 3 | 0 | 5 |
| 2021 | 2 | 1 | 0 | 2 | 0 | 5 |
| 2022 | 0 | 0 | 0 | 2 | 0 | 2 |
4.1 Identifying Research Topics
Table 13 lists the main research topics identified in the QAT, along with the concepts of each category. The five main classes are QAT approach, QAT development, QAT model, QAT framework, and QAT algorithm. Figure 6 shows the number of studies in each of these five categories. Table 14 shows the annual distribution of articles by subject. Figure 7 shows the research topics identified as trees.
4.1.1 QAT approach
Studies on different QAT approaches fall into this category and are classified into two essential sub-categories: “custom approaches” and “software architecture-based approaches.” Custom approaches can be divided into explicit and implicit methods. For example, in (Cleland-Huang et al., 2003), a custom event-based approach is provided. The primary purpose of this study is to introduce an impact analysis technique. Therefore, this study used an implicit approach. In addition, this study proposes an event-based method for the automatic traceability of performance quality attributes. Therefore, it is included in the custom approach sub-category as an event-based approach.
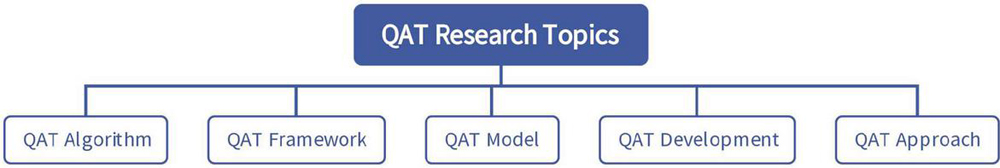
Figure 7 QAT research topics.
We review another article in this category (Navarro et al., 2007). The primary purpose of this study is to create traceability between software architecture and quality attributes; therefore, this is an explicit approach. On the other hand, this paper presents an aspect-oriented approach to extracting architecture from requirements with QAT support. Therefore, this article is included in the custom approaches category under the title of aspect-oriented approach.
In the “software architecture-based approaches,” the software architecture and the related concerns are the cornerstones of the proposed approach. For instance, the main objective of (Kazman et al., 1998) study is to perform an architectural evaluation by presenting an ATAM method. In this method, the suitability of the software is evaluated using quality attributes, such as modifiability, availability, and performance. ATAM implicitly distinguishes and maintains trace links between the quality scenarios and architectural elements. Therefore, in addition to the software architecture-based approach, this study adopts an implicit approach.
4.1.2 QAT development
The primary purpose of papers in this category is to cover one or more activities of the traceability development process: traceability creation, maintenance, integrity, and usage fall in this cluster. The most important part of the literature in this cluster is related to the application of tracing patterns in the development of QAT. For example, in (Klein et al., 1999), a quality model is added to a structure based on architectural patterns that controls the behavior of system components based on the desired patterns. This structure implicitly provides the QAT. In contrast, other studies (Fletcher and Cleland-Huang, 2006), (Mehdi Mirakhorli and Cleland-Huang, 2011), and (M. Mirakhorli and Cleland-Huang, 2016) provided explicit QAT using the proposed traceability pattern for quality attributes.
Other studies focus on traceability recovery. Mirakhorli et al. introduced a mechanism to identify architectural tactics from the source code, enabling QAT (Mehdi Mirakhorli et al., 2014). Another study presents a new idea to decompose functional models and identify the trace links between the components and non-functional requirements, entitled “traceability link mining” (Yazawa et al., 2017). Some researchers have considered the evolution and maintenance of QAT links. Blouin et al. (2017) proposed a semi-automated technique for the evolution of QAT links (Blouin et al., 2017).
4.1.3 QAT model
Models and meta-models are topics of particular interest in QAT studies. For example, Dermeval et al. (2013) present meta-models to describe how to create traceability links between quality attributes and other software artifacts (Dermeval et al., 2013). This paper presents a unified meta-model for architectural design decisions documentation. This meta-model is specified in Eclipse Modeling Framework notation (ECORE). One of the important models in this field is the The traceability information model (TIM). TIM is a graph that defines the types of allowed trace links and relationship artifacts. Constructing a TIM that is fit for purpose is crucial to ensure that a traceability strategy yields the desired benefits. Mirakhorli et al. have proposed a special type of TIM as tactic traceability information model (tTIM) that facilitates the creation and maintenance of quality attribute links (M. Mirakhorli and Cleland-Huang, 2011). A tTIM provides a reusable infrastructure of trace links around a commonly architectural tactic for tracing an architectural tactics into the design.
Some studies in this field are used utility trees and Softgoals interdependency graph (SIG) as a QAT model. These models are implicitly used in QAT-related activities such as traceability management and visualization. Djouab et al. have proposed a method for quality requirements identification from business goals (Djouab et al., 2016). In this study, utility tree are used for tracing QAs to business goals. Another study presents a traceability approach dedicated to the composition of models by softgoal trees (Laghouaouta et al., 2017).
4.1.4 QAT framework
The proposed framework can be classified into three main categories: The first category is “Requirements Management Frameworks.” The second category includes a framework that covers relevant activities to manage quality attributes. The third category includes frameworks that specify the quality attributes. The articles in the first category cover some or all the activities related to requirements engineering, and their primary purpose is not the QAT. However, they also include activities relevant to the QAT. For instance, (Haley et al., 2008) presented a framework for requirements engineering related to security quality attributes. This framework provides the implicit traceability of this quality attribute. (Islam et al., 2011) also proposes a requirement engineering framework for the extraction and traceability of security quality attributes based on several rules and regulations. An additional study by (Veleda and Cysneiros, 2019) presented an ontology-based framework for quality attribute engineering that provides quality attributes to be traced explicitly.
The second category includes the frameworks for quality attribute management. These frameworks include activities relevant to the quality attribute management process as in the first category. Traceability is one of the most significant activities associated with the requirements management process and is implicitly or explicitly presented in the framework related to this category. For instance, (Ebert, 1998) proposed a framework for managing quality attributes, including QAT. Another study presents a framework for security management in open-source software that explicitly addresses traceability. The third category covers frameworks proposed to describe quality attributes and provide explicit or implicit QAT. An old framework in this category is introduced by Chung et al. at the University of Toronto (Chung and do Prado Leite, 2009). This framework represents the quality attributes in the form of soft goals. Each soft goal can have a positive or negative influence on the realization of other soft goals. Furthermore, all soft goals are defined by their relationships in the SIG structure. This structure provides a hierarchical decomposition of Soft Goals. The first level includes quality attributes and the middle level contains more specific soft goals. Lower level heuristics must be implemented to meet one or more soft goals (Chung, 1991) and (Mylopoulos et al., 1992).
Several studies in this field have employed the NFR framework for the QAT. (Cysneiros et al., 2001) attempted to integrate quality attributes into data and object-oriented models, inspired by the NFR framework and goal-oriented strategy. This approach also implicitly provides a QAT. In another study by (Yrjönen and Merilinna, n.d.), NFR+ is presented with an improvement of the NFR framework. The primary purpose of this framework is to fill gaps in the NFR framework. Other studies in this field have suggested various frameworks. For example, a framework for managing non-functional requirements also enables the QAT proposed by (Ebert, 1998).
4.1.5 QAT algorithm
In recent years, traceability research communities have conducted comprehensive research on the development and enhancement of trace algorithms. Most of this research is related to trace retrieval algorithms between functional requirements and additional software artifacts. Seminal studies mainly use “Information Retrieval” techniques. In these algorithms, trace retrieval is based on determining the degree of similarity between the trace query and elements in destination artifacts. Vector space models (VSM), latent semantic indexing (LSI), and latent Dirichlet allocation (LDA) are examples of algorithms used in this category (Cleland-Huang et al., 2014).
Mahmoud et al. propose an information retrieval-based algorithm to identify, categorize, and trace non-functional requirements (Anas Mahmoud and Williams, 2016) And (A. Mahmoud, 2015). This study extracts the system’s quality attributes based on the semantics held in a functional requirement specification. Subsequently, trace links between the quality attributes and source code elements are established based on the calculation of semantic similarity.
In W. Wang et al. (2018), the efficiency of the trace link retrieval algorithm to trace the dependability quality attribute increase by adding relevant feedback. Kaiya et al. propose the TCM concept to measure and trace quality attributes in the natural language requirements description (Kaiya et al., 2009). TCM is used as infrastructure to maintain domain knowledge. This study uses the LSA technique to design and sustain the TCM.
Newer algorithms in this field use artificial intelligence methods to retrieve the trace links. SWARM techniques (Sultanov et al., 2011), heuristic rules (Spanoudakis et al., 2004), and machine learning algorithms are examples of artificial intelligence applications in this field. Mirakhorli et al. employ a machine-learning algorithm to identify classes related to architectural tactics from source code (M. Mirakhorli et al., 2012).
Moreover, a light structural analysis was applied to this algorithm to increase the detection accuracy. Another study utilizes a machine-learning algorithm to identify tactic-related classes and map these classes to tactic traceability patterns (Mehdi Mirakhorli, 2013). In another study, machine learning techniques train a classifier to retrieve trace links (Wieloch et al., 2013).
4.2 Identifying Research Gaps
To identify research gaps, we need a sufficiently comprehensive research tree in the QAT field. As discussed in section Two, no comprehensive secondary study in this area has provided such a structure. Cleland-Huang et al. have conducted research on software traceability to identify trends and future directions in this field (Cleland-Huang et al., 2014). They have divided the traceability life cycle into three activities: (1) planning and management, (2) creating and maintaining, and (3) using.
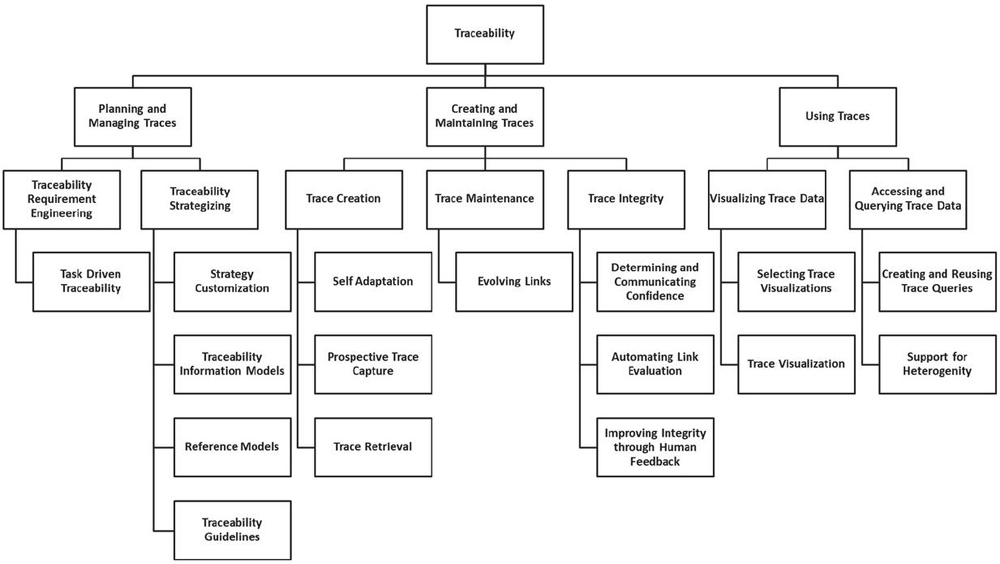
Figure 8 The software traceability trends tree (STT tree).
According to this classification, seven research trends that introduce neglected research needs in software traceability have been identified. Each research trend is associated with a set of research directions. Figure 8 shows the results of this study as a Software Traceability Trends tree (STT tree). QAT is a sub-topic of software traceability, so it inherits research topics in this area. As mentioned in Section 3.1.6, one of the primary sources of the proposed ontology is the study (Cleland-Huang et al., 2014). Therefore, a defined concept exists for each node of the STT tree in the QAT ontology. Therefore, to identify the challenges of the QAT domain, we map the final selected articles to the STT tree nodes. This mapping is conducted based on the key concepts of the article and identifies research gaps in the QAT area. Few studies have focused on tree nodes, indicating research gaps in this area.
Figures 9 to 11 show the number of studies mapped to the different levels of the STT tree. For example, in Figure 9, the leaves of the STT tree are considered. According to this chart, no research has been done on “Strategy Customization”, “Self-Adaptation,” and “Determining and Communicating Confidence” so far. Figure 10 shows the research gaps in the QAT based on the seven research trends in the STT tree. Based on these data, “Trace Maintenance”, “Trace Integrity”, “Accessing and Querying Trace Data”, and “Understanding Stakeholder Needs” are QAT research gaps. Finally, Figure 11 shows that the least amount of research has been done on the “Using Traces” subject. Figure 12 shows the percentage of studies conducted on research topics identified in Section 4.1. According to this chart, the minor research work has been done on the “QAT Algorithms” and “QAT Models”.
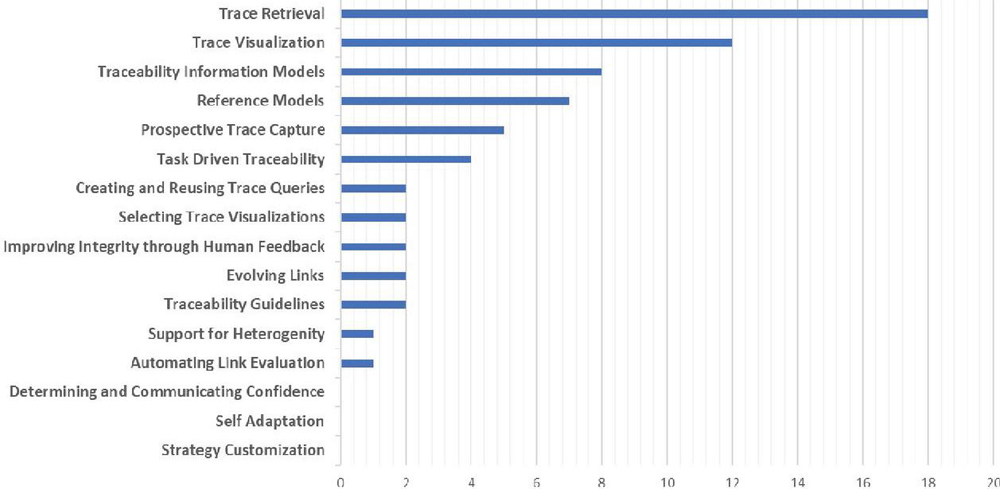
Figure 9 The QAT research gaps (based on the STT tree leaves).
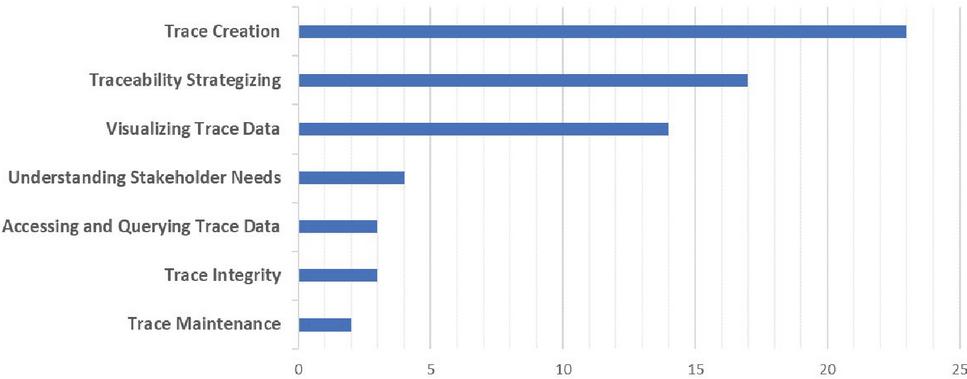
Figure 10 The QAT research gaps (based on seven research trends of the STT tree).
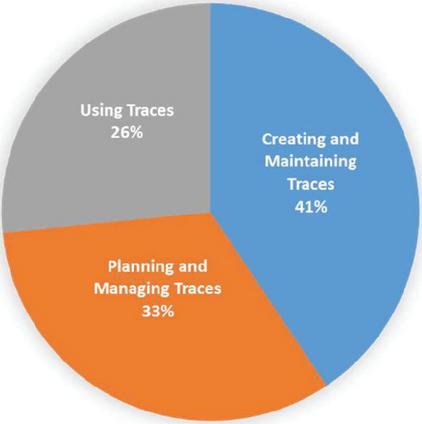
Figure 11 The QAT research gaps.

Figure 12 QAT study percentages based on their topics.
4.3 Identifying QAT Research Tree
Figure 13 shows the QAT research tree. This tree combines the research topics identified in Section 4.1, with the STT tree in Section 4.2. This integration is performed manually using QAT ontology.
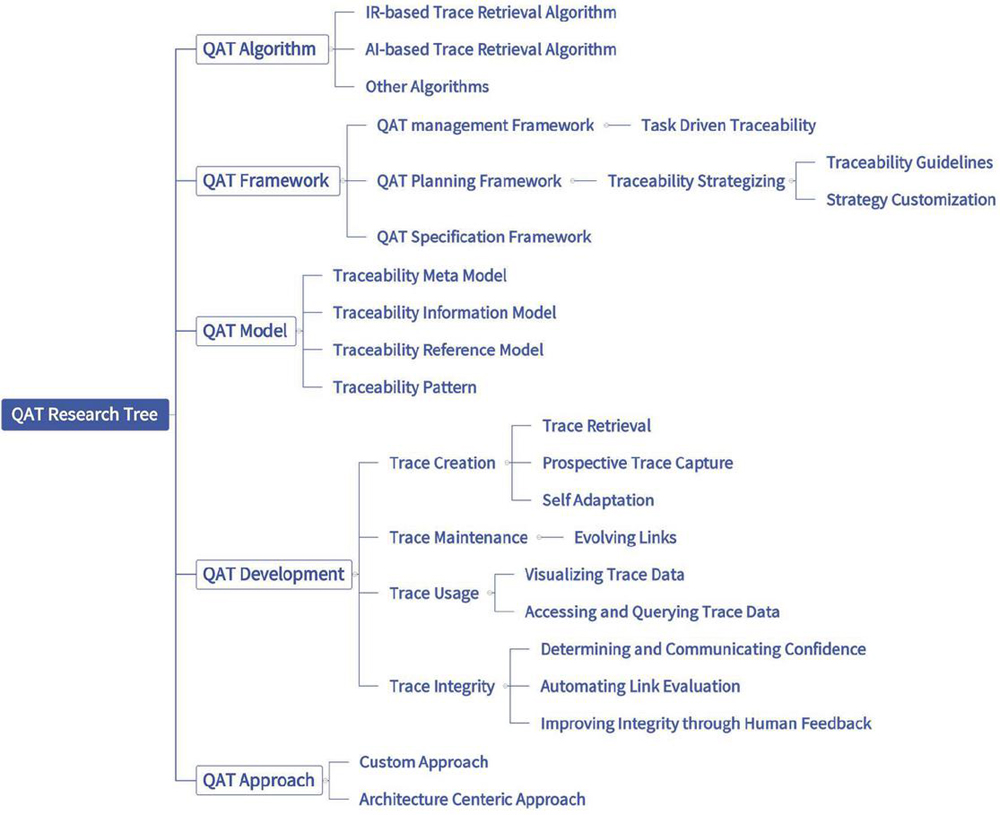
Figure 13 QAT research tree.
4.4 Identifying Active Countries, Individuals, and Places
The geographical distribution, authors, and publication places of studies are investigated To respond to Questions 3 to 5 in part 3.1.1. Geographical distribution can help researchers select their preferred research locations. Figure 14 demonstrates the geographical distribution of the studies, in which 33% of the studies were conducted in the US, followed by Canada, Brazil, and Spain.
The investigation of pioneer researchers in this field could be helpful for individuals who want to enter a new area. A total of 212 unique authors were identified by extracting authors’ names from the included studies. Table 15 lists the top six researchers in this field and the number of their studies on the five research topics in Subsection 4.1. Table 16 shows the most repeated conferences in QAT and Table 17 provides the most repeated journals.
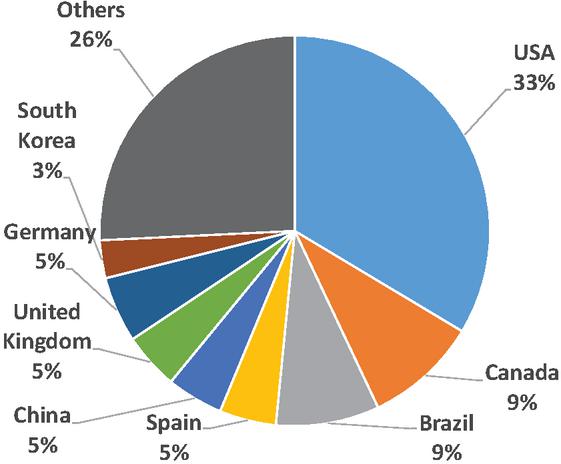
Figure 14 The geographical distribution of the studies.
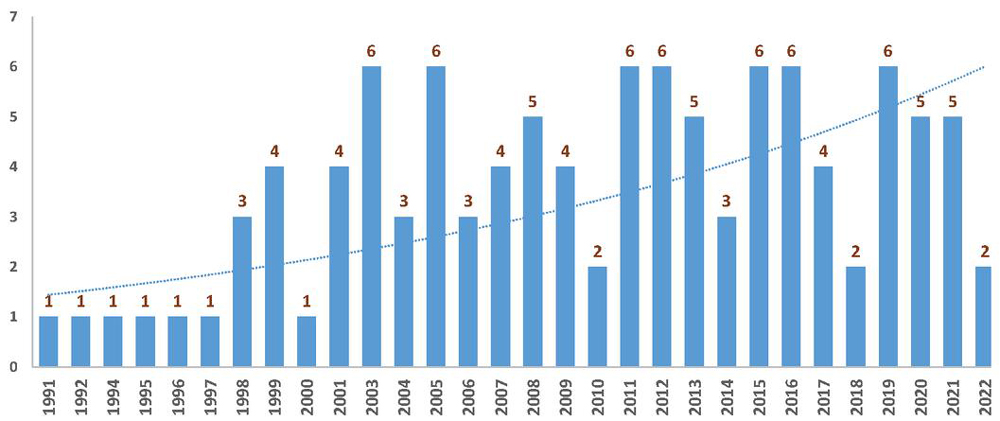
Figure 15 The number of studies per year.
Table 15 Active investigators by topic
| QAT | QAT | QAT | QAT | QAT | ||
| Approach | Development | Model | Framework | Algorithm | Total | |
| Cleland-Huang, J. | 7 | 5 | 2 | 0 | 2 | 16 |
| Mirakhorli, M. | 5 | 5 | 2 | 0 | 3 | 15 |
| Chung, L. | 1 | 1 | 1 | 5 | 0 | 8 |
| Kazman, R. | 6 | 1 | 0 | 0 | 0 | 7 |
| Leite, J.C.S.D.P. | 2 | 2 | 1 | 1 | 0 | 6 |
| Cysneiros, L.M. | 2 | 0 | 0 | 2 | 0 | 4 |
Table 16 Active conferences by topic
| QAT | QAT | QAT | QAT | QAT | |||
| Approach | Development | Model | Framework | Algorithm | Total | ||
| ICSE | A | 5 | 2 | 1 | 0 | 3 | 11 |
| RE | A | 2 | 3 | 0 | 1 | 2 | 8 |
| WICSA | A | 4 | 0 | 0 | 0 | 1 | 5 |
| ASE | A | 2 | 1 | 0 | 0 | 1 | 4 |
| CaiSE | A | 0 | 0 | 0 | 3 | 1 | 4 |
| MODELS | A | 1 | 0 | 0 | 2 | 0 | 3 |
Table 17 Active journals by topic
| QAT | QAT | QAT | QAT | QAT | ||
| Approach | Development | Model | Framework | Algorithm | Total | |
| Requirements Engineering (Q1) | 3 | 0 | 2 | 1 | 1 | 7 |
| Information and Software Tech (Q1) | 4 | 0 | 0 | 2 | 0 | 6 |
| IEEE Transactions on Software Eng. (Q1) | 3 | 1 | 0 | 2 | 0 | 6 |
| Journal of Systems and Software (Q1) | 3 | 0 | 1 | 1 | 0 | 5 |
| Software and Systems Modeling (Q1) | 1 | 0 | 1 | 1 | 0 | 3 |
| IEEE Access (Q2) | 1 | 1 | 0 | 2 | 0 | 4 |
| Annals of Software Engineering (Q2) | 1 | 0 | 1 | 0 | 0 | 2 |
5 Analysis of Results
This section investigates the results.
5.1 The QAT Research Tree
The most significant outcome of this study is the presentation of a research tree in the QAT field. The research topics and gaps in this field are presented in the research tree, and the identified articles are mapped to relevant issues. The five main branches of this tree are identified using SMS. These five topics that make up the first level of the research tree are: “QAT Approach,” “QAT Development,” “QAT Model,” “QAT Framework,” and “QAT Algorithm.”
To complete the QAT research tree, we need to identify research gaps in this area. QAT is a sub-discipline of software traceability, and it can inherit its research trends. Therefore, we can add research trends in software traceability to the QAT research tree. One of the secondary studies in this field introduces seven research trends related to software traceability (Cleland-Huang et al., 2014). In addition, we use the classification provided by Mirakhorli and Huang to complete the QAT research tree (Mehdi Mirakhorli and Cleland-Huang, 2012). Eventually, each of the included papers is mapped to a related sub-topic in the QAT research tree.
The QAT approach is one of the research topics of this study. The mapped articles on this topic present a novel approach to QAT. The existing methods in this field are classified into two categories, including custom and architectural-based approaches (Mehdi Mirakhorli and Cleland-Huang, 2012). Relevant studies in each of these two categories could indicate an explicit or implicit approach to QAT.
QAT development is another identified research topic, and its sub-topics are trace creation, trace maintenance, trace usage, trace integrity, and trace patterns. This pattern is a significant concept that is used in multiple development process activities. Most studies focus on trace creation and usage in this category, and a few studies have focused on trace integrity and trace maintenance.
The third research topic in this study is the QAT model. An essential portion of relevant research in this category introduces meta-models for QAT. The TIM is one of the most notable meta-models in this field. This graph defines various trace artifacts, trace links, and authorized trace relationships associated with a project to enable trace queries and relevant traceability activities. TTIM meta-models are developed based on TIM and are used for QAT based on architectural tactics. SIG, utility trees, and knowledge graphs are additional models that have been used in this field. These models, which are proposed for describing, modeling, or extracting requirements, implicitly provide a QAT. Reference models have been considered in several studies in this field. Furthermore, these models present guidelines and use best practices to obtain an optimal solution for the QAT.
The QAT framework is another main research topic of this study. QAT management frameworks, QAT planning frameworks, and QAT specification frameworks are the three types of frameworks that cover research in this category. It is worth mentioning the use or upgrades of the NFR framework in most relevant research in this field. Nevertheless, NFR is a traditional framework for describing quality attributes and cannot provide a comprehensive traceability solution for quality attributes. Therefore, there is a lack of framework for QAT in this category. Fortunately, the results of this study show that the most recent studies are related to QAT frameworks.
The most recent research topic is the QAT algorithm. Research on QAT algorithms reflects that the focus of researchers has been on information retrieval and machine learning algorithms. Therefore, other algorithms, such as rule-based and ontology-based algorithms, can be viewed by researchers in this field.
5.2 Investigating the Research Status
Requirement traceability is an old and relatively mature research field in which many researchers have conducted studies. However, as a sub-discipline in this field, QAT still has numerous unsolved challenges. As shown in Figure 15, this field of research is of interest to researchers. Solving the challenges in this field can contribute considerably to the development of the software industry. Examining the results in Section 4 can be considered from various perspectives. Most studies in this field have been conducted by “Jane Cleland-Huang” and “Mehdi Mirakhorli”. Together with “Lawrence Chung,” these two authors have conducted at least one study in the four identified categories. “Requirements Engineering” is the prestigious leading journal in this field and has the highest number of relevant studies, followed by “Information and Software Technology” and “IEEE Transactions on Software Engineering”. The ICSE, RE, and WICSA conferences have the highest number of published papers.
6 Evaluating the Semantically Enhanced SMS
In this section, we evaluate the proposed semantically enhanced SMS. A few things should be considered to evaluate the proposed approach. The first is that concept classification requires more activities than keyword classification. Activities related to ontology construction, keyword mapping and concept augmentation require more effort than the traditional approach. But the noteworthy point is that these activities have the ability to be automated and can be done with high speed and accuracy by the techniques and tools of the field of ontology. On the other hand, achieving higher quality in the field of systematic mapping studies can justify spending more time and cost. Therefore, according to the above, this evaluation is done only based on information retrieval criteria and in order to check the quality improvement of the proposed approach.
For this purpose, we perform a traditional keywords classification process on the final collection of articles. Also, an expert examines keywords and concepts in each category to evaluate the classification results. Metrics used for evaluation include precision, recall, and f-measure.
| (1) | ||
| (2) | ||
| (3) |
The parameters A, B, and C used in the above metrics are described in Table 18.
Table 18 Used parameters
| Parameter | Parameter Description |
| A | The classification process result, and the expert agree with the keyword/concept in the category |
| B | The classification process result does not agree with the keyword/concept in the category, but the expert agrees |
| C | The classification process result agrees with the keyword/concept in the category, but the expert does not |
Parameter A indicates the number of keywords assigned to the same category by the classification process and the expert in the keyword classification process. Also, in the concept’s classification process, this parameter indicates the number of concepts jointly placed in a category by the process and the expert. The other parameters of Table 18 are calculated in the same way.
Tables 19 and 20 show the precision, recall, and f-measure for classifying keywords and concepts. These criteria are calculated based on the selection of 5 clusters in the clustering process and are shown in Table 19. The results show that the metrics calculated in the concepts classification provide better results. Also, Repeating the clustering process with 6 clusters indicates that the results obtained in the concept classification process are better or equivalent to the results of keyword classification.
Table 19 Comparison of classification methods (5 clusters)
| Concepts Classification | Keywords Classification | |||||
| Cluster Number | f-Measure | Recall | Precision | f-Measure | Recall | Precision |
| 1 | 0.89 | 1 | 0.80 | 0.77 | 0.83 | 0.71 |
| 2 | 0.80 | 1 | 0.67 | 0.74 | 0.76 | 0.72 |
| 3 | 0.80 | 0.75 | 0.86 | 0.73 | 0.67 | 0.80 |
| 4 | 0.67 | 0.5 | 1.00 | 0.78 | 0.76 | 0.80 |
| 5 | 1.00 | 1 | 1.00 | 0.78 | 0.82 | 0.75 |
Table 20 Comparison of classification methods (6 clusters)
| Concepts Classification | Keywords Classification | |||||
| Cluster Number | f-Measure | Recall | Precision | f-Measure | Recall | Precision |
| 1 | 0.89 | 0.80 | 1.00 | 0.75 | 0.71 | 0.80 |
| 2 | 0.77 | 0.71 | 0.83 | 0.71 | 0.73 | 0.69 |
| 3 | 0.71 | 0.75 | 0.67 | 0.64 | 0.57 | 0.73 |
| 4 | 0.77 | 0.83 | 0.71 | 0.67 | 0.64 | 0.69 |
| 5 | 0.80 | 0.80 | 0.80 | 0.80 | 0.83 | 0.77 |
| 6 | 0.77 | 0.83 | 0.71 | 0.74 | 0.7 | 0.78 |
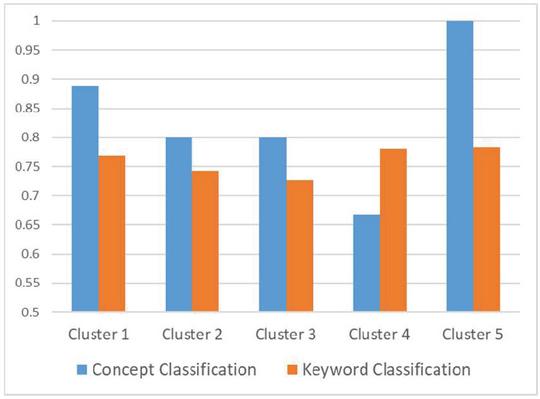
Figure 16 F-measure comparison with 5 cluster.
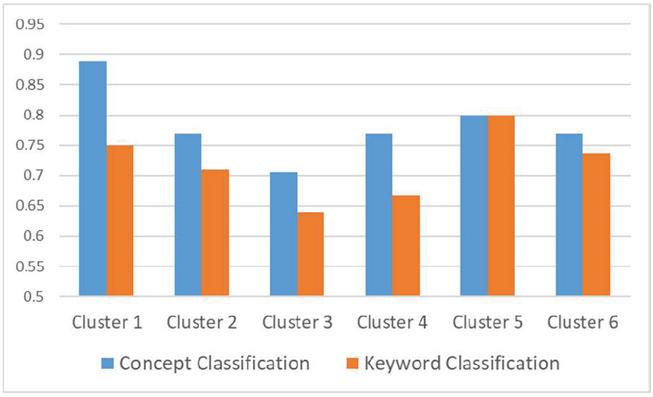
Figure 17 F-measure comparison with 6 cluster.
7 Threats to Validity
A flawed search process, and thus an incomplete set of identified studies, is the most critical threat to the validity of a systematic review article. The search strategy used in the present study is based on the guidelines proposed by Petersen et al. (2015b). According to this guideline, relevant studies are identified using manual search and snowballing techniques. In addition, the search string is updated based on new keywords during this process. Thus, domain-related studies are less likely to be overlooked based on this strategy.
Additionally, two reviewers separately investigate the inclusion or exclusion of studies to evaluate the studies. Disputed cases are resolved by consensus at a meeting. Thus, the author’s opinion resolves threats arising from the incorrect understanding of a study or bias in the results. Despite this strategy, studies published in specific conferences or journals, or belonging to a pioneer researcher in the field, may be absent from the final list. Thus, as mentioned in Subsection 3.3.2, a parallel process is performed to find relevant studies using the test set method in cooperation with a student who is not a member of the study team. According to this process, pioneer researchers in this field have been identified, extracting their QAT-related studies, and comparing them to the studies collected by the search strategy. As a result, five new studies were added to included studies.
8 Conclusion and Future Work
The present study was a semantically enhanced SMS in the field of QAT conducted to identify research topics, research gaps, pioneer researchers, active conferences and journals, and active countries in this field. Among the 882 studies identified by the search and evaluation processes, 106 were relevant. The data required to respond to the research questions are extracted and processed in Tables 14–17 and Figures 6–15.
The first group of individuals who benefit from responding to this question is QAT researchers. Avoiding duplication of efforts and focusing on issues in this area are important achievements for researchers. On the other hand, Practitioners by observing trends and gaps, play a role in improving the quality of software products by offering practical solutions. A research tree was proposed to respond to the question of providing easy and non-complex access for all enthusiasts in this area.
This article had two primary outcomes. First, it presents an SMS study in the QAT for the first time. The results of this SMS provide trends, gaps and a research tree in this field.
The second achievement is to improve the SMS process by providing a semantic approach. The evaluation shows that this semantic approach has improved the results.
The main challenge of conducting SMS in the field of QAT is that there is relatively little relevant research in this field.
The main objective of this study is to pave the way for researchers in QAT field to address the existing gaps by reviewing the research done in this field. Further studies should include an SLR in QAT. Also, the semantic approach can be extended to cover the entire SMS process.
Appendix
Some vital information is provided in Appendices A–F. The supplementary materials are available at http://islab.ceit.aut.ac.ir/qat-sms/.
Appendix F. SMS Tools Review
F1. Parsifal Tool: This is an online tool designed to support researchers dedicated to conducting review and mapping studies in software engineering. This tool documents the entire process and suggests essential steps for the researcher. It is feasible to define objectives, research questions, search strings, and keywords throughout the planning process, and determine the sources and limits of inclusion and exclusion. It also provides mechanisms for developing quality assessment checklists and data mining forms. Throughout the conducting stage, it provides the search, importing BibTeX files, determining the state of rejecting or accepting articles, identifying duplicate studies, performing a qualitative evaluation, extracting data, and analyzing data. It is also possible to report the results in the reporting section. An additional feature of this tool is the ability to add several users to perform the process in groups and access the results at any time and place via the internet. Moreover, this tool is integrated with Scopus and science direct.
F2. BibExcel: A robust tool designed to examine bibliographic data. The tool contains a toolbox that presents field extraction, fundamental analysis, citation analysis, co-occurrence calculation, bibliometric coupling, and cluster analysis in various bibliographic formats. A significant advantage of this tool is its ease of installation and usage.
F3. IBM SPSS: SPSS is the most popular statistical analysis software. SPSS is one of the oldest statistical analysis software packages that can perform stunning descriptive information statistics, including plotting various charts and calculations related to the mean, standard deviation, variance, and median. Furthermore, data management and mining are other features of the software. A significant feature of this software is the implementation of various clustering methods. In this study, this tool is used for hierarchical clustering.
F4. CAug: This tool, which uses the abbreviated form of concept augmentation, was developed by the first author of this article. This tool produces an augmented list of relevant concepts according to an ontology, and receives a list of keywords.
Footnotes
1Center of excellence for software traceability, http://www.CoEST.org.
References
Astrom, F., Danell, R., Larsen, B., and Schneider, J.W. (2009). Celebrating scholarly communication studies. A Festschrift for Olle Persson at His 60th Birthday 5.
Barbacci, M., Klein, M., and Weinstock, C. B. (1997). Principles for Evaluating the Quality Attributes of a Software Architecture. https://doi.org/10.21236/ada324233
Barforush, A.A., and Rahnama, A. (2012). Ontology Learning: Revisted. J. Web Eng. 269–289.
Blouin, D., Barkowski, M., Schneider, M., Giese, H., Dyck, J., Borde, E., Tamzalit, D., and Noppen, J. (2017). A Semi-Automated Approach for the Co-Refinement of Requirements and Architecture Models. 2017 IEEE 25th International Requirements Engineering Conference Workshops (REW), 36–45. https://doi.org/10.1109/REW.2017.52
Borg, M., Runeson, P., and Ardö, A. (2014). Recovering from a decade: A systematic mapping of information retrieval approaches to software traceability. Empirical Software Engineering, 19(6), 1565–1616. https://doi.org/10.1007/s10664-013-9255-y
Charalampidou, S., Ampatzoglou, A., Karountzos, E., and Avgeriou, P. (2021). Empirical studies on software traceability: A mapping study. Journal of Software: Evolution and Process, n/a(n/a), e2294. https://doi.org/10.1002/smr.2294
Chung, L. (1991). Representation and utilization of non-functional requirements for information system design. In R. Andersen, J. A. Bubenko, and A. Sølvberg (Eds.), Advanced Information Systems Engineering (pp. 5–30). Springer Berlin Heidelberg.
Chung, L., and do Prado Leite, J. C. S. (2009). On Non-Functional Requirements in Software Engineering. In A. T. Borgida, V. K. Chaudhri, P. Giorgini, and E. S. Yu (Eds.), Conceptual Modeling: Foundations and Applications: Essays in Honor of John Mylopoulos (pp. 363–379). Springer. https://doi.org/10.1007/978-3-642-02463-4\_19
Cleland-Huang, J., Settimi, R., BenKhadra, O., Berezhanskaya, E., and Christina, S. (2005). Goal-centric traceability for managing non-functional requirements. In Proceedings. 27th International Conference on Software Engineering, 2005. ICSE 2005., pp. 362–371.
Cleland-Huang, J., Mirakhorli, M., Czauderna, A., and Wieloch, M. (2013). Decision-Centric Traceability of architectural concerns. In 2013 7th International Workshop on Traceability in Emerging Forms of Software Engineering (TEFSE), pp. 5–11.
Cleland-Huang, J., Gotel, O.C.Z., Huffman Hayes, J., Mäder, P., and Zisman, A. (2014). Software Traceability: Trends and Future Directions. In Proceedings of the on Future of Software Engineering, (New York, NY, USA: ACM), pp. 55–69.
Cleland-Huang, J., K. Chang, C., and C. Wise, J. (2003). Automating performance-related impact analysis through event based traceability. Requirements Engineering, 8(3), 171–182. https://doi.org/10.1007/s00766-003-0175-z
Cysneiros, L. M., do Prado Leite, J. C. S., and de Melo Sabat Neto, J. (2001). A Framework for Integrating Non-Functional Requirements into Conceptual Models. Requirements Engineering, 6(2), 97–115. https://doi.org/10.1007/s007660170008
Corcho, O., Fernández-López, M., Gómez-Pérez, A., 2003. Methodologies, tools and languages for building ontologies. Where is their meeting point? Data Knowl. Eng. 46, 41–64. https://doi.org/10.1016/S0169-023X(02)00195-7
Dermeval, D., Castro, J., Silva, C., Pimentel, J., Bittencourt, I. I., Brito, P., Elias, E., Tenório, T., and Pedro, A. (2013). On the Use of Metamodeling for Relating Requirements and Architectural Design Decisions. Proceedings of the 28th Annual ACM Symposium on Applied Computing, 1278–1283. https://doi.org/10.1145/2480362.2480601
Ebert, C. (1998). Putting requirement management into praxis: Dealing with non-functional requirements. Information and Software Technology, 40(3), 175–185. https://doi.org/10.1016/S0950-5849(98)00049-4
Fletcher, J., and Cleland-Huang, J. (2006). Softgoal Traceability Patterns. 2006 17th International Symposium on Software Reliability Engineering, 363–374. https://doi.org/10.1109/ISSRE.2006.42
Haley, C., Laney, R., Moffett, J., and Nuseibeh, B. (2008). Security Requirements Engineering: A Framework for Representation and Analysis. IEEE Transactions on Software Engineering, 34(1), 133–153. https://doi.org/10.1109/TSE.2007.70754
IEEE Standard for a Software Quality Metrics Methodology. (1998). IEEE Std 1061-1998, i-. https://doi.org/10.1109/IEEESTD.1998.243394
IEEE Standard Glossary of Software Engineering Terminology. (1990). IEEE Std 610.12-1990, 1–84. https://doi.org/10.1109/IEEESTD.1990.101064
Islam, S., Mouratidis, H., and Jürjens, J. (2011). A framework to support alignment of secure software engineering with legal regulations. Software and Systems Modeling, 10(3), 369–394. https://doi.org/10.1007/s10270-010-0154-z
Kaiya, H., Tanigawa, M., Suzuki, S., Sato, T., and Kaijiri, K. (2009). Spectrum Analysis for Quality Requirements by Using a Term-Characteristics Map. In P. van Eck, J. Gordijn, and R. Wieringa (Eds.), Advanced Information Systems Engineering (pp. 546–560). Springer Berlin Heidelberg.
Kazman, R., Bass, L., Abowd, G., and Webb, M. (1994). SAAM: a method for analyzing the properties of software architectures. In Proceedings of 16th International Conference on Software Engineering, pp. 81–90.
Kazman, R., Klein, M., Barbacci, M., Longstaff, T., Lipson, H., and Carriere, J. (1998). The architecture tradeoff analysis method. Proceedings. Fourth IEEE International Conference on Engineering of Complex Computer Systems (Cat. No.98EX193), 68–78. https://doi.org/10.1109/ICECCS.1998.706657
Klein, M. H., Kazman, R., Bass, L., Carriere, J., Barbacci, M., and Lipson, H. (1999). Attribute-Based Architecture Styles. In P. Donohoe (Ed.), Software Architecture: TC2 First Working IFIP Conference on Software Architecture (WICSA1) 22–24 February 1999, San Antonio, Texas, USA (pp. 225–243). Springer US. https://doi.org/10.1007/978-0-387-35563-4\_13
Kitchenham, B., Pretorius, R., Budgen, D., Pearl Brereton, O., Turner, M., Niazi, M., and Linkman, S. (2010). Systematic literature reviews in software engineering – A tertiary study. Information and Software Technology 52, 792–805.
Kitchenham, B.A., Dyba, T., and Jorgensen, M. (2004). Evidence-based software engineering. In Proceedings. 26th International Conference on Software Engineering, pp. 273–281.
Mahmoud, A. (2015). An information theoretic approach for extracting and tracing non-functional requirements. 2015 IEEE 23rd International Requirements Engineering Conference (RE), 36–45. https://doi.org/10.1109/RE.2015.7320406
Mahmoud, Anas, and Williams, G. (2016). Detecting, classifying, and tracing non-functional software requirements. Requirements Engineering, 21(3), 357–381. https://doi.org/10.1007/s00766-016-0252-8
Mirakhorli, M., and Cleland-Huang, J. (2011). Transforming Trace Information in Architectural Documents into Re-usable and Effective Traceability Links. In Proceedings of the 6th International Workshop on Sharing and Reusing Architectural Knowledge, (New York, NY, USA: ACM), pp. 45–52.
Mirakhorli, M., and Cleland-Huang, J. (2012). Tracing Non-Functional Requirements. In Software and Systems Traceability, J. Cleland-Huang, O. Gotel, and A. Zisman, eds. (London: Springer), pp. 299–320.
Mirakhorli, M., and Cleland-Huang, J. (2016). Detecting, Tracing, and Monitoring Architectural Tactics in Code. IEEE Transactions on Software Engineering, 42(3), 205–220. https://doi.org/10.1109/TSE.2015.2479217
Mirakhorli, M., and Cleland-Huang, J. (2011). Using tactic traceability information models to reduce the risk of architectural degradation during system maintenance. 2011 27th IEEE International Conference on Software Maintenance (ICSM), 123–132. https://doi.org/10.1109/ICSM.2011.6080779
Mirakhorli, M., Shin, Y., Cleland-Huang, J., and Cinar, M. (2012). A tactic-centric approach for automating traceability of quality concerns. 2012 34th International Conference on Software Engineering (ICSE), 639–649. https://doi.org/10.1109/ICSE.2012.6227153
Mirakhorli, Mehdi. (2013). Preventing erosion of architectural tactics through their strategic implementation, preservation, and visualization. 2013 28th IEEE/ACM International Conference on Automated Software Engineering (ASE), 762–765. https://doi.org/10.1109/ASE.2013.6693152
Mirakhorli, Mehdi, and Cleland-Huang, J. (2011). A pattern system for tracing architectural concerns. Proceedings of the 18th Conference on Pattern Languages of Programs, 1–10. https://doi.org/10.1145/2578903.2579143
Mirakhorli, Mehdi, Fakhry, A., Grechko, A., Wieloch, M., and Cleland-Huang, J. (2014). Archie: A Tool for Detecting, Monitoring, and Preserving Architecturally Significant Code. Proceedings of the 22Nd ACM SIGSOFT International Symposium on Foundations of Software Engineering, 739–742. https://doi.org/10.1145/2635868.2661671
Mylopoulos, J., Chung, L., and Nixon, B. (1992). Representing and using non-functional requirements: A process-oriented approach. IEEE Transactions on Software Engineering, 18(6), 483–497. https://doi.org/10.1109/32.142871
Namdar, S., and Mirakhorli, M. (2015). Toward Actionable Software Architecture Traceability. In 2015 IEEE/ACM 8th International Symposium on Software and Systems Traceability, pp. 36–42.
Navarro, E., Letelier, P., and Ramos, I. (2007). Requirements and Scenarios: Running Aspect-Oriented Software Architectures. 2007 Working IEEE/IFIP Conference on Software Architecture (WICSA’07), 23–23. https://doi.org/10.1109/WICSA.2007.36
Oh, J., and Kang, S. (2014). A Hierarchical Model for Traceability Between Requirements and Architecture. In Proceedings of the 29th Annual ACM Symposium on Applied Computing, (New York, NY, USA: ACM), pp. 1035–1042.
Park, G., Chung, L., Hong, J.-E., Garrido, J.L., and Noguera, M. (2016). Problem-Aware Traceability in Goal-Oriented Requirements Engineering. In SEKE, pp. 569–574.
Petersen, K., Vakkalanka, S., and Kuzniarz, L. (2015a). Guidelines for conducting systematic mapping studies in software engineering: An update. Information and Software Technology 64, 1–18.
Rahnama, A., and Barforoush, A.A. (2015). A NOVEL ONTOLOGY EVOLUTION METHODOLOGY. J. Web Eng. 301–324.
Sardinha, A., Yu, Y., Niu, N., and Rashid, A. (2012). EA-tracer: Identifying Traceability Links Between Code Aspects and Early Aspects. In Proceedings of the 27th Annual ACM Symposium on Applied Computing, (New York, NY, USA: ACM), pp. 1035–1042.
Spanoudakis, G., Zisman, A., Pérez-Miñana, E., and Krause, P. (2004). Rule-based generation of requirements traceability relations. Journal of Systems and Software, 72(2), 105–127. https://doi.org/10.1016/S0164-1212(03)00242-5
Sultanov, H., Hayes, J. H., and Kong, W.-K. (2011). Application of swarm techniques to requirements tracing. Requirements Engineering, 16(3), 209–226. https://doi.org/10.1007/s00766-011-0121-4
Vale, T., de Almeida, E. S., Alves, V., Kulesza, U., Niu, N., and de Lima, R. (2017). Software product lines traceability: A systematic mapping study. Information and Software Technology, 84, 1–18. https://doi.org/10.1016/j.infsof.2016.12.004
Veleda, R., and Cysneiros, L.M. (2019). Towards an Ontology-Based Approach for Eliciting Possible Solutions to Non-Functional Requirements. In Advanced Information Systems Engineering, P. Giorgini, and B. Weber, eds. (Cham: Springer International Publishing), pp. 145–161.
Wang, B., Peng, R., Li, Y., Lai, H., and Wang, Z. (2018). Requirements traceability technologies and technology transfer decision support: A systematic review. Journal of Systems and Software, 146, 59–79. https://doi.org/10.1016/j.jss.2018.09.001
Wang, W., Gupta, A., Niu, N., Xu, L. D., Cheng, J. C., and Niu, Z. (2018). Automatically Tracing Dependability Requirements via Term-Based Relevance Feedback. IEEE Transactions on Industrial Informatics, 14(1), 342–349. https://doi.org/10.1109/TII.2016.2637166
Wieloch, M., Amornborvornwong, S., and Cleland-Huang, J. (2013). Trace-by-classification: A machine learning approach to generate trace links for frequently occurring software artifacts. 2013 7th International Workshop on Traceability in Emerging Forms of Software Engineering (TEFSE), 110–114. https://doi.org/10.1109/TEFSE.2013.6620165
Yazawa, Y., Ogata, S., Okano, K., Kaiya, H., and Washizaki, H. (2017). Traceability Link Mining—Focusing on Usability. 2017 IEEE 41st Annual Computer Software and Applications Conference (COMPSAC), 2, 286–287. https://doi.org/10.1109/COMPSAC.2017.254
Yrjönen, A., and Merilinna, J. (n.d.). Extending the NFR Framework with Measurable Non Functional Requirements.
Biographies

Ehsan Sharifi is a Ph.D. Candidate of Software Engineering at the Computer Engineering, Amirkabir University of Technology, Tehran, Iran. He worked as a researcher and Software Engineer in Iran. His research interests include software engineering, software architecture, software quality, web engineering and ontology engineering.

Ahmad Abdollahzadeh Barforoush is a professor of Software Engineering at the Computer Engineering, Amirkabir University of Technology, Tehran, Iran. He received his Ph.D. in Computer Science from the University of Bristol in England. He worked as a senior researcher and Software Engineer in Iran. His research interests include software engineering, software quality, ontology engineering, and business intelligence. He has published several articles in refereed journals and conferences in these areas.

Haider S. Al Dabbagh received the M.Sc. degree in Computer Science and Technology from the Faculty of Computer Science, University of Mysore, India in 2010. He is currently a Ph.D. candidate in the Computer Engineering Dept. at Amirkabir Technical University, Iran. Since His research interests span Software Engineering, Quality Engineering, Microservices architecture, the Internet of Things, and Software Sustainability.
Journal of Web Engineering, Vol. 21_6, 1853–1912.
doi: 10.13052/jwe1540-9589.2165
© 2022 River Publishers