Semantically Enriched Keyword Prefetching Based on Usage and Domain Knowledge
Sonia Setia1,*, Jyoti2, Neelam Duhan2, Aman Anand3 and Nikita Verma4
1Department of Computer Science and Engineering, SET, Sharda University, Greater Noida, Uttar Pradesh, India, 201310
2Faculty of Computer Science, J. C. Bose University of Science and Technology, YMCA, Faridabad, India, 121006
3ITS Engineering College, Greater Noida, Uttar Pradesh, India, 201310
4Greater Noida Institute of Technology, Engineering Institute, Greater Noida, Uttar Pradesh, India, 201310
E-mail: setiasonia53@gmail.com; justjyoti.verma@gmail.com; neelam.duhan@gmail.com; amananand0609@gmail.com; nikita.verma0@gmail.com
*Corresponding Author
Received 30 August 2022; Accepted 13 March 2024
Abstract
In intelligent web systems [2], web prefetching [27] plays a crucial role. In order to make accurate predictions for web prefetching, it is important but challenging to uncover valuable information from web use statistics [16]. Using statistics and domain expertise, this study presents a new approach dubbed SPUDK for efficient prefetching. In this paper, it is shown how web access logs can be used efficiently for browsing prediction. Our main focus is on the technique needed to manage the queries found in web access logs so that valuable information can be attained. We further process these access logs using a taxonomy and a thesaurus, WordNet, to find the semantics of queries. SPUDK, a system that organises use data into semantic clusters, is one example of this approach. Our contributions in this paper are as follows: (1) A technique to exploit query keywords from access logs. (2) An approach to enrich queries with semantic information. (3) A new similarity measure for finding similarity among URLs present in access logs. (4) A novel clustering technique to find semantic clusters of URLs. (5) Experimental evaluation of the proposed system. The proposed SPUDK system is evaluated using American Online (AOL) logs, which gives improvement of 39% in precision of prediction, 35% in hit ratio and reduction of 50.6% in latency on average as compared to other prediction techniques in the literature.
Keywords: Semantic prediction, web usage mining (WUM), web content mining (WCM), domain knowledge, usage data, access logs.
1 Introduction
People’s reliance on the Internet to exchange information has grown as the web’s popularity has soared. Web users may access an enormous quantity of data, and that volume is growing exponentially. That’s why new efficient techniques are needed to quickly access the information. These days, the prefetching technique has become increasingly popular. The primary purpose of prefetching is to successfully forecast the web sites that will be viewed in the near future and to get those web pages in advance, prior to a user making a request for those web pages. This is accomplished by downloading those web pages.
There are a number of issues which need to be considered while making a prefetching system, such as how to discover information from web usage data and represent that information for making prediction. Currently, search is purely based upon keyword based information retrieval [1] which results in irrelevant information. Semantics can be added to enhance the browsing and querying capability of the World Wide Web. Another consideration is how to acquire taxonomic information relevant for understanding the domain, how to signify as well as utilize the discovered knowledge, and finally, how to create an effective and efficient prefetching system based on the found information.
Using use statistics and domain expertise, we plan on creating SPUDK, a semantic prefetching system. Throughout this paper, we argue that the queries that appear in web access logs are straightforward and helpful [15], therefore these should be considered when generating predictions about web sites. This study demonstrates that by examining the queries sent to a specific page, we may learn about the semantics of that page. As a result, web access logs vary from a basic list of web access sequences. It is impossible to make predictions solely using web access sequences if a user is accessing an undiscovered web page, since these techniques cannot forecast related to this page. The “new-page problem” is the term for this issue.
The prediction of future web pages in SPUDK is not only derived by web access sequences, but by the semantics of the queries given by the user corresponding to the web page to overcome the new-page problem. To introduce semantics in SPUDK, domain knowledge in the form of taxonomy has been used. An improved prefetching system may be achieved by merging domain knowledge with web use statistics, as shown in this research.
As a result of this research, the following are the main findings:
• The primary contribution of this work is an approach that enriches query terms with a taxonomy in order to generate a semantic characterization of each web page. This approach is meant to bridge the conceptual gap that occurs between inquiries and the content of a website page.
• A technique for clustering that utilizes a suggested similarity metric in order to group together a collection of URLs into distinct groups. The suggested similarity metric takes into account several sets of weighted words organized in taxonomic hierarchy. The similarity among sets is not determined by words in the two sets precisely matching one another; rather, it is determined by the total degree to which all of the terms in the first set are similar to all of the terms in the second set. In order to do URL clustering and cut down on the amount of space needed for searches, a two-level clustering approach was suggested.
• A full prefetching system, called SPUDK. Using the bipartite graph technique, a connection has been made between queries and the URLs found in the access logs using the bipartite graph approach. These queries are parsed and keywords are extracted. These extracted keywords are mapped to taxonomy categories which results in more precise descriptive terms. The proposed clustering technique is then applied to these semantically enhanced access logs in order to produce a cluster set of URLs that are similar to one another. Predictions can then be made using the best cluster that matches the user’s provided query.
An overview of this paper’s structure is given in the sections that follow. Section 2 provides the motivation for using queries’ keywords from usage data and domain knowledge for making prediction. Section 3 discusses work related to semantic prefetching. Section 4 presents in detail the approach of the proposed prefetching system, i.e. SPUDK. Section 5 provides an illustration of the proposed system using an example. Experimental results are presented in Section 6, which examines the suggested system’s performance. A few ideas for future research are discussed in Section 7, which brings this study to a close.
2 Motivation
2.1 Motivation for Use of Queries’ Keywords from Usage Data for Making Prediction
Content on the Internet is not descriptive (e.g., multimedia content). If we’re searching for a phone ad, a person, or whatever else, it’s usually a good idea to see what other people are saying about a website. This additional data affects the nature or quality of the linked website in addition to the content in the anchor tag. In the user queries to which it leads, we want the semantics of the web page U to be made accessible. Take the search term “smart phone” as an example and go to web page U. Using the word “smart phone” as a synonym indicates that U is characterised by its semantics. When a large number of people are searching for the same thing, this is more effective. This is known as “collective semantics,” and it’s a kind of semantics.
2.2 Motivation for Use of Domain Knowledge
Keywords are often used to identify web sites. Direct comparisons between keywords and user query phrases are used to find commonalities across web pages. For example, the URL u1 that appears with the list of keywords {snake; desert} will be judged as irrelevant to URL u2 which appears with list {adder; Sahara}; however, it is argued that these two lists of key words (and, thus, pages) are actually related as “adder” is a “snake” and “Sahara” is a “desert,” hence, they have same meaning. A flexible URL matching procedure may be done by putting keywords into taxonomy categories. Mapping using taxonomy keywords has the major benefit of condensing a big number of keywords into a smaller number of categories. A user query is a group of keywords that may also be categorised. Additionally, this mapping decreases the dimensionality issue and permits modest matching different classes rather than “exact keyword matching.”
3 Related Work
In the literature, various prediction systems have been proposed. This section explains the prevalent related work. Authors [4] used the Markov model integrated with the Apriori Algorithm for usage pattern detection. Location-aware low-rank matrix factorization [5] has been used for QoS prediction based web service recommendation. Authors [6] used machine learning for web based prediction.
Researchers have also worked upon hybrid prediction systems [7–9] which combine usage mining, content mining and structure mining to resolve the new-page problem. In [10], authors used an integrated approach for the prediction of web page based upon web logging and sequential rank based selection technique. This research focused on how to improve the overall web performance and the efficiency of usage logs. In the proposed approach, web logging is used to improve the accuracy of predicting the document. A selection technique based on sequential ranking has been used to optimize the prediction for clustered accesses. In this approach, when a user requests a URL, first the prediction engine works out by finding similar web pages of the requested page from access logs. It makes a cluster of these similar pages as per their groups and URL addresses. The frequency of each request from each cluster is then measured. Then, using a sequential rank-based selection technique [11], the cluster with the highest likelihood of anticipating users’ future requests is identified.
Web page prediction was improved by Nguyen et al. [12] who developed a semantically upgraded strategy that used a website’s domain knowledge and web usage statistics. For this purpose, a variety of queries were created. The proposed approaches outperformed typical web use mining-based methods in an experiment, according to the data obtained.
Hu et al. [13] suggested a location prediction system that is scalable for use with web sites. An idea known as term location vectors was presented by the authors as a means of capturing position distributions for all words. Additionally, an automated method was devised to evaluate the significance of each term location vector in terms of location prediction. The suggested framework was empirically tested on a large dataset, and the findings showed that it enhanced accuracy.
Authors [14] presented a software defect prediction method, which predicts problematic code sections. Finding flaws and prioritizing testing may be aided by this software tool. The semantic distinctions between various programs are often overlooked by traditional prediction algorithms. This has a negative impact on the accuracy of these forecasting algorithms. A representation-learning approach has been developed to bridge the gap between semantics and poor prediction characteristics by automatically learning the semantic representations of programs from source code files. Deep belief networks (DBN) are used to learn semantic characteristics using token vectors derived from the programs’ AST (Abstract Syntax Trees).
Authors [15] suggested a semantic illness prediction system based on semantic approaches such as Bio Ontology Annotator, FOL (First Order Logic), and DL (Description Logic). Medical data and habits of teachers may be used to predict the likelihood of a certain ailment. Teachers might benefit from the suggested strategy by being able to catch infections before they become too complex to treat.
| Sr. | Justification in Context | ||
| No. | Method Used | Description | of Research Work |
| 1. | Cost function [10, 11] | Prediction of future request has been made based upon certain factors like the popularity and lifetime of web objects. | It is a very less popular approach for pattern determination and according to that certain factors may require like popularity and lifetimes that is very difficult to achieve and may vary from time to time so this approach is also not suitable in context for proposed research. |
| 2. | Implicit link analysis [14, 15] | In the “implicit link analysis” technique, the importance of a web page is determined by the users who navigate the web page. | It is a very less popular approach for pattern determination. Extra work is required to reorganize the structure of website as per user navigation. |
| 3. | Integration of domain knowledge [12, 13] | By integration of domain knowledge with other methods of prefetching, semantics can be taken into account. This results into more accurate predictions. | It gives useful information based on semantics. Therefore, we are considering the domain knowledge into our research work. |
In addition, especially in regard to the results presented by the previously published related work shown in Table 1, the purpose of this study is to enhance the forecast of the user’s browsing experience during the last decade in order to accomplish the following objectives:
• To enhance the accuracy of prediction in terms of hit ratio
• To reduce network traffic
• To reduce server load
• To reduce prediction time.
4 Proposed SPUDK System
The proposed semantic prefetching prediction system based on usage data and domain knowledge (SPUDK) is discussed in this section. It integrates information about how people use the web with the semantics of the content as expressed by the user’s query and hierarchical taxonomy. The following are the system’s primary selling points:
• The queries that users have entered are examined by this approach to describe the URL pages which have been clicked correspondingly.
• The suggested activity creates connections between queries and URLs found in access logs using a bipartite graph technique. To show web sites based on user interest, the graph is categorised and keywords are collected from queries.
• Clustering can be utilised in access logs to make the cluster collection of the same type of URLs available in order to create predictions for user queries rather than searching for a whole set of URLs. After that, predictions can be made using a collection that closely matches the user’s query. Applying clustering to logs necessitates the usage of a restricted vocabulary in order to consistently separate content.
• Due to this requirement, semantic weighted log records are utilised in our suggested work. These logs utilise conventional logs. Using the bipartite graph procedure, keywords are collected and then inserted into taxonomy categories to establish records of semantic weights. This produces the uniform and constrained vocabulary of the taxonomy that clustering demands. The predictions for the users’ searches are based on these conceptually defined collections.
By doing this, semantically similar content can be added to the system predictions. Therefore, the issues with each of the following approaches are resolved by combining usage data with domain information to create SPUDK:
• User-provided queries and relationships with keywords existing in the access logs are the best ways to capture user interest.
• To capture content semantics utilising taxonomies and thesaurus, access logs have been transformed into semantic weighted log records. This makes it possible for the system to predict documents using semantic similarity rather than keyword matching. Customers can now pick from a wide range of very relevant predictions as a consequence.
In general, the SPUDK model operates in two phases as shown:
• Offline phase
This begins by extracting queries from access logs that describe a web page in relation to a user’s view and the URL that corresponds to it. Bipartite graphs are used to extract queries and URLs from logs, which are subsequently parsed by the system to provide query terms. Each keyword’s weight is determined by how often users click on the keyword’s URL.
The semantic weighted log records are then produced by mapping these keywords to terms in the pre-defined domain taxonomy using Wordnet as thesaurus. The only difference between semantic weighted log records and processed access logs is that the former contain the terms and weights assigned to them by the given taxonomy. In semantic weighted log records, data mining techniques like clustering are applied, resulting in a set of URL collections organised according to concepts connected to taxonomy. These collections are employed to create a user-provided predicted list of queries.
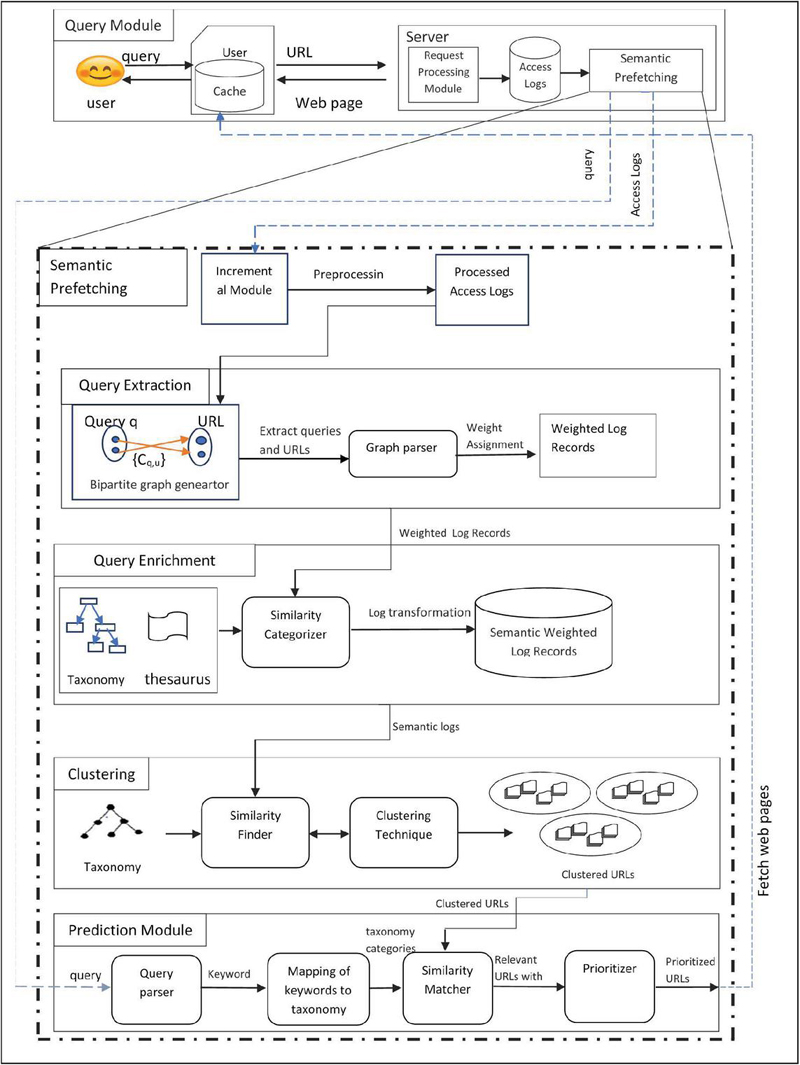
Figure 1 SPUDK system.
• Online phase
The user enters a search query during this step. Afterward, the query is archived. The matching web page is restored if it is present in the cache. As an alternative, the request is sent to the server to be handled by it.
The same query has since been sent to the SPUDK prediction module. The keyword-based query will be converted into the proper taxonomy words by this module. Then, a similarity matcher will be given these terms along with collections of URLs acquired during the offline phase. This matcher generates a list of matched URLs that are then prioritised based on the established weights.
The prediction mechanism is operative close to the server. The prediction model’s initial input is a set of access logs. Its incremental module works to regularly update the logs. Only newly added entries are taken into account for each additional module execution. There are many different modules engaged in the proposed approach, which may be shown in Figure 1. These modules are working together to determine a feasible and correct solution for the issues outlined above.
4.1 Query Extraction Module
Use data is examined from a fresh viewpoint in the form of searches that users have made to characterize the URL sites that they have visited. This activity is introduced in [16] which uses a bipartite graph process to build relationships between queries and URLs contained in access logs. The graph is categorized and keywords are extracted from queries, which are used to display web pages based on user interest. The prediction mechanism is operative close to the server. The prediction model’s initial input is a set of access logs. Its incremental module works to regularly update the logs. Only newly added entries are taken into account for each additional module execution.
This module works with several steps as follows:
1. Preprocessing: At first, this module accepts input in the form of access logs. Each time a user requests a web page, a record is added to the logs. The various log fields [17] are anonymous user id, date and time, requested query, item rank, server that was accessed, and user-clicked URL corresponding to the requested query. Each log entry is processed by removing the stopwords and extracting the requested query, and then clicking the corresponding URL. PL (processed logs) are used to store the data.
2. Bipartite graph generation: Queries Q along with URLs U from PL are connected in a bipartite graph produced. The bipartite graph was selected since it aids in the comprehension of the information and closes the semantic gap between searches along with web page content by using rich data from the user’s click activity to develop predictions from queries and user behaviour data. Each time you don’t have to scan logs, you’re freeing up space and simplifying things. It is also computed while the graph is being built, to demonstrate how much confidence the user has in the query – or how near it is to visited URLs. Links between Q and U show that URLs and searches are clicked on. A query-URL click graph is the name given to the bipartite graph that was generated (C-graph). The resulting C-graph has the following nomenclature:
• Q {q, q, …q}
• U {u, u, …u}
• C is an edge depicting number of clicks between U and Q.
As an instance, consider the following: Q {q, q} and U {u, u, u}. Figure 2 shows an example of a C-graph.
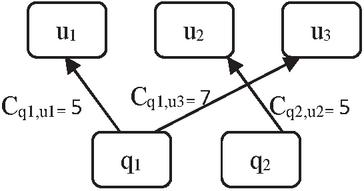
Figure 2 Example of C-graph.
C indicates that the URL u was clicked five times in response to query q, as shown by the label on the edge q, u.
1. Query parsing: There are N-grams connected with each query contained in the C-graph that represent the content of URLs (NC-graph).
2. Weight assignment: Based on the frequency of query clicks, as demonstrated on the edges of C in the C-graph, weights were given in query to every other N-gram, represented in NC-graph. For every N-gram C query, a single click count is allocated C that is identical to the number of clicks between URL u and N-gram n it refers to (Cq,u). For instance, the query q is broken down into N-grams n and n that provide the NC-graph shown in Figure 3. Figure 2 shows that C, hence its N-grams, C and C are also 5.
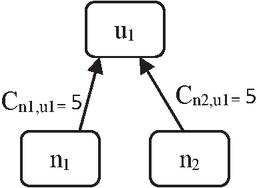
Figure 3 Example of an NC-graph.
For every URL “u”, a weighted vector is constructed that includes weighted N-gram W. Moreover, W is also calculated by summing the click counts of the N-grams (C) originating from various URL searches.
After that, the values are rescaled by normalizing the weighted N-grams (1).
| (1) |
// Calculated by dividing the total number of clicks on phrases that appear in inquiries for the URL u by n, u
here,
URL is represented by u,
for query, one N-gram is represented by n,
v is defined as a term
A list of all N-grams relating to the URL u various queries, as defined by V.
All N-grams of the query q is represented by N
Weight of N-gram n in the URL u is represented by w
For URL u, click count of every term is represented by C
A weighted log is then generated, which comprises URLs, N-grams, their weights, and their respective N-grams and their weighted logs.
Definition 1: Query, date and time, URL and rank are all part of a collection of vectors known as access logs, where id is the anonymous user id, query is the one that was asked by user, date and time is the time and day at which the server was visited, and rank is the item’s rank.
Definition 2: Requests for documents on the web are represented by (query, URL) in the processed access logs. The URL corresponds to the document’s identification as it appears on the internet and is clicked by users.
Definition 3: Query in a URL click graph (C-graph), each node represents the number of times a user has clicked C on URL to get the information they were looking for, and each edge represents the number of times a user has clicked C on a URL to get the information they were looking for.
Definition 4: An N-gram associated with a click-graph (NC-graph) is a bipartite graph which contains (URL U, N-gram N, click count, C), where the URL is the uniform resource locator (URL) of the page as it appears on the World Wide Web and is clicked by the user in response to the requested inquiry and each query in the C-graph is converted into an N-gram, and the number of times a given N-gram N was clicked on the specified URL U is represented by the edge C.
Definition 5: Based on Definitions 3 and 4, the connection weight between the N-gram present in query n N and a URL u U is defined as: where .
Definition 6: Weighted logs are a collection of vectors of the type (URL, N-grams, weight), where URL is the identification of the document as is shown on the World Wide Web and was clicked by the user in response to the requested query, and N-grams and weight are both numeric values. Each query in the C-graph is broken down into N-grams, and the weight of the link between N-grams in query n N and URL u U is defined by the number of times the two are connected.
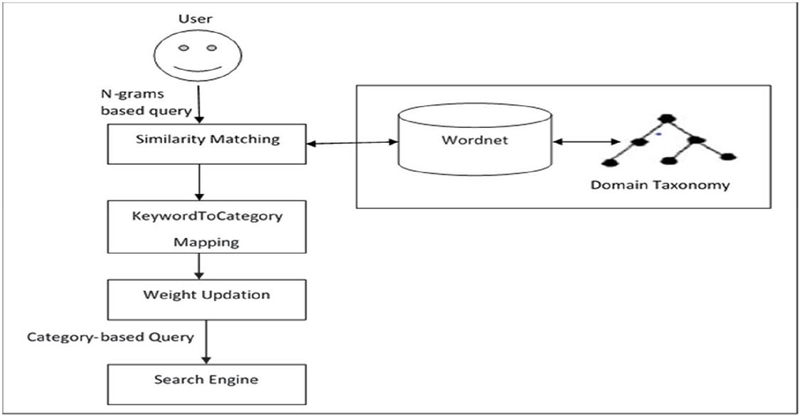
Figure 4 Translation of a keyword-based query to a category-based query.
4.2 Query Enrichment Module
A taxonomy-based approach to query interpretation has been employed in this module and is described in more depth in [18]. The major goal of this effort is to generate more exact queries from a given keyword in order to receive more pertinent and helpful information. In this approach, the categories found in taxonomy have been applied to represent domain taxonomy. The approach is shown in Figure 4.
1. At the first step, it takes N-grams of a query from the weighted logs.
2. These N-grams are mapped to the domain taxonomy’s categories T {c1, …, ck.} in order to get more pertinent information. A similarity matching technique that is based on domain-specific taxonomies and is covered in depth in Section 4.2.2 has been used to complete this mapping. To locate the closest category to a keyword, it employs a thesaurus. Additionally, we used WordNet as a thesaurus, which is covered in Section 4.2.1.
3. Weights are assigned to N-grams in accordance with the frequency of queries connected to URLs in order to better categorise URLs. The weights of the taxonomy categories are therefore modified in accordance with the formula provided in Section 4.2.3. The category-based inquiry that was produced is then forwarded to the search engine in order to obtain more pertinent data on this particular question.
4.2.1 Wordnet
In WordNet, extensions, adjectives, verbs, and English nouns are classified as synsets in an online dictionary application. Each one exemplifies a fundamental notion of knowledge. The word “synsets” refers to a collection of synonyms that expresses a person’s understanding of a certain set of concepts. Hypernymy (super concept)/hyponymy (subconcept) (also called hierarchy/taxonomy) and meronymy (part-of) are all examples of synsets that establish diverse semantic connections (has-a). A collection of sensations is available for each word in WordNet. There are eight verbs and eight nouns in the word “wind.” First, “wind” as a noun indicates that it refers to the movement of the air”’.
Nature phenomenon
Physical phenomenon natural phenomenon
Atmospheric phenomenon
Atmospheric condition
Wind weather; weather condition.
4.2.2 Similarity matching approach
This plays a significant role in our semantic retrieval system. The same matching approach is used to interpret the query. By using the thesaurus’s provided formulas, we determine similarity to determine the closest category in taxonomy T for keyword k.
If a keyword is included in the taxonomy, it is entered exactly as it is. Additionally, the proposed hybrid similarity approach, which combines type-based similarity with path-based similarity, is used to choose the category that most closely resembles the keyword.
• Type-based similarity: If the keyword k is defined as the same name in category c it means that the keyword is directly related to that category, i.e. the keyword is a type of this category. This category is then assigned to the keyword corresponding to the match value 1 and there is no need to calculate the match for other categories.
• Path-based similarity: If a specific synonym is not found, path-based similarities will be identified. The Wu and Palmer similarity scale was used to calculate the similarities between the k, Sn(k) and categories c in T, which measure the similarity between two words. We select a pair (k, c) with highest similarity to map keyword k in the taxonomy.
Using the Wu and Palmer similarity we can compute the path-based similarity between two nodes of the given taxonomy by using following formula:
| (2) |
where LCS is the least common sequence of a and b.
For the keyword to category mapping process, the breadth first search traversal algorithm has been used which considers the categories at top level of taxonomy first. The category with highest similarity is further considered to find the right sub-category. This process is repeated until most appropriate category is found. Finally, the keyword and category pair, i.e. the (k, c) pair providing the highest similarity s is selected.
4.2.3 Weightage of the resulting query
Weight is assigned to the resulting category as per the given formula
| (3) |
where w represents weight of the keyword and s represents the similarity value between the keyword and mapped category.
So each URL is represented as (U, (c, v)) where c is the taxonomical category and v is its weight. Now, weighted log records are enhanced with terms that are a part of the taxonomy which are here called as semantic weighted logs.
Definition 7: Semantic weighted logs is a set of vectors of the form (URL, category, weight), where URL is the identifier of the document as it appears on the World Wide Web, clicked by the user corresponding to the requested query, category represents the taxonomy terms corresponding to query keywords, and weight is the connection weight between category c T and a URL u U.
4.3 Clustering Module
URLs are passed into the clustering module at this stage. Because a similarity measure is required for the operation of any clustering approach, this module is built around two fundamental concepts: the similarity measure and the clustering algorithm. SPUDK’s semantic similarity measure, which broadens the similarity radius by taking the closeness of phrases into account rather than merely looking at binary comparisons, is another important addition. Also included is a two-level clustering approach that uses two separate threshold levels. Increased cluster tightness and reduced computing complexity are goals.
4.3.1 Semantic-similarity measure
There has been a lot of study on this subject. Clustering URLs based on a similarity metric established in [19] is used to identify similarities between taxonomic sets of words.
According to the Wu and Palmer [20] similarity, the proposed measure is convenient to employ in universal computing environments where the idea of taxonomy is represented using a taxonomy model. There are no fake results here. Two words t1 and t2 are compared based on their depth rather on their distance since terms at lower taxonomic levels are more specialised and comparable.
| (4) |
Here, the least common sequence of t1 and t2 is represented by LCS.
In this case, the URLs are defined by a collection of taxonomic terms, for example URL u1 signified by {skiing, resort} along with URL u2 by {dance, hotel}. To identify similarity between two keywords, Wu and Palmer can only compare two words like {resort hotel} and not between two sets of terms {(hotel, dance) (resort, skiing)}. As a result, we can use this scale to compare the similarity between different groups of phrases that describe different things. With this methodology, pairings of phrases from distinct URLs are first created, and then the degree of similarity between them is calculated (using the Wu and Palmer method). This is followed by a process that discovers the most comparable matches between two sets of words, such as creating more pairings between the two sets that are best matched (based on the calculated similarity).
Then we compare two things (i.e., sets of words) in the following ways:
| (5) |
where S(t, t) is the similarity among two terms from separate sets, and t is the best matched term of the other set (U) matching to the t term of set (U).
Weighted words are used to better describe things. Consider the URL below, which has the following weighted set of characteristics: U {(resort, 0.89), (skiing, 0.2)}. URL U, tends to speak more about “resort” than “skiing” because of its lighter weight. The following weighted set U’ {(resort, 0.91), (skiing, 0.91)} shows how relevant both of these phrases are to another URL. We may thus conclude that phrases with a low weight have a less impact on determining the degree of similarity between two URLs. To lessen the overall effect of phrases with low weights, consider their weights when assessing similarity between URLs.
To illustrate, let’s assume that we can get the average weight of term w(t, t) and the best matched term (t) of t from another set by applying Equation (6)
| (6) |
To calculate the degree of similarity between the two sets of weighted words provided below, we may expand the similarity measure presented in (5) as follows.
| (7) |
N-grams, rather than words, may be used to represent objects in the suggested similarity metric, resulting in superior results. Consider the case of URL U1, which symbolises the comic book ‘One Piece,’ and URL U2, which represents the word ‘Japanese.’ Because the ‘One Piece’ comic series is a Japanese one, as a result, there should be more than a 0 similarity between these two URLs. Even if “one” and “piece” do not imply any connection to ‘Japanese’, they are nevertheless used. There are N-grams of phrases [21] that indicate URLs that need to be dealt with. In the above example, representation of URLs in N-grams is as follows: U {one, piece, one_piece} and U {Japanese}. The suggested similarity metric may be used to determine the similarity between these URLs as follows.
Firstly, make pairs of terms (here, N-grams) of two different URLs, i.e. (Japanese one), (Japanese piece), (Japanese one_piece) and calculate the similarity between every pair. In this case, the third pair will display the degree to which these two URLs are similar. Taking into account the N-gram representation of URLs is one way that the suggested similarity metric might potentially provide improved results. In the next sections, however, we shall discuss the phrase “representation of URLs” in order to make the reader’s comprehension of the notion of clustering as clear as possible.
4.3.2 Clustering algorithm
A similarity measure is used to provide information on how close the documents are. However, the clustering algorithm will determine how to make use of values of similarity in this context. In the paper [19], a two-level clustering approach is presented. This approach makes use of our similarity measure to build high-quality clusters in a shorter amount of computing time.
An approach is described that takes DBSCAN one step further by allowing for two-tiered clustering. KingPin dense areas will be identified, and then DBSCAN will be used to detect clusters of URLs inside those regions. This lessens the time and complexity required for DBSCAN while without hindering its performance in any way. At the first level, it locates areas with a high population density by using the threshold “T.” At the second level, it locates clusters by using the minimal similarity “minSim” and the minimum objects “minObj.” These two variables correspond exactly to what DBSCAN refers to as the “Epsilon” and “minpts” values, respectively. The “T” threshold will always be higher than the “minSim” threshold in this case. This is because, in the first place, we locate dense areas (by locating KingPins and their followers) in order to limit the amount of computing complexity that the DBSCAN method requires. At the next level, it functions in the same way as DBSCAN, except in order to identify the clusters, it employs a collection of KingPins rather than the complete dataset directly. Thus,
• At the first level, for specified threshold similarity “T,” this divides the dataset D into groups composed of KingPins “K” along with individuals who follow them.
• At level 2, the clusters that were produced in this manner are eligible for further consolidation.
The following is how the process works.
Level 1: Identification of KingPins and their followers
The dataset (D) is divided into a cluster set of KingPins (KP) using this procedure. The initial set of KingPins (K) is a bare one, and it gets filled up piece by piece. The URL x D is allocated to the cluster signified by k and will become the “follower” of k when the similarity between x and k is higher than a threshold “T.” Despite the fact that there may be a number of these leaders, only the first one met is selected. If, on the other hand, no such KingPin exists or the KingPin set is empty, then x becomes a KingPin of set K. The number of people that follow each KingPin is also kept track of. This technique produces a grouping of KingPins and the people that follow them.
| (8) |
Finding a partition in O(n) time is a significant benefit of this approach. It simply needs to do a single scan of the data from the secondary storage device.
Level 2: Merging clusters using the cluster set approach
However, unlike DBSCAN, our system uses KingPins instead of a whole dataset comprising URLs for this approach. It is able to identify clusters of arbitrary form and noise. Those who are close to KingPins are clustered into a single cluster, while those that don’t fit into any cluster are termed outliers. Both the minimum similarity (“minSim”) and minimum object density (“minObj”) thresholds are required as inputs to this algorithm.
By calculating its similarity with other KingPins (k K), we may determine which KingPins are neighbours of KingPin k for a given “minSim”. In this case, k is the neighbour of k if and only if sim (k, k) minSim. “minObj” denotes the minimal number of URLs necessary in the KingPin follower set in order to achieve the specified level of density. A KingPin must be regarded dense or non-dense as well as its nearby KingPins’ (N(ki)) followers with similarity larger than “minSim” being counted as dense. kK is deemed dense if its follower set (including its neighbours) is higher than “minObj,” i.e. |N(k)| minObj. If a KingPin has a lot of pins, it’s said to be in a cluster. If a non-dense KingPin has a similarity larger than “minSim” to a dense KingPin, it may also be a component of a cluster. Otherwise, it is a noisy outlier.
Due to DBSCAN’s usage of a dataset of n URLs, the computational time is O(n). Our approach, on the other hand, relies on KingPin k, rather than the full URLs included in a dataset. k is a lot smaller than n in this case. As a result, the level 2 running time is O(k). Our suggested two-level clustering algorithm has a total running time of O(n+ k). This is far from the simple DBSCAN, which is just O(n). As a result, the computational cost of our suggested system will be improved.
Two-level clustering has the same space complexity as DBSCAN, i.e. O(n). There is still an O(n k) time complexity when using KingPins, but it is much more manageable when using datasets with many URLs. With the new clustering approach, computational complexity is reduced while cluster quality is maintained.
4.4 Prediction Module
Now, the produced clusters will be used to make semantic predictions about user behaviour instead of using the weighted log records for prediction. The HTTP GET method is used by the user to submit a query to the server based on his interests. As seen in the query module in Figure 5, the server answers with a list of URLs according to the specific query. The prediction module uses this query for further processing when the user is viewing the current page in order to forecast the pages that will be clicked in the near future. The query is first broken down into keywords by the query parser. Then, a set of taxonomy categories are assigned to a set of keywords relating to that query.
Taxonomy terms have now been added to the query. The best match cluster is then found by calculating the degree of similarity between the query and the clusters. Then, in order to respond to the query, only the pertinent cluster is utilised. The system only calculates the query’s similarity to each URL in that cluster. The prioritised URLs are the results, ordered by how closely they match the query. The corresponding web pages are downloaded and cached so that the subsequent user’s request can be handled by the cache.
5 Illustration of the Proposed System Using an Example
Here, an illustration of the proposed semantic prefetching system has been provided to help you comprehend it. Take the sports-focused website www.sportstrip.com as an example. The many URLs connected to the website www.sportstrip.com are displayed in Table 2.
Table 2 Web pages of imaginary web portal www.sportstrip.com
| URL ID | URL |
| URL1 | www.sportstrip.com/affairs/skate.html |
| URL2 | www.sportstrip.com/travel/skate_hotel.html |
| URL3 | www.sportstrip.com/training/skate.html |
| URL4 | www.sportstrip.com/sports/skate.html |
| URL5 | www.sportstrip.com/wintersports/ice-skate.html |
| URL6 | www.sportstrip.com/sale/skateboard.html |
| URL7 | www.sportstrip.com/wintersports/skiing.html |
| URL8 | www.sportstrip.com/sports/tennis.html |
| URL9 | www.sportstrip.com/sale/tennisracket.html |
| URL10 | www.sportstrip.com/sale/skiboots.html |
| URL11 | www.sportstrip.com/atmospheric_cond/tennisracket.html |
| URL12 | www.sportstrip.com/sports/tennis/rules.html |
| URL13 | www.sportstrip.com/training/tennis.html |
Suppose association rule mining is used, and one of the several rules R found using the access logs is of the following format:
R:www.sportstrip.com/sport/skate.html,ww.sportstrip.com/travel/skate_hotel .html www.sportstrip.com/training/skate.html.
Table 2 shows that there are a number of pages that users may find interesting, including /affairs/skate.html and /sale/skateboard.html. These, however, are not on the list offered by the conventional approaches. This typically happens when a webpage is new or does not show up in frequently mined rules using association rules. Identical to the website provided in rule R, www.sportstrip.com/affairs/skate.html and www.sportstrip.com/ travel/hotels.html likewise have semantically similar content. However, because the system does not recognise the similarities between two URLs, it will not provide the user with the same outcome.
This work is an attempt to present an approach that merges usage data and domain knowledge to obtain more contextual information in order to address this deficiency.
In the first stage, keywords describing the URLs shown in Table 2 were extracted and are shown in Table 3. Since weights are only taken into account to prioritise the URLs that are most closely related to the query, they are not displayed in this example.
Table 3 Keywords corresponding to URLs of www.sportstrip.com
| URL ID | URLs | Keywords |
| URL1 | www.sportstrip.com/affairs/skate.html | Affairs, skate, sports |
| URL2 | /travel/skate_hotel.html | Travel, skate, hotel |
| URL3 | /training/skate.html | Training, tutorial, sports, skate |
| URL4 | /sports/skate.html | Sports, skate |
| URL5 | /wintersports/ice-skate.html | Winter, sports, snow, ice-skate |
| URL6 | /sale/skateboard.html | deal, skateboard |
| URL7 | /wintersports/skiing.html | Winter, sports, skiing, ice |
| URL8 | /sports/tennis.html | Sports, tennis |
| URL9 | /sale/tennisracket.html | Sale, tennis, racket |
| URL10 | /sale/skiboots.html | Sale, sports, ski, skiboots |
| URL11 | /atmospheric_cond/tennisracket.html | Atmospheric condition, snow condition |
| URL12 | /sports/tennis/rules.html | Sports, tennis rules |
| URL13 | /training/tennis.html | Sports, training, tennis |
Then, taxonomy categories are added to each URL. Table 4 lists the taxonomy terms used to describe the URLs listed in Table 3.
Table 4 Categories characterizing the web pages of www.sportstrip.com
| URL ID | URLs | Taxonomy Terms |
| URL1 | www.sportstrip.com/affairs/skate.html | Events, skate, sports |
| URL2 | /travel/skate_hotel.html | Trip, skate, resort |
| URL3 | /training/skate.html | Training, skate, sports |
| URL4 | /sports/skate.html | Sports, skate |
| URL5 | /wintersports/ice-skate.html | Winter, sports, ice, skate |
| URL6 | /sale/skateboard.html | deal, skateboard |
| URL7 | /wintersports/skiing.html | Winter, sports, skiing, ice |
| URL8 | /sports/tennis.html | Sports, tennis |
| URL9 | /sale/tennisracket.html | deal, tennis, racket |
| URL10 | /sale/skiboots.html | deal, sports, ski, boots |
| URL11 | /atmospheric_cond/snow.html | weather, ice |
| URL12 | /sports/tennis/rules.html | Sports, tennis, rules |
| URL13 | /training/tennis.html | Sports, training, tennis |
The URLs in Table 4 are divided into three clusters based on their taxonomy keywords after applying the clustering technique to the web pages contained in the imaginary web portal.
C1: {/affairs/skate.html,
/travel/skate_hotel.html,
/sports/skate.html,
/training/skate.html,
/sale/skateboard.html}
C2: {/wintersports/ice-skate.html,
/wintersports/skiing.html,
/sale/skiboots.html
/atmospheric_cond/snow.html}
C3: {/sports/tennis.html,
/sale/tennisracket.html,
/sports/tennisrules.html,
/training/tennis.html}
Let’s utilise the user-provided search term “skating hotel” as an example. The taxonomy terms “t” “skates, resort” are mapped to the keywords “k skates, hotel” that correspond to the supplied query. As a result of calculating the similarity between the query and the clusters, cluster C1 is determined to be the best match cluster for the query that has been enriched with taxonomy words. Instead of checking all URLs at this moment, just those in cluster C1 are used to find the relevant URLs according to the specified query. Prioritized URLs are obtained as shown in Figure 5 once the similarity between the query and URLs in cluster C1 has been calculated.
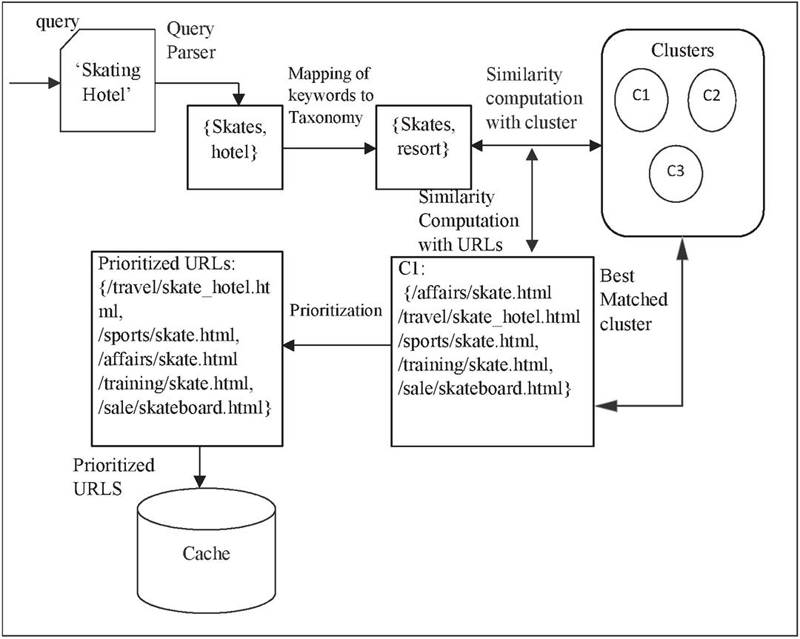
Figure 5 Running example for the user given query.
Instead of merely extracting a set of rules that include URLs, the suggested architecture generates a large number of URLs that are distinguished by the thematic terms that appear to be of interest to users. The URLs that would not otherwise be proposed are taken into account by this approach. A relevant page may be excluded from the prediction list if it has never been visited, as was previously noted. For instance, the query “skate” would take into account any pertinent URLs that are part of the best-matched cluster based on similarity, which in this case is C1. In the light of the aforementioned study, the URLs from the original output list, www.sportstrip.com/training/skate.html, which was previously indicated, have been enlarged to include the URLs in cluster C1, which may be significant for the query.
In order to generate a wide range of predictions, the suggested system explores the semantics of the content information found in usage data. As a result, the prediction model’s accuracy rises, allowing users to access previously prefetched objects in subsequent requests and making efficient use of network bandwidth.
6 Experimental Results
Implementation as well as testing on a large dataset demonstrate the suggested prediction system’s efficacy. Microsoft Visual Studio 12.0 and SQL Server 2012 were utilized to investigate the performance of prediction. Details of the dataset and the metrics used to evaluate prediction performance are provided in this section of the paper. Following subsection finally, presents the impact of SPUDK on precision, hit ratio and latency.
For the purposes of testing, American OnLine (AOL) search logs from the beginning of March 2006 through the end of May 2006 were used. Over the course of three months, 650k users generated 20 million web inquiries. Included in the dataset is [22] (ClickURL, ItemRank, QueryTime, AnonID, Query). The data set is split 80:20 between test set and training set. It was necessary to develop a prediction system using a training set, and it was necessary to perform several test cases on a testing set composed of a variety of query sets. Figure 6 shows a snapshot of the web access logs.
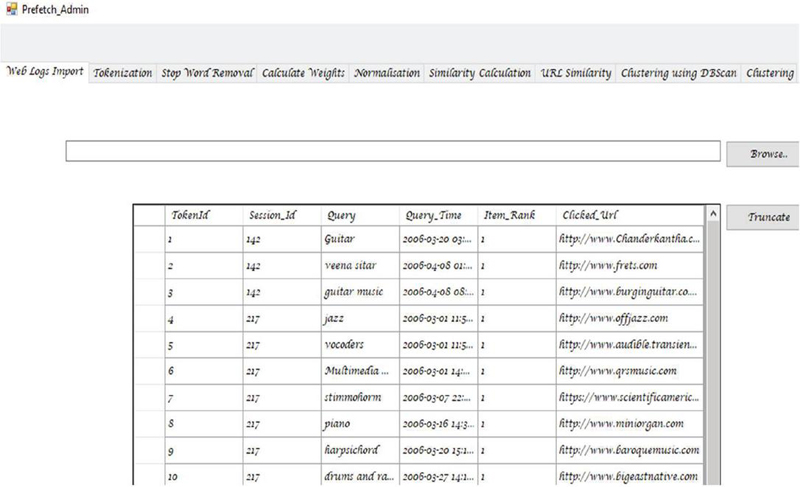
Figure 6 Snapshot of imported web access logs into the proposed system.
6.1 Performance Evaluation
In the literature [23, 24], performance of prediction is measured in terms of two major performance metrics: precision and hit ratio. These metrics have also been utilized to assess the precision of prediction in our own study, where:
Precision: A user’s likelihood of visiting a prefetched page may be gauged using precision. In order to compute precision, you divide the total number of cached requests by the total number of predictions.
| (9) |
Hit ratio: The hit ratio is a helpful metric for determining how likely it is that a user’s request will be fulfilled by the cache’s prefetched pages. By dividing the number of requests discovered in the cache by the total number of requests made by users, the hit ratio can be derived
| (10) |
Evaluation results are provided in following subsections.
6.1.1 Comparison between prefetching systems based on WUM, WCM and SPUDK
There have been many different test cases used to make a comparison between these three systems. There was a test cases series that was executed for a variety of sessions, ranging from shorter ones to longer ones. For the WUM method in our trials, we employed the Markov model-based technique [25] and the association rule mining technique [26]. For the WCM technique, we used the keyword-based approach [26]. As can be seen in Figures 7 and 8, the performance of the suggested model was superior to that of the other two models.
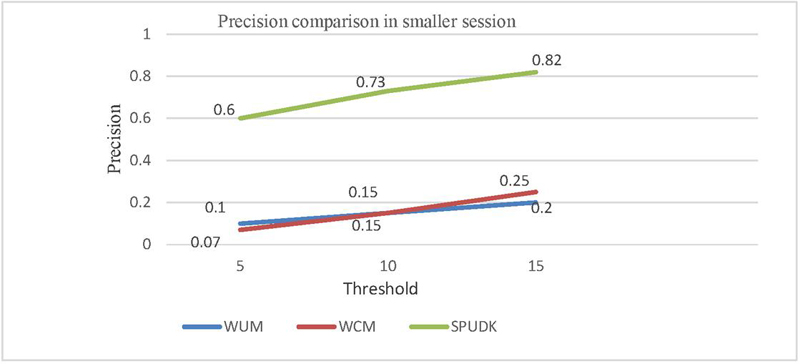
Figure 7(a): Comparison of the precision between WUM, WCM and SPUDK in a smaller session.
Figure 7(a) shows that in the case of WUM and WCM techniques, precision of prediction is very low in a smaller session while SPUDK performed well. On average, a 56% improvement in precision was achieved, as depicted in Table 5.
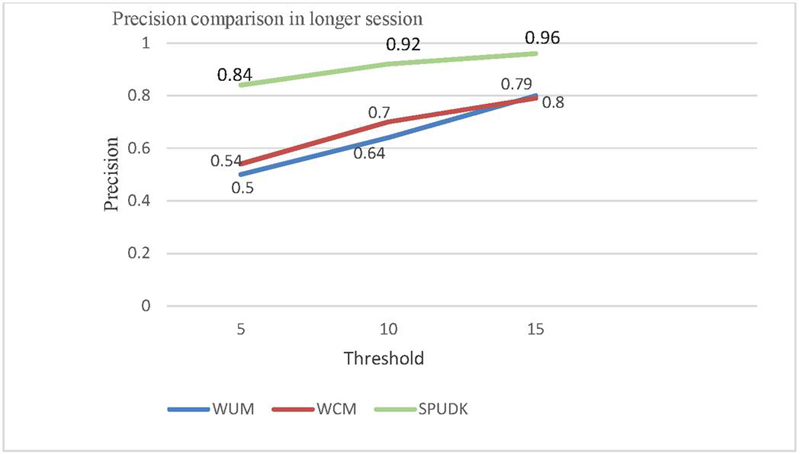
Figure 7(b): Comparison of the precision between WUM, WCM and SPUDK in a longer session.
Figure 7(b) shows that even in a longer session SPUDK performed well as compared to WUM and WCM techniques and achieved an average 23.5% improvement in precision, as depicted in Table 5.
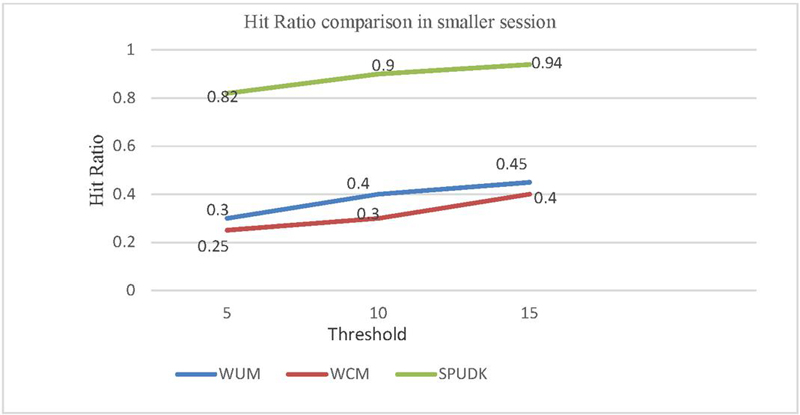
Figure 8(a): Comparison of the hit ratio between WUM, WCM and SPUDK in a smaller session.
Figure 8(a) shows that in the case of WUM and WCM techniques, the cache hit ratio is very low in a smaller session while SPUDK performed well. An average of 54% improvement in hit ratio was achieved, as depicted in Table 5.
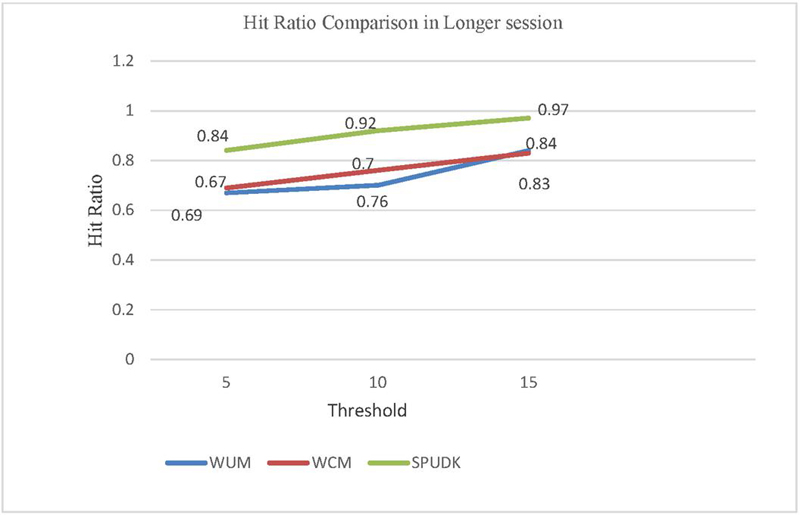
Figure 8(b): Comparison of the hit ratio between WUM, WCM and SPUDK in a longer session.
Figure 8(b) shows that even in a longer session SPUDK performed well as compared to the WUM and WCM techniques and achieved a 16.5% on average improvement in hit ratio, as depicted in Table 5.
Experiments have led to the conclusion that WUM as well as WCM may perform better in longer user sessions; nevertheless, the effectiveness of these strategies is significantly reduced in shorter user sessions. On the other hand, the suggested prediction system known as SPUDK works well in both shorter and longer sessions. By considering semantics this model performs a step forward to others. Based on semantics of queries, we can find a broad set of prediction results even in the case of smaller sessions. We analysed the data shown in Table 5 by referring to the graphs that are shown in Figures 7 and 8.
Table 5 Comparison of WUM, WCM with SPUDK for precision and hit ratio
| Session | Technique | Precision | Hit Ratio |
| Smaller session | WUM | 16% | 38% |
| SPUDK | 71% | 88% | |
| IMPROVEMENT | 55% | 50% | |
| Smaller session | WCM | 14% | 31% |
| SPUDK | 71% | 88% | |
| IMPROVEMENT | 57% | 57% | |
| Longer Session | WUM | 65% | 76% |
| SPUDK | 90% | 91% | |
| IMPROVEMENT | 25% | 15% | |
| Longer Session | WCM | 68% | 73% |
| SPUDK | 90% | 91% | |
| IMPROVEMENT | 22% | 18% |
Based on the findings, it is possible to draw the conclusion that our methodology, which we refer to as SPUDK, unquestionably produces superior outcomes, as shown by a roughly 39% improvement in precision and practically an average of around 35% rise in hit ratio.
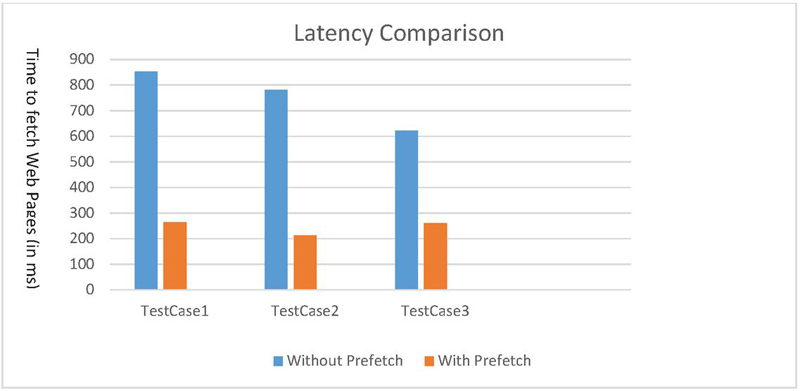
Figure 9 Latency comparison with the proposed prediction system.
6.1.2 Impact on latency
After running test cases series consisting of query sets from the testing set of the access logs with varying inputs, it was discovered that the amount of time required to retrieve web pages using SPUDK for prefetching is almost cut in half compared to the amount of time required to retrieve web pages when prefetching is not used, as given in Table 6.
As a result, significant progress has been made in reducing latency. Figure 9 shows the same data.
| Average Time Taken | ||
| Without prefetch | With prefetch | Reduction % in Time |
| 751 | 245 | 50.6% |
Comparative analysis proved that SPUDK performed better than the WUM and WCM techniques in terms of precision, hit ratio, and latency.
7 Conclusion
In order to deliver an accurate prediction that corresponds to the user’s query, a semantically enhanced prefetching prediction system has been developed in this research. It integrates web usage mining and domain knowledge in the context of the semantics of the query terms. Enhancing the access logs to semantic weighted log records, which carry the semantics of the content provided by the user in the form of the query, is the key aspect of this study. Taxonomy categories that are further clustered to offer the prediction list by the prefetching module against the user’s query based on the relevant cluster corresponding to query are added to semantic weighted log records. A domain taxonomy and thesaurus are used to map access logs to semantic weighted log records. Clustering is more computationally efficient as a result of this categorisation. As a result, it generates a larger collection of predictions that are based both on the original URLs and the semantic categories associated with them. When compared to other mining approaches, experimental evaluation reveals a reduction in latency that is 50.6% lower on average, a rise in hit ratio of 35%, and an improvement in precision of prediction that is 39% higher.
Although the techniques reported in this paper improve the hit ratio, the precision of prediction and reduce delays, there is room for future expansion of the proposed system to improve web performance. Some of the possible extensions and issues that could be further explored in the near future are as follows.
• Dynamic construction of taxonomy: In the proposed system, pre-defined taxonomy is used which represents domain knowledge. There is scope for dynamic construction of taxonomy where construction can be fully automated. This can alleviate the new-page problem which does not belong to predefined categories in the hierarchy.
• Applicability on the semantic web: The proposed system may also be made compatible with the semantic web.
References
[1] P. M. Bharti and T. J. Raval, “Improving Web Page Access Prediction using Web Usage Mining and Web Content Mining,” 2019 3rd International conference on Electronics, Communication and Aerospace Technology (ICECA), Coimbatore, India, 2019, pp. 1268–1273, doi: 10.1109/ICECA.2019.8821950.
[2] Acharya, Anal; Sinha, Devadatta, “An Intelligent Web-Based System for Diagnosing Student Learning Problems Using Concept Maps”, Journal of Educational Computing Research, vol. 55, no. 3, pp. 323–345, Jun 2017.
[3] K. Mani and K. R. Suneetha, “Performance evaluation of Compact Prediction Tree algorithm for Web Page Prediction,” 2020 International Conference on Emerging Trends in Information Technology and Engineering (ic-ETITE), Vellore, India, 2020, pp. 1–7, doi: 10.1109/ic-ETITE47903.2020.166.
[4] V. Luckose, J. Chembath, J. A. R. Ponnusamy, S. Sharma, P. Kaur and S. Smiley, “Web Usage Pattern Detection Using Cohesive Markov Model With Apriori Algorithm,” 2022 IEEE International Conference on Automatic Control and Intelligent Systems (I2CACIS), Shah Alam, Malaysia, 2022, pp. 226–229, doi: 10.1109/I2CACIS54679.2022.98 15465.
[5] X. Zhu et al., “Similarity-Maintaining Privacy Preservation and Location-Aware Low-Rank Matrix Factorization for QoS Prediction Based Web Service Recommendation,” in IEEE Transactions on Services Computing, vol. 14, no. 3, pp. 889–902, 1 May-June 2021, doi: 10.1109/TSC.2018.2839741.
[6] P. T. Siva Gurunathan, R. S, R. S and N. S, “Web Application-based Diabetes Prediction using Machine Learning,” 2023 7th International Conference on Computing Methodologies and Communication (ICCMC), Erode, India, 2023, pp. 296–302, doi: 10.1109/ICCMC56507.2023. 10083583.
[7] Suguna. R and Sharmila. D, “An Overview of Web Usage Mining”, International Journal of Computer Applications, vol. 39, no. 13, pp. 11–13, 2012, https://doi.org/10.5120/4879-7314.
[8] CU. O and Bhargavi. P, “Analysis of Web Server Log by Web Usage Mining for Extracting Users Patterns”, International Journal of Computer Science Engineering and Information Technology Research, vol. 3, no. 2, pp. 123–136, 2013.
[9] Goel. N, Gupta. S and Jha. C K, “Analyzing Web Logs of an Astrological Website Using Key Influencers”, International Research Journal, vol. 5, no. 1, pp. 2–11, 2015.
[10] N. Ahmad, O. MaliIk, M. Hassan, M. S. Qureshi, and A. Munir, “Reducing User Latency in Web Prefetching Using Integrated Techniques”, IEEE Computer, 2011.
[11] B. Parhami, “Introduction to Parallel Processing Algorithms and Architectures”, Kluwer Academic Publishers New York, Boston, pp. 111–112, 2002.
[12] Thi Thanh Sang Nguyen, Hai Yan Lu, and Jie Lu, “Web-Page Recommendation Based on Web Usage and Domain Knowledge”, IEEE Transactions On Knowledge and Data Engineering, vol. 26, no. 10, 2014.
[13] Yuening Hu, Changsung Kang, Jiliang Tang, Dawei Yin, and Yi Chang, “Large-scale Location Prediction for Web Pages”, IEEE Transactions on Knowledge and Data Engineering, vol. 29, no. 9, 2017.
[14] S. Wang, T. Liu, J. Nam and L. Tan, “Deep Semantic Feature Learning for Software Defect Prediction,” in IEEE Transactions on Software Engineering, vol. 46, no. 12, pp. 1267–1293, 1 Dec. 2020, doi: 10.1109/TSE.2018.2877612.
[15] C. I. Arthi, R. L. Priya and R. Rautela, “Analysis and Prediction of health issues for teaching profession using Semantic Techniques,” 2018 International Conference on Smart City and Emerging Technology (ICSCET), 2018, pp. 1–5, https://doi.org/10.1109/ICSCET.2018.8537368.
[16] Sonia Setia, Jyoti, Neelam Duhan, “HPM: A Hybrid Model for User’s Behavior Prediction Based on N-Gram Parsing and Access Logs”, Scientific Programming, Hindawi vol. 2020, 2020, https://doi.org/10.1155/2020/8897244.
[17] Kalaivani. S and Shyamala. K, “A Novel Technique to Pre-Process Web Log Data Using SQL Server Management Studio”, International Journal of Advanced Engineering, Management and Science. Vol 2(7), pages 973–977, 2016.
[18] Sonia Setia, Jyoti, Neelam Duhan, “Efficient query keyword interpretation for semantic information retrieval”, IIOAB Journal, vol. 11, no. 2, pp. 64–68, May 2020.
[19] Sonia Setia, Jyoti, Neelam Duhan, “A novel approach for Density based Optimal Semantic Clustering of Web Objects via identification of KingPins”, Recent Advances in Computer Science and Communications, vol. 14, no. 3, 2021.
[20] Z. Wu and M. Palmer, “Verb semantics and lexical selection”, In Proc. 32nd annual meeting of the Association for Computational Linguistics, 1994.
[21] Lee, D., “Methods for Web Bandwidth and Response Time Improvement”, World Wide Web: Beyond the Basics, 1998; 25.
[22] http://www.researchpipeline.com/mediawiki/index.php?title=AOL\_Search\_Query\_Logs accessed on Jan 2021.
[23] Cheng-Zhong Xu; Tamer I. Ibrahim, “A Keyword-Based Semantic Prefetching Approach in Internet News Service”, Journal of IEEE Transactions on Knowledge and Data Engineering, vol. 16, no. 5, 2004.
[24] C. D. Gracia and S. Sudha, “A case study on memory efficient prediction models for web prefetching”, In Proc. International Conference on Emerging Trends in Engineering, Technology and Science (ICETETS), Pudukkottai, pp. 1–6, 2016.
[25] Jyoti, A.K. Sharma and Amit Goel, “A novel approach to determine the rules for Web Page Prediction using Dynamically chosen K-order Markov Models”, International Journal of Research in Computer and Communication Technology, vol. 2, no. 12, 2013.
[26] Setia Sonia, Verma Jyoti and Duhan Neelam, “A novel approach for semantic web prefetching using semantic information and semantic association”, Big data analytics, pp. 471–479, 2018.
[27] Setia Sonia, Verma Jyoti and Duhan Neelam, “Semantic Prefetching Based Hybrid Prediction Model”, International Journal of Scientific & Technology Research, vol. 8, no. 12, pp. 3936–3941, December 2019.
Biographies

Sonia Setia is presently working as Associate Professor in Department of Computer Science and Engineering, Sharda University, Greater Noida. She received her Ph.D in Computer Science and Engineering from YMCAUST, Faridabad, India. She has broad research interests in Web prediction, data mining, Information Retrieval, Artificial Intelligence and Natural language processing. She has published more than 20 papers in reputed journals and conferences.

Jyoti is presently working as Associate Professor in Department of Computer Engineering, J. C. Bose University of Science and Technology, Faridabad, India. She received her Ph.D in Computer Science Engineering from Maharishi Dayanand University, Rohtak in 2011. She has broad research interests in Data Mining, Information Retrieval. She has published more than 35 papers in refereed journals at national and international level.

Neelam Duhan is presently working as Associate Professor in Department of Computer Engineering, J. C. Bose University of Science and Technology, Faridabad, India. She received her Ph.D in Computer Science Engineering from Maharishi Dayanand University, Rohtak in 2011. She has broad research interests in Data Mining, Information Retrieval and Databases. She has published more than 40 papers in reputed conferences and refereed journals.

Aman Anand is presently working as Assistant Professor in Department of Computer Science and Engineering, ITS Engineering college, Greater Noida. He pursuing his Ph.D in Computer Science and Engineering from Gautam Buddha University, Greater Noida, India. He has broad research interests in Networking, IoT, Software Engineering, Artificial Intelligence and Natural language processing. He has published more than 10 papers in reputed journals and conferences.

Nikita Verma is presently working as Assistant professor in Department of Computer Science & engineering (AI & ML), Greater Noida of Institute of Technology, Engg. Institute, Greater Noida, Knowledge park -2, U.P. India. She is pursuing Ph.D in Computer Science From Banasthali University, Tonk District Rajasthan, India. She has Broad research interest in Wireless networking, Software Engineering, IOT. She has published 8 papers in reputed conferences and refereed journals.
Journal of Web Engineering, Vol. 23_3, 341–376.
doi: 10.13052/jwe1540-9589.2332
© 2024 River Publishers