A Study on Visual Expression Elements and User Satisfaction in Video Streaming Services on the Web: Focusing on Video Thumbnails
Seungmin Lee
Namseoul University, Seoul, South Korea
E-mail: mini0920@nsu.ac.kr
Received 09 November 2022; Accepted 11 January 2023; Publication 14 April 2023
Abstract
With the rapid increase in the use of video services due to the development of network technology, various internet video service platforms have appeared. The consumption of these video services is expected to continue to increase. Video traffic, which accounted for 64% of Internet traffic in 2014, is expected to account for more than 81% of Internet traffic by 2022, and 86% of corporate marketers use video content in online campaigns. Users can immediately check which channel it is through the thumbnail of the video, and the click-through rate of the video changes. Therefore, thumbnails can represent images and play a role in stimulating curiosity.
In this situation, this study analysed the relationship between users’ attitudes and satisfaction according to the visual expression elements of video streaming service thumbnails on the web. For this purpose, a survey was conducted, with subjects in their 20s.
As a result of the study, looking at the effect of visual expression elements of video thumbnails on viewing attitudes, it was found that images and typography had a significant positive () effect on the order of images and typography. Also, as a result of analysing the relationship between viewing attitudes and viewing satisfaction, it was found that viewing attitudes toward video had a significant positive () effect on viewing satisfaction. Lastly, looking at the effect of visual expression elements of YouTube thumbnails on viewer satisfaction, it was found that images and colours had a significant positive effect on the order of images and colour. It was found that the layout and typography did not have a significant effect on the satisfaction of the viewers. Through this study, we intend to present a practical and efficient application method for web content production and web marketing activities.
Keywords: Web streaming, video service, thumbnail, visual elements on the web, viewing attitudes, viewing satisfaction.
1 Introduction
As outdoor activities were reduced due to the pandemic, the overall time spent on the web and internet increased, and the time spent on entertainment content increased significantly. In particular, the usage rate of video streaming services is increasing significantly.
Video streaming refers to a method of continuously viewing video or audio without interruption. In general, when you download a video, it cannot be played until it is all downloaded. However, since streaming divides large-capacity audio or video into several pieces using compression technology and transmits it, it is possible to play it simultaneously with downloading without storing it on a hard disk. This method can save time and does not affect the user’s hard disk capacity. Video streaming services are currently experiencing tremendous competition in the field of IT and digital culture and arts content. Representative video streaming service platforms include YouTube, Netflix, Kakao TV, and Disney Plus.
According to a digital media usage rate survey conducted by Nasmedia in 2021, online video usage is by over 90% of all age groups (the overall average is 96.7%), and online video viewing is becoming a common activity regardless of age. Total viewing time increased compared to the previous year, and YouTube took the overwhelming first place among all age groups for video viewing channels. YouTube is the preferred video streaming service for many users.
YouTube has content in various types, lengths, and topics [1], has SNS-like characteristics at the same time [2], and has the most remarkable influence in the online video service market, so its continuous growth is predicted. The initial video sharing sites were started from a service for simply sharing videos. However, because of users’ needs and development of diverse technologies, currently, various services are provided besides the existing service. There are various services such as content channel services that have increased one-person media, user customized-service, and video quality service [3].
With the high rate of web growth, users are faced with an overload of information [4]. The content is the main reason why a user visits the website and its pages. Its quality affects the visit duration and future user return [5]. YouTube has a rapidly increasing variety of contents which means the users do not know which video to choose. In this situation of selection, the users’ intention to watch is influenced by thumbnail they see before watching actual content. When faced with numerous thumbnails, there are thumbnails that especially grab users’ attention to make them want to watch them. With the recent increase in creators whose YouTube advertising earnings are their main income source, the importance of a thumbnail that is directly connected to the content is emphasized [6].
The thumbnail images that implicitly express the content of a video could be designed for the creators through edited image and texts. However, it is rare to find research on the methods and effects of the production of thumbnail production on the web. Many areas like advertising and design already place emphasis on the visual aspects of images, and also verify their effects (Childers and Houston 1984; Meyers-Levy and Peracchio 1992; Minard, Bhatla, Lord, and Unnava 1991; Scott 1994).
Thus, an in-depth study on the effective expression of thumbnails on the web will be able to contribute to the development of various expression techniques for delivering optimized messages on video sharing sites in the future. Therefore, in this study, the effect of visual expression factors on users’ attitudes and satisfaction is analysed, with a focus on the thumbnails of YouTube, where the most videos are distributed online. The purpose of this study is to present a practical and efficient use plan for content production and marketing activities through research results.
2 Theoretical Background
2.1 Visual Expression Elements of Video Thumbnails on the Web
YouTube is already an essential entity in our content consumption market. As a personal diary to record daily life, a corporate advertising/marketing platform, a means of policy promotion for the government and public institutions, and a channel for communication between the press/media and the public, YouTube has been completely and deeply entrenched in every area such as economy, culture, society, and politics.
YouTube, which started its initial service in 2005, has been perfectly entrenched as a video social network service(SNS), representing the whole world, and also a search portal site for 15 years. Starting from a service for sharing videos, now, it is also working as a portal site that has everything based on the power of video differentiated from text. In particular, the search called ‘How To’ is showing strong competitiveness that overwhelms other portal sites.
YouTube, which was acquired by Google the year after its founding, is currently used by more than 2 billion people in the whole world. An average of 100 million videos are uploaded every day, and an average of 1 billion hours or more are used each day. A total of 400 hours of new video is uploaded every minute.
Also, there are 24.3 million personal channels in YouTube, and the monthly average number of viewing hours per person is 16 hours. In Korea, 83% (about 40 million people) of the whole population is using YouTube. There are 1275 channels with 100,000 or more domestic subscribers, so the competitiveness of the Korean YouTube market is regarded as great in the global market [7].
In the YouTube market filled with infinite competition, the viewers click videos by viewing thumbnails first rather than video titles. Thus, the producers try to instantly arouse interest in content by using thumbnails that contain interesting content that “could grab viewers’ attention” [8].
A thumbnail is “something shown in the screen by reducing a computer application like internet homepage or electronic book (e-book) that could be viewed at a glance”, which is also called a preview image in YouTube. The viewers of YouTube roughly guess the content of video by viewing the thumbnail, and then decide to view the video, so it becomes a core element by which YouTubers could raise the hits of video [9].
According to qualitative research on YouTubers’ work by Lee [10], each YouTuber is making thumbnails in many styles and then using the most effective thumbnail style. In the methods of making effective thumbnails mentioned by many research participants, first, the performer’s face should be shown. Second, the viewers’ curiosity should be stimulated. Third, the text that could deliver the core of contents should be seen at a glance. According to interviews with famous YouTubers, the hits could be different from two times to 100 times depending on the thumbnail. Because the viewers decide to view a video simply by viewing its thumbnail, it is very important to use eye-catching typography and photos that show the content at a glance [10].
Thus, the visual expression elements of thumbnail design in pixels of 1280 (width) 720 (length) play important roles in causing changes to viewer attitude. A human’s sensitivity is more influenced by visual/auditory elements. A symbolic photo, illustration, colour, typography, and layout that implicitly express the content of advertising and relate a powerful message could make viewers understand quickly, and eventually affect their decision making, which leads to the maximization of effects. Thus, the effective combination of such expression elements is very important (Childers and Houston 1984; Meyers-Levy and Peracchio 1992; Minard, Bhatla, Lord, and Unnava 1991; Scott 1994).
Currently, the theoretical basis of thumbnail design expression elements is weak, so the scope of this study is largely divided into image, typography, layout, and colour according to the standard of preceding research in the visual information design area.
2.2 Viewing Attitude
Thomas [11] defined attitude as “a psychological process that gives a direction of individual’s action and its possibility within society, which always aims for social values”. Remmer and Gage [12] defined attitude as “an emotional tendency to positively or negatively respond to a psychological object, which is formed through experiences”. Also, Katz [13] defined the attitude as “a preconception to evaluate an object like world view in friendly or unfriendly method, which includes cognition, belief, emotion, and depth of feeling”.
Meanwhile, Allport [14] who emphasized attitude as the most unique and essential concept in the American psychology world of the time, defined attitude as “a kind of preparatory state of the mental/nervous system formed through experiences, which has direct or dynamic influences on individual’s responses to every object and situation”.
Similarly, each scholar defined attitude in diverse concepts, and the definition of attitude that is the most generally accepted is “the substance that has a tendency of act based on emotional value including the cognitive contents called a belief in an object” [15].
In this study, the YouTube viewing attitude is an attitude to accept the information of thumbnails according to an individual’s belief, which is a core element. In other words, as a solid belief or mindset right before viewers perform an act, this induces them to watch the relevant YouTube content.
Thus, after defining the viewing attitude as a “viewers’ positive or negative response through thumbnail, and also their belief or mindset right before viewing the relevant YouTube contents”, this study aims to consider the visual expression elements of thumbnails among many scales that could measure this viewing attitude.
2.3 Viewing Satisfaction
Satisfaction means “the internal state representing the satisfaction of personal desire, achievement of expectation, or the degree of pleasant feelings”, and the viewer satisfaction felt in a mass-communication situation reflects the satisfaction of desire and verification of expected satisfaction.
Viewing satisfaction means satisfying the expectation of a program rather than thought [11]. Also, according to Miller [16], in the case when it is closer to or higher than a viewer’s expectation, the viewer’s satisfaction of a program is high. In the case when it is lower than that, dissatisfaction is felt. As a relative concept, this satisfaction is decided by differences between expectation and experience. When the experience is better than the expectation, satisfaction is felt. In the case when the experience is lower than the expectation, dissatisfaction is felt [12, 13].
TV viewing satisfaction tends [16–18] to be formed in complex correlations of viewer satisfaction of motive or expectation of a TV program, viewing act, and viewing program [15]. Thus, the satisfaction could be a personal experience which is emotional evaluation of temporary satisfied state while viewing a program [19].
Park et al. [20] analysed the effects of the contents production method, perceived risk, and media richness on customer satisfaction, presented symbolism and social presence as variables having positive effects on the satisfaction of contents use, and also presented personal risk and text as variables having negative effects.
Even though there is much research on satisfaction related to TV viewing [20], there is not much research on the measurement of satisfaction with YouTube. Thus, this study aims to define the viewing satisfaction of YouTube as the degree of psychological/emotional satisfaction felt when a YouTube user views YouTube.
3 Study Design
This study examines the effects of YouTube thumbnail visual expression factors on viewing attitude and satisfaction. To clarify, the model of the study was schematically illustrated as shown in Figure 1.
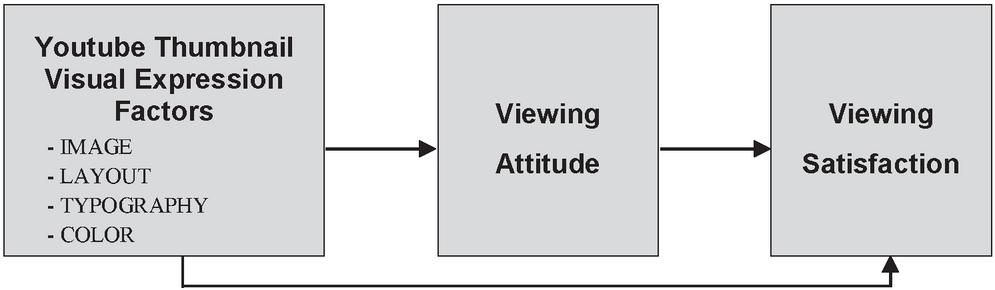
Figure 1 Research model.
4 Results
Data was collected from people in their 20s (male: 65, female: 84), a group whose video usage rate is overwhelmingly higher than other age groups [15]. The survey was conducted from 29 March to 2 April 2021, and a total of 149 questionnaires were used for the final analysis [21].
The analysis of the survey data used the SPSS statistical program, an exploratory factor analysis was conducted to verify the reliability and validity of the measured variables, and a regression analysis was performed to understand the influence relationship between the variables.
4.1 Reliability Analysis Result of YouTube Thumbnail Visual Expression Elements
Cronbach’s alpha coefficient was used to analyse the reliability of the item to measure the visual expression factor of YouTube thumbnails. As shown in Table 1, the reliability of all measured variables was above 0.7. No items were found that impair the reliability, so all items were used for analysis.
Table 1 Reliability verification results
| Measurement | Number | Number of | Cronbach’ | |
| Item | of Questions | Selected Questions | Alpha | |
| Visual expression | Color | 6 | 6 | 0.772 |
| elements of | Layout | 6 | 6 | 0.796 |
| Youtube | Image | 6 | 6 | 0.801 |
| thumbnails | Typography | 6 | 6 | 0.892 |
4.2 Reliability Analysis Result of YouTube’s Viewing Attitudes and Satisfaction
Cronbach’s alpha coefficient was used to analyse the reliability of the items to measure YouTube’s viewing attitude and viewing satisfaction. As shown in Table 2, the reliability of all measurement variables showed a high level of 0.8 or higher. No items were found that impair the reliability, so all items were used for analysis.
Table 2 Reliability verification results
| Number | Number of | Cronbach’s | |
| Measurement Item | of Questions | Selected Questions | Alpha |
| YouTube viewing attitude | 6 | 6 | 0.861 |
| YouTube viewing satisfaction | 5 | 5 | 0.885 |
4.3 Analysis Results of the Relationship Between YouTube Thumbnail Visual Expression Elements and Viewing Attitude
The table of variance analysis of the multiple regression analysis on the visual expression elements and viewing attitudes of YouTube thumbnails is shown in Table 3. As a result of the statistical significance test of the model that measures the viewing attitude of YouTube viewers with four independent variables, the colour and layout were excluded because they were not significant, and the F statistical value of the model including images and typography was 42.21. The independent variable included in the model as 000 was significantly explained at the significance level of 0.05, and the explanatory power of the effect of the visual expression factor of a YouTube thumbnail on viewing attitude was 37%.
Table 3 ANOVA table for regression models (N 149)
| Sum of Squares | df | Mean Square | |||
| Linear regression analysis | 16.358 | 2 | 8.179 | 42.21 | 0.000 |
| Residual | 28.293 | 146 | 0.194 | ||
| Sum | 44.652 | 148 | |||
| R2 (adj. R2) 0.37 (0.36) | |||||
As a result of testing the contribution and statistical significance of YouTube thumbnail visual expression elements to viewing attitude, as shown in Table 4, the variables that significantly affects the viewing attitude of YouTube viewers at the significance level of 0.05 are image (t 6.89, p 0.000) and typography (t 2.25, p 0.026), and according to the standardization coefficient indicating the relative contribution to the independent variable, the viewing attitude was in the order of image and typography.
However, it was found that the colour and layout of the visual expression elements of the thumbnail did not have a significant effect on the viewer’s viewing attitude.
Table 4 Multiple regression analysis results for viewing attitude (N 149)
| B1 | |||||
| (Unstandardized | B2 | ||||
| Independent | Coefficients) | (Standardized | |||
| Variable | B | S.E. | Coefficients) | ||
| Image | 0.54 | 0.08 | 0.51 | 6.89 | 0.000 |
| Typography | 0.15 | 0.07 | 0.17 | 2.25 | 0.026 |
| (Constant) | 1.48 | 0.30 | 5.01 | 0.000 | |
4.4 Analysis Results of the Relationship Between Viewing Attitude and Viewing Satisfaction
As a result of testing the statistical significance of the model that predicts viewing satisfaction with the viewing attitude of YouTube viewers, as shown in Table 5, the F statistic value was 183.93, the significance probability was 0.000, and the viewing attitude significantly explained the satisfaction at the significance level of 0.05 (t 13.56, p 0.004), 56% of the total change in viewing satisfaction is explained by viewing attitude.
Table 5 Results of a simple regression analysis of the viewing satisfaction (N 149)
| B1 | |||||
| (Unstandardized | B2 | ||||
| Independent | Coefficients) | (Standardized | |||
| Variable | B | S.E. | Coefficients) | ||
| Viewing attitude | 0.93 | 0.07 | 0.746 | 13.56 | 0.000 |
| R2 (adj. R2) 0.56 (0.55), F 183.93 | |||||
4.5 Analysis Results of the Relationship Between Youtube Thumbnail Visual Expression Factors and Viewing Satisfaction
The table of variance analysis of the multiple regression analysis on the visual expression elements and viewing satisfaction of YouTube thumbnails is shown in Table 6. As a result of the statistical significance test of the model that measures the viewing satisfaction of YouTube viewers with four independent variables, the layout and typography were excluded because they were not significant, the F statistic value of the model including images and colours was 35.75. The independent variable included in the model as 000 was significantly explained at the significance level of 0.05, and the explanatory power of the effect of the visual expression factor of YouTube thumbnail on viewing satisfaction was 33%.
Table 6 ANOVA table for regression models (N 149)
| Sum of Squares | df | Mean Square | |||
| Linear regression analysis | 22.852 | 2 | 11.43 | 35.75 | 0.000 |
| Residual | 46.660 | 146 | 0.320 | ||
| Sum | 69.512 | 148 | |||
| R2 (adj. R2) 0.33 (0.32) | |||||
As a result of testing the contribution and statistical significance of YouTube thumbnail visual expression factors to viewing satisfaction, as shown in Table 7, the variable that significantly affects the viewing satisfaction of YouTube viewers at the significance level of 0.05 is image (t 4.10, p 0.000) and colour (t 2.99, p 0.003), and according to the standardization coefficient representing the relative contribution to the independent variable, the viewing satisfaction was in the order of image and colour.
However, it was found that layout and typography among the visual expression elements of thumbnails did not have a significant effect on viewer satisfaction.
Table 7 Multiple regression analysis results for viewing satisfaction (N 149)
| B1 | |||||
| (Unstandardized | B2 | ||||
| Independent | Coefficients) | (Standardized | |||
| Variable | B | S.E. | Coefficients) | ||
| Image | 0.48 | 0.12 | 0.36 | 4.10 | 0.000 |
| Color | 0.34 | 0.11 | 0.27 | 2.99 | 0.003 |
| (Constant) | 0.96 | 0.37 | 2.59 | 0.010 | |
5 Conclusions
YouTube thumbnails easily explain the topic of the video and help you when thinking about which contents to choose. Among the numerous thumbnails that are available before watching content, there are thumbnails that catch our attention or make us want to see the content. Since this is directly related to the number of views of the content, its importance cannot be overemphasized.
The objective of this study was to present the direction of YouTube thumbnail design by empirically examining the effects of visual expression elements (colour, layout, typography, image) of YouTube on viewer attitude and satisfaction.
In the results of this study, first, regarding the effects of visual expression elements of a YouTube thumbnail on the viewing attitude, the image and typography, in order, had significantly positive () effects on it. Among the visual expression elements of a thumbnail, the colour and layout did not have significant effects on viewers’ viewing attitude. This result accords with the result of research (Cho Jang-Eun, 2013) reporting that the image expresses the structural and integrated concepts through visual language, and the image is also easy for memory and association as it implies visual elements contrary to texts. This result also accords with the results of existing research (Kim Gyeong-Ok, 2018; Lee Su-Jin; 2019) reporting that the typography plays an important role in design, and its importance is rising regardless of the existing mass-media or new media that utilizes lots of information in texts.
Second, in the results of analysing the relation between viewing attitude and viewing satisfaction, the viewing attitude towards YouTube had significantly positive () effects on the viewing satisfaction. Thus, it is necessary to understand the phenomena of content and also to systematically manage the effective response indices by analysing user experiences in image and typography as the expression elements having effects on the viewing attitude, viewers’ selection of content, and empathy strategies.
Third, in the results of examining the effects of visual expression elements of a YouTube thumbnail on viewer satisfaction, the image and colour, in order, had significantly positive () effects on it. Among the visual expression elements of a thumbnail, the layout and typography did not have significant effects on the viewer satisfaction.
The layout did not have significant effects on both viewer attitude and satisfaction. This might be because of the physical limitation in which the characteristics of layout cannot be fully shown as thumbnails are produced by utilizing the whole small-sized square frame. Also, the typography had effects on the viewers’ viewing attitude while it did not have significant effects on the satisfaction. The viewers’ viewing attitude is a mindset right before viewing the YouTube content, so this is directly connected to the inducement of viewing the relevant YouTube content. In the research experiment, the attitude was measured right after viewing the thumbnail but before viewing the actual YouTube content. Thus, in this case, the typography had effects on the experiment participants, so they could easily remember it. However, after viewing the YouTube content, the effects of typography as a linguistic element on the measured viewing satisfaction were weakened, so it might be difficult for them to remember it.
On the other hand, among the visual expression elements, the colour and image that have abilities to help memory and association and to strengthen the expression elements by stimulating human’s sensitivity and strengthening responses might work more importantly. To increase the efficiency of typography, the visual/linguistic/artistic elements should be comprehensively expressed by understanding the accurate linguistic meanings and symbolism based on the linguistic function, instead of simply focusing on the level of visual expression.
Meanwhile, the image of YouTube thumbnails had significant effects on both viewers’ viewing attitudes and satisfaction. The image of a YouTube thumbnail implicitly expresses many forms. Through this image, the YouTube creators deliver meaning to viewers while the viewers understand and analyse them based on their personal opinions, which is working as a mean of interaction. In particular, the photo visually contains the creator’s facial expression, act, and behaviour, which integrates the overall content of video. For this reason, it plays greater roles in the delivery of meaning compared to other visual expression elements.
The results of this study could be used as useful guidelines for visual expression strategies of YouTube thumbnails, and could also be used as an important means for communication between creator and web users.
However, the subjects of the survey were limited to people in their 20s, which is a limitation of this study. Thus, further research would need to be conducted on the behaviour analysis of more diverse age groups including the middle-aged class. And this study only targeted domestic channels, so there should be more researches on the visual expression of overseas channels. YouTube is a web video platform in which the whole world is communicating, so the types of domestic channels are not good enough to conclude the results of this study.
Acknowledgment
Funding for this paper was provided by Namseoul University.
References
[1] D. J. Son, A study on reliability factors of commercial contents by digital influencer: focused on branded contents by YouTube creator, PhD Thesis, KyungHee University, 2018.
[2] Hankyung Business, New Marketing Leader ‘influencer’, May, 2018.
[3] E. M. Lee, “Recent trend of main internet video service,” Communications Commission Policy, vol. 25, no. 7, p. 5, 2013.
[4] M. Tahmasebi, F. Ghazvini, M. Esmaeili, “Implementation and evaluation of a resource-based learning recommender based on learning style and web page features,” Journal of Web Engineering, vol. 17, no. 3&4, pp. 284–304, 2018.
[5] O. Kassak, M. Kompan, M. Bielikova, “Acquisition and modelling of short-term user behaviour on the web: A survey,” Journal of Web Engineering, vol. 17, no. 5, pp. 23–70, 2018.
[6] J. M. Yoo, A study on the influence of thumbnail expression type of video contents on YouTube creator properties and consumer attitudes: focused on YouTube product review contents’, Master’s Thesis, HongIk University, 2019.
[7] YouTube is the trend of social networking sites due to the spread of un-tact in the era of pandemics, and the number of subscribers is increasing rapidly. And shopping on YouTube, Maeil Business Newspaper, 2020.
[8] The aesthetics of the moment, thumbnail Aju Business Daily, 2020.
[9] ICT Current language 300, Telecommunications Technology Association (TTA), 2018.
[10] S. J. Lee, Youtuber’s Work, Profitability, and Autonomy, Master’s Thesis, Seoul National University, 2018.
[11] W. Thomas, F. Znaniecki, The Polish Peasant in Europe and America, Boston: Pergamon Press, 1918.
[12] H. Remmers, N. Gage, Educational Measurement and Evaluation, New York: Harper, 1955.
[13] D. Katz, “The functional approach to the study of attitudes,” Public Opinion Quarterly, vol. 24, no. 2, pp. 163–204, 1960.
[14] G. W. Allport, Attitudes. In C. Murchison (Ed) Handbook of Social Psychology, Worcester: Clark University Press, 1935.
[15] Y. E. Jung, Social Psychology, Paju Book City, Korea: Bobmunsa, 1981.
[16] M. Miller, B. Reeves, “Dramatic TV content and children’s sex-role stereotypes,” Journal of Broadcasting & Electronic Media, vol. 20, no. 1, pp. 35–50, 1976.
[17] R. L. Oliver, “Measurement and evaluation of satisfaction processes in retail settings,” Journal of Retailing, vol. 57, no. 3, pp. 25–48, 1981.
[18] D. K. Tse, P. C. Wilton, “Model of consumer satisfaction formation: An extension,” Journal of Marketing Research, vol. 25, no. 2, pp. 204–212, 1988.
[19] K. H. Kim, D. J. Kim, “A study on the relationship among viewing motives, viewing attitude, and viewing satisfaction of TV cooking programs,” In Proc. Korea Entertainment Industry Association, Jeonju, November, pp. 28–39, 2016.
[20] B. W. Park, J. M. Lee, J. W. Lee, “Empirical analysis on the effect of design pattern of web page, perceived risk and media richness to customer satisfaction,” The Journal of the Korea Contents Association, vol. 11, no. 6, pp. 385–396, 2011.
[21] 2018 Broadcasting media usage survey Korea Communications Commission, vol. 23, no. 2, January 2019.
Biography

Seungmin Lee received her bachelor’s degree in art from Ewha Womans University in 1996, master’s degree in design science from Ewha Womans University in 2002, and literature of doctorate degree in video media from Ewha Womans University in 2011. She is currently working as an associate professor at the department of multimedia, faculty of engineering, Namseoul University. Her research areas include user experience, multimedia design, and user testing. She serves as a reviewer for many highly respected journals.
Journal of Web Engineering, Vol. 22_1, 27–40.
doi: 10.13052/jwe1540-9589.2212
© 2023 River Publishers