Web-based Non-contact Edge Computing Solution for Suspected COVID-19 Infection Classification Model
Tae-Ho Hwang and KangYoon Lee*
Gachon University, SeongnamSi, South Korea
E-mail: hth7277@gachon.ac.kr; keylee@gachon.ac.kr
*Corresponding Author
Received 11 November 2022; Accepted 09 June 2023; Publication 24 October 2023
Abstract
The recent outbreak of the COVID-19 coronavirus pandemic has necessitated the development of web-based, non-contact edge analytics solutions. Non-contact sensors serve as the interface between web servers and edge analytics through web engineering technology. The need for an edge device classification model that can identify COVID-19 patients based on early symptoms has become evident. In particular a non-contact implementation of such a classification model is required to efficiently prevent viral infection and minimize cross-infection. In this work, we investigate the use of diverse non-contact biosensors (e.g., remote photoplethysmography, radar, and infrared sensors) for reducing effective physical contact with patients and for measuring their biometric data and vital signs. We further explain a classification method for suspected COVID-19 infection based on the measured vital signs and symptoms. The results of this study can be applied in patient classification by mobile-based edge computing applications. The correlation between symptoms comprising cough, sore throat, fever, headache, myalgia, and arthralgia are analyzed in the model. We implement a machine learning classification model using vital signs for performance evaluation, and propose an ensemble model realized by fine-tuning the high-performing classification models. The proposed ensemble model successfully distinguishes suspected patients with an accuracy, area under curve, and F1 scores of 94.4%, 98.4%, and 94.4%, respectively.
Keywords: Edge computing, COVID-19 classification, non-contact bio-sensor, artificial intelligence, machine learning.
1 Introduction
After its first emergence in mainland China in December 2019 and rapid spread around the world, COVID-19 was declared a pandemic by the World Health Organization (WHO) on March 11, 2020 [1]. The global escalation of the number of critically ill patients due to the rapid spread of the virus resulted in shortages of both medical supplies and staff [2]. Owing to the severity of the COVID-19 pandemic, the development of classification methods at the detection stage, especially on edge devices, is required to rapidly identify infected patients based on their vital signs and early symptoms.
Edge computing enables computation to be performed at the edge of a network rather than relying solely on the cloud for data processing. In this context, the edge refers to computing and networking on the path between the data source and cloud data center. Although placing computing tasks at the edge rather than the cloud improves data processing efficiency, network bandwidth limitations can result in data transmission bottlenecks as the amount of data generated at the edge and data processing speed increase. It is therefore more effective to process the majority of the data generated in the Internet of Things (IoT) at the network edge than to transmit it to the cloud [3, 4]. Instead of relying solely on cloud-based servers for classifying and processing suspected COVID-19 cases, analysis tasks can be performed on edge devices such as smartphones, sensors, or IoT devices that interact with the system.
Non-contact-based vital sign measurement techniques such as camera-based remote photoplethysmography (r-PPG) and the use of radar and infrared (IR) sensors can be used to measure and analyze vital signs on edge devices such as smartphones. These technologies enable the measurement of parameters such as the heart rate (HR), heart rate variability (HRV), breathing rate (BR), oxygen saturation (SPO2), and body temperature.
In this paper, we describe the use of edge computing and non-contact sensors for vital sign measurements. We developed and evaluated the performance of a COVID-19 suspect classification method for the rapid identification of infected patients based on the statistical correlation between early symptoms and non-contact biometric vital signs. The results of this study enable suspected infected individuals to be easily classified without physical contact through mobile-based edge computing applications.
This paper is organized as follows. Section 2 describes the development of the classification model comprising (i) non-contact biosensors, (ii) infected patient classification criteria, (iii) detailed process of the classification model, (iv) dataset for model learning, (v) evaluation of the classification model, and (vi) performance test of the classification model. Section 3 concludes the paper with a summary and suggestions for future work.
2 Materials and Methods
2.1 Non-contact Biosensors
r-PPG allows non-contact monitoring of blood volume pulses using a commercial camera. Photoplethysmography (PPG), which was first demonstrated in the 1930s [4], is a non-invasive biophotonic measurement technique that enables real-time monitoring of various vital signals such as the pulse, BR, and blood oxygenation. The working principle of PPG is based on detecting changes in the light absorption of skin due to changes in blood volume during the cardiac cycle. The scattering of light inside skin illuminated by a light source causes diffuse reflection, which changes the color of the scattered light according to the blood volume. In r-PPG, the change in the amount of blood in the skin is measured as an RGB signal, which allows for non-contact measurement of the pulse rate [5]. r-PPG is a non-invasive and non-contact technique that enables the HR to be measured facilely simply by capturing a facial image using an imaging device [6].
In a recent study, the transient respiration rate was successfully estimated by analyzing the frequency domain properties of r-PPG signals. The measurement of the respiration rate by estimating pseudo-r-PPG signals from the breathing pattern has also been reported [8]. A camera-based r-PPG signal provides a PPG-like signal and a novel approach for non-invasive BP measurements [9].
BP measurement using a single sensor is based on the morphological properties of the blood volume dynamics obtained from PPG measurements at a specific site [10, 11]. Because the working principles of PPG and camera-based r-PPG are similar, the successful estimation of BP from finger clip PPG signals suggests the possibility of non-contact BP measurement via r-PPG, as was confirmed in recent PPG, r-PPG, and BP correlation studies [12–18]. Camera-based rPPG for vital sign measurement can be readily implemented in smartphones owing to their widespread availability and recent technological advancements. Currently, multinational companies such as Google and Samsung provide services for health monitoring based on the BP, HR, BR, heart rate variability (HRV), and stress levels through their respective smartphone platforms Google Fit and Samsung Health.
Radar, which is widely used in industrial and military applications, has recently been applied for vital sign analysis, particularly in low-power and biocompatible ultra-wideband (UWB) applications. Diverse human vital signs such as the HR, HRV, BR, and BP can be monitored using radar technology [19–23]. Commercial radar sensors for measuring human vital signs comprise a 60–64 GHz millimeter wave sensor with a 130 azimuthal field of view (FoV) and 130 elevation FoV.
Measuring the body temperature in public places has become a daily routine because the presence of fever is one of the most important factors in diagnosing COVID-19. Most current body temperature measurement methods involve thermal imaging cameras based on infrared rays. Several methods have been implemented to prevent technical errors in body temperature measurements when facial masks are worn. The first method involves determining if the individuals are wearing facial masks while their body temperatures are measured. The second method involves recognizing the facial area to prevent high-temperature objects from being identified as fever [24]. Additionally, a face recognition program has been used to determine whether a mask was used and whether the mask was worn correctly within the facial recognition range [29].
2.2 Criteria for Classifying Suspected Infection Using Vital Signs and Symptoms
Among the patients’ vital signs, the body temperature, HR, and BR can be used to classify patients with mild and severe COVID-19.
Table 1 Modified early warning score (MEWS)
| Value | |||||||
| Parameter | 3 | 2 | 1 | 0 | 1 | 2 | 3 |
| Pulse | 40 | 41–50 | 51–100 | 101–110 | 111–130 | 131 | |
| Systolic BP | 70 | 71–80 | 81–100 | 101–199 | 200 | ||
| Respiration rate | 8 | 9–14 | 15–20 | 21–29 | 30 | ||
| Temperature | 35.0 | 31.5–36.0 | 36.1–37.4 | 37.5 | |||
| CNS level | Alert (A) | Reacting to | Reacting to | Unresponsive | |||
| voice (V) | pain (P) | (U) | |||||
| Source: Diagnosis Guideline of Severe COVID-19 Patients, Korean Society of Critical Care Medicine (KSCCM), (v.1.1, 2020.03.01). | |||||||
The Korean Society of Critical Care Medicine (KSCCM), Korean Society of Infectious Diseases, Korean Academy of Tuberculosis and Respiratory Diseases, and Korean Society for Antimicrobial Therapy have developed guidelines for patients with severe COVID-19. The modified early warning score (MEWS, Table 1) is used to classify patients as low (lower than 4), moderate (score of 5 or 6), and high risk (higher than 7), and a diagnostic guideline was devised for each group [26]. Oxygen saturation (SpO2) and oxygen application criteria were added to the National EWS (NEWS) [27].
According to the clinical characteristics of COVID-19 patients, 2% of the patients exhibited body temperatures below 37.3C, 20% of the patients temperatures between 37.3 and 38.0C, 44% of the patients temperatures between 38.1 and 39.0C, and 34% of patients temperatures above 39.0C. The BR was less than 24/min for 29% of the entire sample of COVID-19 patients [28]. The BR in COVID-19 acute respiratory distress syndrome (ARDS) was reported to be 26/min [29]. In healthy individuals, the BR interval shows a predictable and consistent nonlinear shortening as the HR increases [30]. Changes in the HR and BR are therefore characteristic symptoms of COVID-19 [28–31].
Fever is also associated with the BR. Elevated temperatures in a patient can cause shortening of the BR interval. For instance, it was shown in a study that the HR increased from 66.5/min to 84/min as the body temperature increased to 38.4C. This shows that a 1C increase in body temperature causes the heart rate to increase by 8.5/min [32].
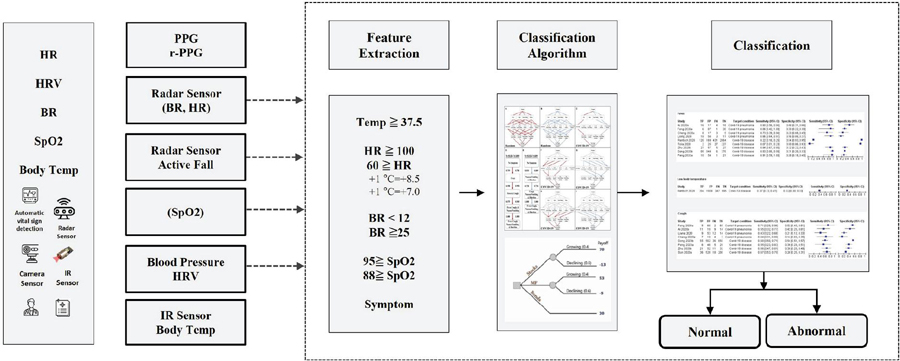
Figure 1 COVID-19 classification process.
The guidelines of the Korea Centers for Disease Control and Prevention recommend that individuals who have body temperatures exceeding 37.5C and BR below 12/min or above 25/min be subjected to detailed examination. More specific guidelines recommend that COVID-19 screening be performed on individuals in the age group of 6–11 years with HR outside the range of 75–118, individuals in the age group of 12–59 years with HR outside the range of 60–100, individuals with respiratory disease and SpO2 88%, and individuals without respiratory disease with SpO2 below 95%. The COVID-19 classification process is as follows (Figure 1).
Various machine learning (ML) models have been or can be used to classify suspected COVID-19 cases [33]. Decision tree is a supervised learning algorithm that creates a tree-like model of decisions and their potential consequences. It is a simple and interpretable model that performs well with small datasets. A support vector machine (SVM) is a model that finds the boundary, known as the decision boundary, that best separates the current data. The data points closest to this boundary are called the support vectors. The SVM learns by maximizing the margin, which is the distance between the support vectors and decision boundary. Random forest is an ensemble learning method that combines multiple decision trees and selects subsets of features and data points for each decision tree to reduce overfitting and improve generalization. The final prediction is obtained by voting or averaging. It is a powerful and effective model for handling complex datasets. Logistic regression is a linear model used for binary classification based on modeling the relationship between independent variables and the probability of a binary outcome using the logistic function. It is a simple yet effective model widely used in many domains. Naïve Bayes is a probabilistic machine learning model based on Bayes’ theorem, which classifies the given data into predefined categories based on prior information. It is widely used in various fields such as text classification, spam filtering, sentiment analysis, document classification, and medical diagnosis. It is known for its simplicity, effectiveness, and fast learning and prediction speeds [34]. The k-nearest algorithm is a non-parametric lazy-learning algorithm that classifies data points based on their proximity to other data points. The class label is determined by majority voting among the k-nearest neighbors. It is a simple and intuitive model that performs well with small datasets [35]. Gradient boosting is an ensemble learning method that combines multiple weak prediction models (typically, decision trees) to create strong predictive models. The model is improved iteratively by minimizing the loss function using the gradient descent method [36].
2.3 Implementation
Among the various vital signs, the body temperature is often used in the classification of COVID-19 suspects. To perform a comparison with the previous classification model, we implemented a ML COVID-19 suspect classification model that utilizes symptoms such as high fever, body pain, runny nose, difficulty in breathing, nasal congestion and sore throat [37].
The COVID-19 suspect classification model was constructed using numerous ML algorithms comprising a gradient boosting classifier, logistic regression, random forest classifier, KNN classifier, decision tree classifier, SVM, and naïve Bayes, utilizing body temperature, HR, and BR as features. The performance of each classification algorithm was evaluated and the model with the highest performance was selected and further fine-tuned for implementation in the ensemble algorithm (Figure 2).
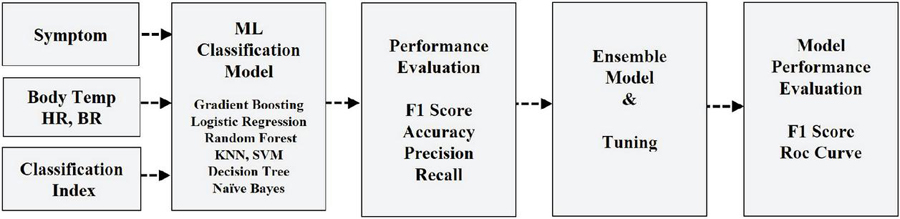
Figure 2 COVID-19 classification ensemble model implementation.
2.4 Data Analysis and Pre-processing
Open-source COVID-19 prediction data from GitHub and PhysioNET were collected to construct the classification model. The data consist of the vital signs and viral symptoms of 1260 patients and 1239 non-patients of various nationalities, age, and genders. The vital signs used in the classification model comprise the HR, BR, and body temperature of non-COVID-19 patients [38, 39].
The raw data were first binarized into 0 and 1 depending on the absence or presence of each viral symptom of COVID-19 infection. The processed data were then used to determine the correlation between each symptom and COVID-19 infection using the classification model. The symptoms used comprise fever, body pain, runny nose, breathing difficulty, nasal congestion, and sore throat. In particular, breathing difficulty, body pain, and fever have the highest correlation to COVID-19 infection with an average coefficient of approximately 0.4 (Figure 3).
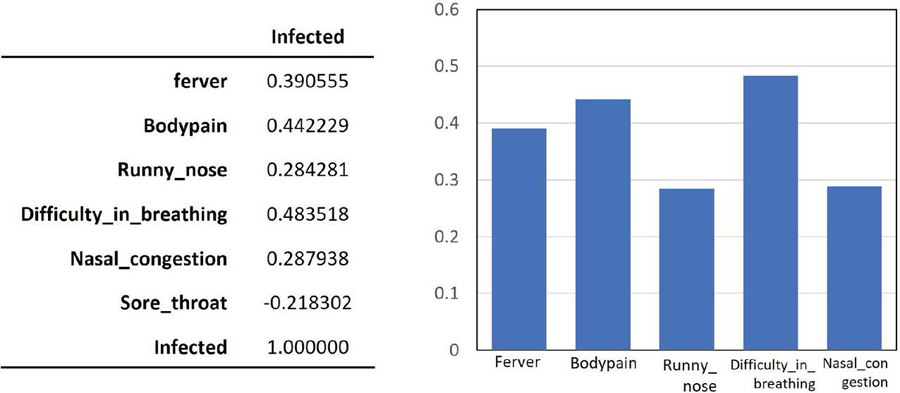
Figure 3 Correlation between COVID-19 infection and symptoms.
2.5 Evaluation Metrics
To evaluate the model, four metrics comprising the accuracy, precision, recall, and F1 score were considered in this study [40]. The terms true positive (TP), true negative (TN), false positive (FP), and false negative (FN) are used in the following definitions: given a dataset consisting of (TP TN FP FN) data points, the accuracy is the ratio of the total number of correct predictions (TP TN) by the classifier to the total number of data points. The precision is the ratio of the true positive samples to the sum of the true positive and false positive samples. The recall is the ratio of true positive samples to the sum of true positive and false negative samples. The F1 score is the harmonic mean of the recall and precision values. These definitions can be written as follows (Equations (1)–(4)):
| (1) | |
| (2) | |
| (3) | |
| (4) |
The receiver operating characteristic (ROC) curve illustrates the relationship between the false positive rate (FPR) and true positive rate (TPR). In contrast, the FPR is the ratio of false positives (FP) to the sum of false positives and true negatives (TN). It indicates the proportion of negative cases mistakenly classified as positive out of all the negative cases. The horizontal and vertical axes of the ROC curve correspond to the FPR and TPR, respectively. The area under the ROC curve (AUROC) is commonly referred to as the area under the curve (AUC). Because the curve takes values between 0 and 1, the AUC is always between 0 (worst) and 1 (best).
The Kappa coefficient is a statistical measure that indicates the level of agreement between two or more observers evaluating the same phenomenon. It considers both the observed agreement and the agreement expected by chance. Cohen’s kappa coefficient K ranges from 1 to 1, where 1 indicates perfect agreement and 0 indicates agreement equivalent to chance. When there is no agreement among the evaluators, . A classifier with a higher K value is considered to perform better [41]. Kappa is defined as Kappa (observed agreement expected agreement)/(1 expected agreement), i.e., Equation (5):
| (5) |
The Matthews correlation coefficient (MCC) is an evaluation metric introduced by Matthews used to measure the quality of binary (two-class) classification tasks. This metric provides more reliable results than the accuracy metric, particularly for imbalanced datasets [42]. It takes values between 1 and 1 where 1 indicates perfect predictions, 1 completely incorrect predictions, and 0 random predictions, i.e., no classification value. MCC performs well even for imbalanced class distributions, and is a more reliable evaluation metric than accuracy in such datasets [43]. The MCC is defined as
| (6) |
2.6 Results
To achieve accurate COVID-19 suspect modeling, the performances of various ML-based classification models comprising the gradient boosting classifier, logistic regression, random forest classifier, KNN classifier, decision tree classifier, SVM, and naïve Bayes were compared and evaluated. Each classification model was cross-validated using the compare model function, and the average values of the training results sorted according to the F1 score analyzed (Table 2).
Table 2 Performance evaluation of different ML models
| Model | Accuracy | AUC | Recall | Prec. | F1 | Kappa | MCC | TT (Sec) | |
| lightgbm | Light Gradient Boosting Machine | 0.9508 | 0.9872 | 0.9546 | 0.9490 | 0.9515 | 0.9016 | 0.9022 | 0.119 |
| gbc | Gradient Boosting Classifier | 0.9480 | 0.9845 | 0.9546 | 0.9436 | 0.9487 | 0.8959 | 0.8967 | 0.283 |
| lr | Logistic Regression | 0.9468 | 0.9789 | 0.9524 | 0.9437 | 0.9476 | 0.8936 | 0.8943 | 0.703 |
| rf | Random Forest Classifier | 0.9457 | 0.9772 | 0.9467 | 0.9461 | 0.9461 | 0.8913 | 0.8920 | 0.557 |
| knn | K Neighbors Classifier | 0.9434 | 0.9698 | 0.9456 | 0.9430 | 0.9440 | 0.8868 | 0.8874 | 0.134 |
| ada | Ada Boost Classifier | 0.9417 | 0.9810 | 0.9422 | 0.9429 | 0.9421 | 0.8833 | 0.8842 | 0.172 |
| et | Extra Trees Classifier | 0.9354 | 0.9571 | 0.9240 | 0.9470 | 0.9348 | 0.8708 | 0.8719 | 0.514 |
| dt | Decision Tree Classifier | 0.9274 | 0.9438 | 0.9183 | 0.9366 | 0.9270 | 0.8547 | 0.8555 | 0.024 |
| ridge | Ridge Classifier | 0.9131 | 0.0000 | 0.9173 | 0.9117 | 0.9140 | 0.8262 | 0.8272 | 0.019 |
| lda | Linear Discriminant Analysis | 0.9125 | 0.9713 | 0.9173 | 0.9107 | 0.9135 | 0.8250 | 0.8260 | 0.056 |
| svm | SVM – Linear Kernel | 0.9103 | 0.0000 | 0.9096 | 0.9196 | 0.9085 | 0.8206 | 0.8299 | 0.039 |
| nb | Naive Bayes | 0.7576 | 0.8347 | 0.8641 | 0.7185 | 0.7834 | 0.5141 | 0.5275 | 0.022 |
| qda | Quadratic Discriminant Analysis | 0.5306 | 0.5297 | 0.6298 | 0.5742 | 0.5100 | 0.0593 | 0.0916 | 0.042 |
Five classification models selected from Table 2 were further tuned using the tune model function. The default fold change value was set at 10 (Table 3).
Table 3 Results of tuning using the tune_model() function
| Accuracy | AUC | Recall | Prec. | F1 | Kappa | MCC | |
| 0 | 0.9429 | 0.9814 | 0.9770 | 0.9140 | 0.9444 | 0.8858 | 0.8878 |
| 1 | 0.9543 | 0.9803 | 0.9655 | 0.9438 | 0.9545 | 0.9086 | 0.9088 |
| 2 | 0.9029 | 0.9734 | 0.9432 | 0.8737 | 0.9071 | 0.8056 | 0.8082 |
| 3 | 0.8971 | 0.9722 | 0.9091 | 0.8889 | 0.8989 | 0.7943 | 0.7945 |
| 4 | 0.9486 | 0.9832 | 0.9773 | 0.9247 | 0.9503 | 0.8971 | 0.8986 |
| 5 | 0.9200 | 0.9559 | 0.9205 | 0.9205 | 0.9205 | 0.8400 | 0.8400 |
| 6 | 0.9314 | 0.9830 | 0.9318 | 0.9318 | 0.9318 | 0.8629 | 0.8629 |
| 7 | 0.9429 | 0.9865 | 0.9318 | 0.9535 | 0.9425 | 0.8857 | 0.8860 |
| 8 | 0.9486 | 0.9906 | 0.9432 | 0.9540 | 0.9486 | 0.8971 | 0.8972 |
| 9 | 0.9540 | 0.9904 | 0.9655 | 0.9438 | 0.9545 | 0.9080 | 0.9083 |
| Mean | 0.9343 | 0.9797 | 0.9465 | 0.9429 | 0.9353 | 0.8685 | 0.8692 |
| SD | 0.0198 | 0.0098 | 0.0227 | 0.0255 | 0.0191 | 0.0396 | 0.0395 |
An ensemble model was created by blending the top five high-performance classification models to improve the model performance. The ensemble model achieved an accuracy of 94.4%, AUC score of 98.4%, and F1 score of 94.4% (Figure 4). These performance metrics are comparable to those obtained in a previous study by Soui et al. [44], who reported an accuracy of 95.5%, AUC score of 96.8%, and F1 score of 95.5%.
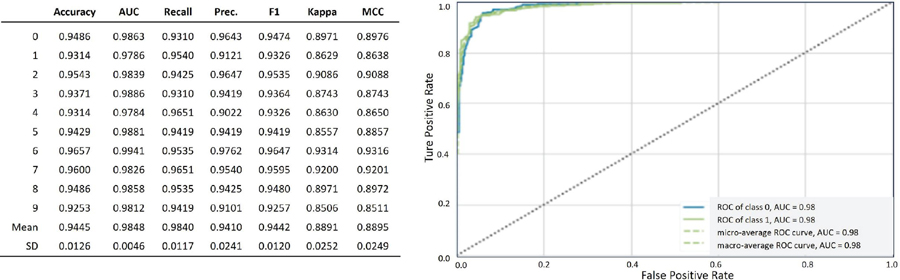
Figure 4 Performance evaluation and ROC curve for the ensemble model.
3 Conclusion and Future Work
In conclusion, we have presented a classification model for suspected COVID-19 infections that correlates the disease infection status of individuals to their vital signs, body temperature, HR, and BR. The ensemble model created using the open-source patient dataset successfully distinguished COVID-19 patients with an accuracy of 94.4% and AUC of 98.4%.
The aim of this study is to prevent re-infection by COVID-19 and rapidly classify suspected COVID-19 patients using non-contact biosensors and biometric measurement technology via ML classification model algorithms.
In addition, we confirmed that various non-contact vital sign measurement techniques comprising r-PPG, radar, and IR sensors are suitable for the COVID-19 suspect classification model. We believe that the classification model based on non-contact biosensor data can be actively used to prevent the spread of COVID-19 during the initial screening of suspected patients. Moreover, this non-contact classification method will aid in reducing the economic, social, and medical burdens caused by the rapid increase in the number of infected patients.
A limitation of the current study is that vital signs are not used in the suspect classification model. Therefore, we plan to enhance the performance and accuracy of the proposed COVID-19 suspect classification model in a future study by using other noncontact vital signs such as the body temperature, HR, BR, and SpO2.
Acknowledgment
This research was supported by the National Research Foundation of Korea (grant number NRF-2022R1F1A1069069) and a grant from the Korea Health Technology R&D Project through the Korea Health Industry Development Institute (KHIDI), which was funded by the Ministry of Health and Welfare, Republic of Korea (grant number HI22C1569).
References
[1] Struyf T., Deeks J. J., Dinnes J., Takwoingi Y., Davenport C., Leeflang M. M. G., Spijker R., Hooft L., Emperador D., Domen J., Horn S. R. A., Van den Bruel A., “Signs and symptoms to determine if a patient presenting in primary care or hospital outpatient settings has COVID-19,” Cochrane Database of Systematic Reviews 2021, Issue 2, 2021.
[2] Wynants L., Van Calster B., Collins G. S., Riley R D., Heinze G., Schuit E, et al. “Prediction models for diagnosis and prognosis of covid-19,” systematic review and critical appraisal BMJ 2020, 2020
[3] BUYYA, Rajkumar; SRIRAMA, Satish Narayana (ed.). Fog and edge computing: principles and paradigms. John Wiley & Sons, 2019.
[4] W. Shi, J. Cao, Q. Zhang, Y. Li and L. Xu, “Edge Computing: Vision and Challenges,” in IEEE Internet of Things Journal, vol. 3, no. 5, pp. 637–646, Oct. 2016, doi: 10.1109/JIOT.2016.2579198.
[5] A. B. Hertzman, “Photoelectric plethysmography of the fingers and toes in man,” Exp. Biol. Med., vol. 37, no. 3, pp. 529–534, 1937.
[6] G. de Haan and V. Jeanne, “Robust pulse rate from chrominance-based rPPG.” IEEE Transactions on Biomedical Engineering, vol. 60, no. 10, pp. 2878–2886, 2013.
[7] Yue, Zijie, et al. “Deep Super-Resolution Network for rPPG Information Recovery and Noncontact Heart Rate Estimation.” IEEE Transactions on Instrumentation and Measurement, vol. 70, pp. 1–11, 2021.
[8] Jingda Du, Si-Qi Liu, Bochao Zhang, Pong C. Yuen, “Weakly Supervised rPPG Estimation for Respiratory Rate Estimation.” Proceedings of the IEEE/CVF International Conference on Computer Vision, pp. 2391–2397, 2021.
[9] F. Schrumpf, P. Frenzel, “Assessment of Non-Invasive Blood Pressure Prediction from PPG and rPPG Signals Using Deep Learning.” Sensors vol. 21, no. 18, pp. 3820–3830, 2021.
[10] O. Schlesinger, N. Vigderhouse, D. Eytan and Y. Moshe, “Blood pressure estimation from ppg signals using convolutional neural networks and siamese network.” ICASSP 2020–2020 IEEE International Conference on Acoustics, Speech and Signal Processing (ICASSP), pp. 1135–1139, 2020.
[11] Hsu, Y. C., Li, Y. H., Chang, C. C., Harfiya, L. N, “Generalized deep neural network model for cuffless blood pressure estimation with photoplethysmogram signal only.” Sensors, vol. 20, no. 19, 2020.
[12] Wang, W., den Brinker, A. C., De Haan, G., “Discriminative signatures for remote-PPG.” IEEE Transactions on Biomedical Engineering, vol. 67, no. 5, pp. 1462–1473, 2019.
[13] Sugita, N., Yoshizawa, M., Abe, M., Tanaka, A., Homma, N., Yambe, T., “Contactless technique for measuring blood-pressure variability from one region in video plethysmography.” Journal of Medical and Biological Engineering, vol. 39, no. 1, pp. 76–85, 2019.
[14] Takahashi, R., Ogawa-Ochiai, K., Tsumura, N., “Non-contact method of blood pressure estimation using only facial video.” Artificial Life and Robotics, vol. 25, no. 3, pp. 343–350, 2020.
[15] Lefloch, JM Wang, A Deep Convolutional Neural Network to Limit Virus Spread Using Facial Mask Segmentation, Journal of Web Engineering, vol. 20. Iss 4, 1177–1188, 2021. https://doi.org/10.13052/jwe1540-9589.20414.
[16] SR Pandey, D Hicks, A Goyal, D Gaurav, SM Tiwari, Mobile Notification System for Blood Pressure and Heartbeat Anomaly Detection, Journal of Web Engineering, Vol. 19. Iss 5–6, 2020. https://doi.org/10.13052/jwe1540-9589.19568.
[17] K. F. Wu and Y. T. Zhang, “Contactless and continuous monitoring of heart electric activities through clothes on a sleeping bed,” in 2008 International Conference on Technology and Applications in Biomedicine, pp. 282–285, 2008.
[18] SM Tiwari, S Jain, A Abraham, S Shandilay, Secure Semantic Smart HealthCare (S3HC), Journal of Web Engineering, vol 17. Iss 8, 617–646, 2018. https://doi.org/10.13052/jwe1540-9589.1782.
[19] Cho, Hui-Sup, and Young-Jin Park. “Detection of heart rate through a wall using UWB impulse radar.” Journal of Healthcare Engineering, 2018.
[20] Al-Masri, Eyhab, Misba Momin., “Detecting heart rate variability using millimeter-wave radar technology.” 2018 IEEE International Conference on Big Data (Big Data), pp. 5282–5284, 2018.
[21] Will, Christoph, et al. “Local pulse wave detection using continuous wave radar systems.” IEEE Journal of Electromagnetics, RF and Microwaves in Medicine and Biology, vol. 1, no. 2, pp. 81–89, 2017.
[22] J. Liu, K. Zhang, W. He, J. Ma, L. Peng and T. Zheng, “Non-contact Human Fatigue Assessment System Based on Millimeter Wave Radar,” 2021 IEEE 4th International Conference on Electronics Technology (ICET), pp. 173–177, 2021.
[23] M. Jung, M. Caris and S. Stanko, “Non-contact Blood Pressure Estimation Using a 300 GHz Continuous Wave Radar and Machine Learning Models,” 2021 IEEE International Symposium on Medical Measurements and Applications (MeMeA), pp. 1–6, 2021.
[24] Min Jeong Lee, Yoo Mi Kim, “Masked Face Temperature Measurement System Using Deep Learnin”, Journal of Korea Multimedia Society, Vol. 24, No. 2, pp. 208–214, 2021.
[25] S. S. Farfade, M. J. Saberian and L. J. Li, “Multi-View Face Detection Using Deep Convolutional Neural Networks,” ACM International Conference on Multimedia Retrieval (ICMR), pp. 643–650, 2015.
[26] Diagnosis Guideline of Severe COVID-19 Patients, Korean Society of Critical Care Medicine (KSCCM), (v.1.1), March, 2020.
[27] Gary B. Smith, David R. Prytherch, Paul Meredith, Paul E. Schmidt, Peter I. Featherstone, “The ability of the National Early Warning Score (NEWS) to discriminate patients at risk of early cardiac arrest, unanticipated intensive care unit admission, and death” Resuscitation, Vol. 84, Issue 4, pp. 465–470, 2013.
[28] Huang, Chaolin, et al. “Clinical features of patients infected with 2019 novel coronavirus in Wuhan, China.” The lancet, vol. 39, no. 10223, pp. 497–596, 2020.
[29] Grassin-Delyle, Stanislas, et al. “Metabolomics of exhaled breath in critically ill COVID-19 patients: A pilot study.” EBioMedicine, vol. 63, 2021.
[30] Carruthers S, McCall B, Cordell B, Wu R., “Relationships between HR and PR interval during physiological and pharmacological interventions.”, Br J Clin Pharmacol, vol. 23, no. 3, pp. 259–265, 1987.
[31] Pavri, B. B., Kloo, J., Farzad, D., Riley, J. M., “Behavior of the PR interval with increasing heart rate in patients with COVID-19. Heart rhythm”, vol. 17, no. 9, pp. 1434–1438, 2020.
[32] Karjalainen, Jouko; Viitasalo, Matti. Fever and cardiac rhythm. Archives of internal medicine, 146.6: 1169–1171, 1986.
[33] Géron, Aurélien. Hands-on machine learning with Scikit-Learn, Keras, and TensorFlow. O’Reilly Media, Inc.,” 2022.
[34] Rish, Irina, et al. An empirical study of the naive Bayes classifier. In: IJCAI 2001 workshop on empirical methods in artificial intelligence. 2001. p. 41–46.
[35] Cover, Thomas; Hart, Peter. Nearest neighbor pattern classification. IEEE transactions on information theory, 1967, 13.1: 21–27.
[36] Friedman, Jerome H. Greedy function approximation: a gradient boosting machine. Annals of statistics, 2001, 1189–1232.
[37] Iwendi, C., Bashir, A.K., Peshkar, A., Sujatha, R., Chatterjee, J.M., Pasupuleti, S., Mishra, R., Pillai, S., Jo, O, “COVID-19 patient health prediction using boosted random forest algorithm”, Front. Public Health 8, 2020.
[38] Yanamala, N., Krishna, N.H., Hathaway, Q.A. et al., “A vital sign-based prediction algorithm for differentiating COVID-19 versus seasonal influenza in hospitalized patients,” NPJ digital medicine, vol. 4, no. 1, pp. 1–10, 2021.
[39] Github (https://github.com/adarsh1p/Covid-19-prediction).
[40] Dalianis, Hercules. “Evaluation metrics and evaluation.” Clinical Text Mining. Springer, Cham, pp. 45–53, 2018.
[41] S. M. Vieira, U. Kaymak and J. M. C. Sousa, “Cohen’s kappa coefficient as a performance measure for feature selection,” International Conference on Fuzzy Systems, Barcelona, Spain, pp. 1–8, 2010. doi: 10.1109/FUZZY.2010.5584447.
[42] Matthews, B. W. “Comparison of the predicted and observed secondary structure of T4 phage lysozyme”. Biochimica et Biophysica Acta (BBA) – Protein Structure. 405(2): 442–451. 1975. doi: 10.1016/0005-2795(75)90109-9. PMID 1180967.
[43] Jingxiu Yao and Martin Shepperd. Assessing software defection prediction performance: why using the Matthews correlation coefficient matters. In Proceedings of the Evaluation and Assessment in Software Engineering (EASE ’20). Association for Computing Machinery, New York, NY, USA, 120–129. 2020. https://doi.org/10.1145/3383219.3383232.
[44] Soui, M., Mansouri, N., Alhamad, R. et al. NSGA-II as feature selection technique and AdaBoost classifier for COVID-19 prediction using patient’s symptoms. Nonlinear Dyn 106, 1453–1475 (2021). https://doi.org/10.1007/s11071-021-06504-1.
Biographies

Tae-Ho Hwang received a B.Sc. degree in nuclear engineering, mechanical engineering and an MBA M.Sc. degree from Hanyang University, Seoul, South Korea in 1985 and 1991, respectively. He worked as a system engineer at Samsung Electronics from 1985 to 1991. Since 2020, he has been participating in the Ph.D. degree program at the Cognitive Computing Lab, Department of Computer Engineering, Gachon University. His research interests include big data, IoT, artificial intelligence, and deep learning.

KangYoon Lee received a B.Sc. degree in electronics engineering and an M.Sc. degree in computer science from Yonsei University, Seoul, South Korea in 1986 and 1996, respectively. He received a Ph.D. degree in IT policy management from Soongsil University, Seoul, South Korea, in 2010.
From 2008 to 2014, he was a Director at the IBM Korea Lab for Ubiquitous Computing and Software Solutions, and was promoted to leader of the IBM Watson Business Unit, Korea in 2014. Since 2016, he has been a professor with the Computer Engineering Department, Gachon University, IT College. His research interests include cognitive computing, healthcare advisor, IoT platforms, and industry transformation.
Dr. Lee is a director of the Korean Society for Internet Information (KSII), and, since 2019, he has been vice president of the Korea Bigdata Society.
Journal of Web Engineering, Vol. 22_4, 597–614.
doi: 10.13052/jwe1540-9589.2242
© 2023 River Publishers