Risk Score Computation for Android Mobile Applications Using the Twin k-NN Approach
Mahmood Deypir1,* and Toktam Zoughi2
1Faculty of Computer Engineering, Shahid Sattari Aeronautical University of Science and Technology, Tehran, Iran
2Department of Electrical and Computer Engineering, Shariaty College, Technical and Vocational University (TVU), Tehran, Iran
E-mail: mdeypir@ssau.ac.ir; t.zoughi@shariaty.ac.ir
*Corresponding Author
Received 21 April 2023; Accepted 21 May 2024
Abstract
The Android operating system has a dominant market for use within a wide range of devices. Along with the widespread growth of the use of the Android system and the development of a huge number of apps for this operating system, new malicious apps are released daily by adversaries, which are difficult to identify and deal with. This is due to them using sophisticated techniques and strikes. Although there are a diverse range of classification models and risk estimation metrics for identifying malware in this operating system, there is still a requirement for more effective approaches in this context. In this paper, we present a new algorithm to calculate the security risk score of Android apps, which can be used to identify malicious apps from benign ones. This algorithm uses a novel technique named twin k-nearest neighbor. In this technique, to estimate the security risk of an unknown app, its nearest neighbors to malicious apps and its nearest neighbors to normal apps are computed separately using an appropriate distance formula. Then, the security risk of the input app can be computed using a simple formulation. In this formulation, the average distances of both k-nearest malicious apps and k-nearest non-malicious apps to the input app are used. In this way, the proposed method can calculate a high security risk for malware and a lower security risk for goodware. Experimental evaluations on real datasets show that the proposed algorithm has better performance over the previously proposed ones in terms of detection rate, precision, recall, and f1-score.
Keywords: Malware detection, twin k-NN, realistic risk estimation, security risk.
Article Highlights
• A new technique named twin k-nearest neighbors was devised for realistic risk measurement.
• The Hamming distance formula is used in order to compute the risk score of unknown apps.
• A new algorithm is developed based on a new formulation of risk computation for Android apps.
• Extensive experiments shows that the proposed method is superior to previously proposed approaches.
• The proposed method has the highest precision, recall, and f1-score.
1 Introduction
Today, the use of the Android operating system is not limited to mobile devices, and a wide range of devices, including tablets, virtual reality headsets, navigating devices installed on cars, smart TVs, wearable devices like smart watches, etc., are equipped with this operating system. This widespread usage has resulted in an increase in malicious applications. The presentation of malware such as the Big Brother malware [1], which remotely records the user’s actions in virtual reality headsets, showed that such devices are not immune to security attacks by Android malicious apps. On the other hand, the techniques used by intruders have also expanded in such a way that much malware can trick various detection methods and find their way into the target system. For example, in 2022, a family of malware in Google Play was identified with the help of security researchers after three million downloads and installations by different users [2]. This malware generally performs malicious actions such as stealing personal data, conducting financial exploits, creating fake requests, etc. on the victim’s systems. Therefore, in order to protect people’s privacy and protect their assets, as well as to prevent abuse of their systems, we need new and more powerful solutions that have a higher detection rate than previous methods.
In this article, a new algorithm is proposed in order to measure the security risk score for unknown input apps. Its main idea is relatively simple but produces interesting results on real datasets. Our contributions are as follow. The first is using the nearest neighbor idea in a different manner for risk measurement instead of classification. A technique named twin k-NN which identifies the k-nearest malware and the k-nearest normal apps, separately, from the input app in order to estimate its security risk value. Second, using Hamming distance for identifying the nearest neighbors within malware and normal apps. Third, developing a novel criterion for risk estimation of Android apps which has the highest detection rate with respect to previously proposed metrics. Therefore, the proposed algorithm, can help the user in deciding whether to install or not to install the app. Moreover, it can be used by Android app stores in order to sift through potential malware submitted by malicious developers. In order to evaluate the proposed algorithm, we have used four different data sets including useful and malicious apps. Our extensive experiments showed that the proposed method performs significantly better than the previous methods in detecting malicious apps. The remainder of this paper is organized as follows. In the next section, some of the research work related to Android malware detection and risk computation are reviewed. In the third section, the problem is stated. In the fourth section, the proposed criterion and its corresponding algorithm are described. The fifth section reports our extensive experimental evaluations. In this section, using real world datasets consisting of hundreds of malwares and thousands of known benign Android apps, the proposed criterion will be compared to the previously proposed ones in terms of malware detection rate, precision, recall, and f1-score. Finally, this paper is summarized and concluded in the sixth section.
2 Related Works
In order to identify malwares in different operating systems, including the Android operating system, various methods have been provided so far. Among the various existing models, methods based on support vector machine [3–5], simple Bayes [6–8], neural networks [9] and deep neural networks [10, 11] compared to other models are more widely used and have shown better performance. Creating a classification model to identify malware has some disadvantages. First, the models usually have classification errors, secondly, they lose their effectiveness with the passage of time and the discovery of new instances of malicious and non-malicious apps, and thirdly, by identifying these models with the help of white box and black box methods, intruders are able to deceive and they will be passed in such a way that they can show malware samples as useful apps [12, 13]. The above defects are more or less in the risk estimation metrics. In addition, by calculating the security risk of Android apps, an app can be selected from multiple applications with the least amount of security for installation and use. Gate et al. have explored the impact of effectively presenting users with a security risk rather than a list of required permissions for Android apps. Since users are not technical people, they showed that calculating and presenting a security risk can be effective in their decisions and choices because they will avoid installing risky and malicious apps [14]. Peng et al. presented a probabilistic model to calculate the security risk of Android applications, which can be used to rank Android applications according to their security risk [15]. These models were developed in the article [16] and several new criteria were presented in order to calculate the security risk of applications. Among them, the RSS model was more suitable than the other models because it offered a higher malware detection rate while being simple. This means that if we have a list of useful and malicious apps in a mixed form and calculate the security risk for them, malicious apps will be assigned a higher security risk than normal ones based on this criterion. In [17], a new criterion based on information gain was presented in order to estimate the security risks of Android software. This measure uses the information gain of permissions to calculate security risk. Based on this, in the article [18], a measure called ERS was presented to estimate the security risk, which has shown good performance compared to RSS and other metrics.
In [19], based on the static analysis of applications, a method was presented to estimate the security risk of Android applications, which focuses on the application’s use of data in order to prevent personal data theft. In the combined and developed solution of this method [20], with the help of static and dynamic analysis of an app, how data is used is monitored. This method assigns a high security risk to Android apps where the use of data is contrary to their purpose and application. In this way, if an application intends to collect personal local data and send them on, it increases corresponding security risk. The problem with this method is that it is specific because it focuses on personal data and measures the risk based on how it is used, while malware can present a wide range of security risks. The calculation of the security risk of Android applications based on a sample was investigated in [21]. In this method, instead of using different features individually, all previous examples of normal apps and malware are used to calculate the security risk of an input app. In this method, the center of each group is obtained with the help of the feature vector of useful and malicious apps separately. Then, with the help of a simple criterion, the security risk of an input app is calculated through the Euclidean distances of its feature vector to non-malicious and malicious apps.
For Android malware detection, we need to extract the necessary features to build the model. These features can generally be extracted by static analysis and decompiling programs or by runtime behavioral analysis. Most of the research conducted in the field of Android malware detection has introduced feature extraction as the first step of the method. For example, in [22], various features such as permissions, functions, addresses of used links, intentions, hardware features, and components were extracted from existing malicious and non-malicious apps and then used them to build a support vector machine model. Some researches focus on the use of requested permissions of apps in order to identify malicious or suspicious apps [23, 24]. Some previously proposed approaches have also used the static analysis of the application code, in the form of extracting the used programming functions and matching them with some existing patterns of malware, to detect new malware [25–28]. In [29], a binary feature representation based on system call subsequences was proposed for machine learning based Android malware detection. A number of researchers have also presented methods that try to detect malicious apps by analyzing the behavior of running apps to extract dynamic features [30–34]. A model named SNDGCN was developed in [35] for robust Android malware detection based on the Android function call graph (FCG) and the denoising graph convolutional network. Existing graph-based malware detection methods suffer from high computational cost in constructing or updating a graph for APK under detection. In order to solve this problem, in [36] a novel global heterogeneous graph-based Android malware detection method named GHGDroid was devised which has a good updatability. Barrera et al. [37] presented a method for the practical evaluation of permission-based security models with the help of self-organizing maps. They applied their method to analyze the distribution of permissions on a thousand of apps and showed how permission usage correlates with app categories. In [38], an attempt has been made to detect data leakage by decompiling and analyzing the obtained application code. Enck et al. [39] developed a system that uses a combination of dangerous permissions to determine how to satisfy security policies. In these policies, the combination of dangerous permissions such as location and internet access permissions are considered manually. These combinations are obtained by analyzing known malware. A tool called MAST was developed in [40] that detects an app that is most likely malware based on code analysis and permission analysis. Using the static analysis of Android code, the PScout tool [41] examines how a permission is mapped to the function in Android. This tool showed that Android’s permission system has minimal redundancy and this issue remained stable as Android developed and released new versions of this operating system. Some research has also more specifically dealt with feature extraction and engineering, among which [42–47] can be mentioned. In [44], an attempt has been made to extract suitable features for malware detection by examining resources at different levels of an Android application. In [45], instead of manually engineering the features, a method based on deep learning and convolutional neural networks has been used to analyze the features necessary to identify malware. An automated feature extraction method without any manual expert intervention was exploited in a variant of a convolutional neural network (CNN) named MADRF-CNN [46]. It captures the dependencies between different parts of the image transferred from the Dex file within any Android APK package file. An Android malware detection framework based on convolutional neural network was devised in [47] where various types of features including API calls, intents, and permissions are automatically selected. In this study, our goal is to provide a more accurate and stronger criterion to measure the security risk of Android apps. Therefore, our research is closer to the research presented in [14–21], including methods that focus on security risk computation.
3 Problem Statement
As mentioned in the previous section, calculating the security risk is one of the methods of identifying potential malware that can be used by end users or app stores. Security risk is a value that is directly related to the probability of an Android application being malware. That is, the higher this value is, the higher the probability of an app being malware, but this value itself is not a probability and does not follow the rules of probability. In fact, there is no limitation of the value range. It is enough to have a higher value of risk for malware than for normal apps. Malicious or suspicious apps usually have a high security risk because they are able to create risks for their users by using the permissions they receive, the functions they use, the hardware capabilities, and software resources they take over. Using these resources by an Android app A can be encoded by a binary feature vectors in which the value of shows the state of using or not using resource i by this app. A high security risk for app A does not necessarily mean that the app is malicious. In fact, some useful apps, due to their functionality, might use various resources to provide the necessary services to users and not for malicious activities. Therefore, in order to better distinguish malware from benign apps and prevent misdiagnosis, we need a metric that uses the pattern and behavior of current malware and normal apps and can identify malicious apps from benign ones by assigning them high security risk values. Therefore, our goal is to provide a criterion and a method to obtain a reasonable estimate for the level of security risk of Android applications. Considering the extent and depth of Android malware threats in recent years, the problem is to propose a more effective metric and corresponding algorithm compared to a recently proposed one in term of detection rate. High detection rate means, if we sort a mixture of useful and malicious apps in descending order according to the amount of security risk estimated by this criterion, more malware will be at the beginning of the resulting list.
4 Proposed Method
In order to calculate the security risk of apps, it is necessary to use past information about useful and malicious apps. But how they must be used has a great impact on the performance of each risk computation metric. Different features can be extracted from any Android app, regardless of whether it is useful or malicious. As mentioned in the previous section, features mean specifications such as required permissions, used functions, software and hardware resources, network addresses, etc. These features can be extracted by reverse engineering of malicious and non-malicious apps by relevant tools. Some of the previous methods for Android apps identify the features that have direct impact on being normal or malicious and use them to estimate the security risk. For example, which permissions or functions have a higher usage rate in previous malware or which permissions or functions are used less in normal apps. Therefore, such methods look for influential parts of the feature vectors extracted from previously known apps. However, in the proposed method, we try to use the entire feature space in order to calculate the security risk. The general idea is, for each input unknown app, first the k-nearest neighbors of the useful apps and the k-nearest neighbors of malicious apps are determined, separately. That is, for each input app, first, k-nearest neighbors are identified separately from useful and malicious apps, and then the security risk of the input app is calculated based on them. We have named this technique twin k-nearest neighbor since it finds the k-nearest neighbor of an input app once among malware and once among normal apps. Figure 1 shows the general idea of the proposed method. Used symbols are defined within this figure. In this figure, malicious and useful apps are shown on the left and right side of the input app, respectively. As you can see in this figure, the unknown input app for which we want to calculate the security risk is shown using white color and a question mark. Here is considered. As this figure shows, by calculating the distance of all useful and malicious apps with the unknown input app separately, the three nearest neighbors of the malicious app type and the three nearest neighbors of the normal type have been identified. Those instances of k-nearest malware and k-nearest benign apps that are effective in risk calculation are enclosed with a curve. Then, with the help of the formulas that we will explain, the amount of security risk for the unknown input app is calculated.
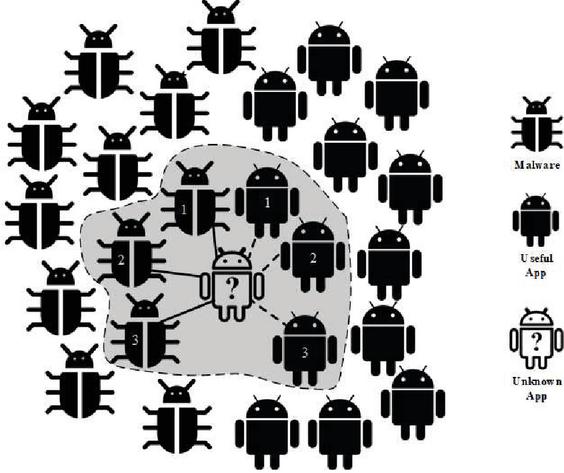
Figure 1 Calculate the distances to find the nearest neighbors of the useful app and the nearest neighbors of malicious apps.
The Hamming distance is used here to obtain the nearest neighbors of each type for the input application. The reason for using the Hamming distance is the nature of the data encoded as binary feature vectors. In fact, each app is represented as a bit vector. After obtaining the nearest neighbors of each type, the average distance to each category of neighbors is calculated. Therefore, two average values are obtained. The average distance between input app and k-nearest neighbors of normal apps is calculated as follows:
| (1) |
In this formula, HDM means the average Hamming distance of app X to the k-nearest neighbor of the malware type. and are, respectively, the ith feature of the input app and the ith feature of the jth nearest neighbor of the malware type. The variable F is the set of features and is the number of these features. Each attribute or feature is a binary variable that indicates whether or not a permission, function, or other resource is used for each application. The Hamming distance between these two binary single values and is calculated using the bitwise XOR () operator. Then the XOR values are added together to obtain the Hamming distance between the input app X and each neighbor . Similarly, after obtaining the nearest neighbors of malware, the average Hamming distance of app X (HDB(x)) to the k-nearest neighbors of the normal apps is calculated as follows:
| (2) |
Here means the ith feature of the jth nearest neighbor of normal apps. Other used symbols are similar to the previous formula. After calculating these two values according to Equations (1) and (2), the security risk for the unknown input app X can be computed as follows:
| (3) |
In Equation (4), the numerator and denominator are respectively the sum of the Hamming distance to the k-nearest neighbor of the useful app type and the sum of the Hamming distance to the k-nearest neighbor of the malicious app type. In fact, the main idea of this criterion is based on the fact that the greater the Hamming distance of the unknown input app to the nearest malicious apps, the lower the security risk. Conversely, the greater the distance to the nearest normal applications, the greater the security risk.
Example: Based on Figure 1, suppose that if the Hamming distances of an unknown input app to the first, second, and third benign apps are 2, 3, and 4, respectively, and the Hamming distances of it to the first, second, and third malicious apps are 3, 4, and 4, respectively. The security risk value (SRisk) of app based on the proposed metric is obtained as:
Based on the mentioned steps and the criteria presented above, we have designed an algorithm that calculates the security risk for an unknown input app x. This algorithm is shown in Figure 2. We have called this algorithm NHRS (nearest neighbor based on Hamming distance risk score) because it calculates the security risk for an input app with the idea of k-nearest neighbors based on Equation (4). The symbols used in this algorithm and the above formulation are shown in Table 1 and we explain this algorithm based on the definition of these symbols. The algorithm in Figure 2 receives the set of previously known programs SA, the unknown app x and k as input parameters. Here, k is the parameter of the algorithm which determines the number of neighbors. It returns a security risk value of app x as output. In the first line, the set of malicious apps is obtained from the whole set of apps. In line 2, variable , which is necessary to store the sum of the distances of the nearest malicious apps neighbors to input app , is initialized.
In lines 3 to 14, the necessary calculations are performed k times to obtain the nearest malicious neighbors, which we will explain as follows. In line 4, the first app from the set of malicious apps are regarded as the initialization of the nearest malicious neighbor. Then, its Hamming distances to the input app is calculated in line 5. In lines 6 to 11, we identify the closest malicious apps by checking all the members belonging to the set of malicious apps and calculating their Hamming distance with the input app x. The statement of 12 removes this app from the set of malicious apps so that in the next round we can identify other nearest neighbors of this type. Then in line 13, we add the value of the Hamming distance with the partial sum of the Hamming distances to the nearest known neighbors so that at the end of the remaining rounds we have the sum of the Hamming distances of all k-nearest malicious neighbors in the corresponding variable.
We do the same process in lines 15 to 27 for benign apps to finally get the nearest neighbor of the benign type with the input app and also update the corresponding variables. Consequently, by executing k rounds in the same way, the sum of k distances of the nearest malicious apps and the sum of k distances of the nearest benign apps will be in variables and , respectively. Finally, in line 26, the security risk of the input app x will be obtained by dividing by .
| Procedure NHRS(SA, x, k) |
| begin |
| 1. ; |
| 2. =0; |
| 3. for i 1 to k do |
| 4. nm first member of SMA; |
| 5. ; |
| 6. for each do |
| 7. ; |
| 8. if then |
| 9. ; |
| 10. ; |
| 11. Endfor; |
| 12. ; |
| 13. ; |
| 14. Endfor; |
| 15. ; |
| 16. ; |
| 17. for i 1 to k do |
| 18. nb first member of SBA; |
| 19. ; |
| 20. for each do |
| 21. ; |
| 22. if then |
| 23. ; |
| 24. ; |
| 25. Endfor; |
| 26. ; |
| 27. ; |
| 28. Endfor; |
| 29. return ; |
| end |
Figure 2 The security risk calculation algorithm based on the proposed criteria.
As explained, the above algorithm is able to calculate a continuous value for security risk based on formula (3) for each input app. Here, if there is a change over time in the patterns used by intruders, or if the intruder tries to trick the system, it will lead to a change in the amount of security risk, which is a continuous value and not zero or one, as in machine learning methods, where the answer is wrong and causes it to mislead the user in making a decision because ranges of values can be considered for high-risk, low-risk and safe ranges and a small change in the risk value will still keep the result in the right range. However, to compute a more realistic risk value we must added recently known malware and benign app information to our model.
Table 1 Used symbols and their meaning
| Symbol Name | Meaning |
| XOR operator | |
| HDM | Average hamming distance to k-nearest malware |
| HDB | Average hamming distance to k-nearest benign apps |
| jth nearest malware | |
| jth nearest benign app | |
| ith feature of jth nearest malware | |
| ith feature of jth nearest benign app | |
| SA | Set of malicious and normal apps |
| x | Unknown input app |
| K | Number of nearest neighbors of each type |
| SBA | Set of benign (normal) apps |
| SMA | Set of malicious apps |
| nb | A nearest neighbor of normal app type |
| nm | A nearest neighbor of malicious app type |
| HD | Hamming distance calculation function of two apps |
| Hamming distance to the nearest neighbor of the normal app type | |
| Hamming distance to the nearest neighbor of the malicious type | |
| A member of the set of normal apps | |
| A member of the set of malicious apps | |
| sb | The sum of the hamming distances to the nearest neighbors of normal |
| app type | |
| sm | The sum of the hamming distances to the nearest neighbors of the |
| malicious app type |
5 Experimental Evaluation
In order to evaluate the proposed algorithm, in addition to the NHRS, we have implemented the most important criteria presented in previous researches. These criteria are RSS [16], IRS [21] and ERS [18]. According to the results of the comparisons presented in the relevant articles, among the existing methods, these three approaches have better performance than their previous competitors. As described in Section 2, the risk calculation approach in [20] considers a specific situation and is not considered as a general criterion, so it was not used in our experiments.
Table 2 The datasets used in the evaluations
| Number | Number | ||||
| No. | Dataset | of Apps | Types | of Features | Feature Type |
| 1 | Market2011 [14] | 136534 | Benign Apps | 122 | Permission |
| 2 | Malwares2011 [32] | 808 | Malwares | 122 | Permission |
| 3 | Drebin2014 [22] | 123453+5560 | Benign apps and malware | 385 | Permission, function, intent, address, resource |
| 4 | Deypir2019 [18] | 2180+1014 | Benign apps and malware | 135 | Permission |
5.1 Benchmark Datasets
In order to evaluate and compare these criteria, we have used four benchmark datasets described in Table 2, which have been used in previous research. In Table 2, the name of each dataset, the type of app within each dataset, the number and type of features are specified. According to this table, we have tried to use diverse datasets in order to conduct more reliable experiments. For additional information about each dataset, interested readers are referred to related references.
5.2 Evaluation Mechanism
Unlike classification models, the proposed method, and generally the methods of calculating security risk, do not definitely determine the maliciousness or non-maliciousness but they warn users about installing and using high-risk apps. As mentioned previously, a good risk measurement and estimation criterion should produce high risk values for malware and relatively small values for goodware in order to distinguish two types of apps from each other. Therefore, in experiments, the focus is on detection rates of these criteria. A measure that can relatively obtain a higher security risk for each malware is successful. That is, if we calculate the risk value for benign and malicious apps based on one criterion and then sort the overall list of apps in descending order of risk value, more malicious apps will be placed at the top of the list than benign apps. In the first experiment, the goal is to find the best value for the k parameter of the proposed method. In the second experiment, the aim is to compare the detection rate of the proposed method with the other three previously mentioned metrics. According to Table 2, the first dataset only includes useful apps and the second dataset only contains malware, but the third and fourth datasets contain both malware and benign apps. For this reason, in our experiments, we put the first (Market2011) and second (Malwares2011) datasets in a single list, but there is no need for the third and fourth datasets because they include both types of app. Benign apps and malware are in a single list. In each case, we make our model using 90% of the resulting list. Then we test each criterion using the remaining 10%. In this way, using the obtained model, we have calculated their security risk and then sorted them in descending order of obtained risk values. In each experiment, we select different percentages from the apps at the top of the resulting list and check what percentage of malware is included in this part of the list. We call the selected percentages of the list, the warning rate, and the detected percentages of malware, the detection rate. If SMAT, DSMAT, DR are respectively a set of malware in test data, detected malware in the test set by a metric, and detection rate, in each evaluation, the following equation will be established:
| (4) |
Although the range of calculated risk values is different in various criteria, using this evaluation method, the difference in value ranges will not affect the comparisons because the warning rate here is not a specific number and is relative. Obviously, the stronger the criterion, the higher the percentage of malware at the top of the list is obtained and thus the higher the detection rate. In each case, we have obtained the detection rate according to the warning rate.
5.3 Determining the k Parameter
In the first experiment, we are going to determine the k parameter of the proposed method, which is the number of neighbors for malware and normal apps. For this purpose, we obtain the efficiency of the proposed method for different values of k to reach the appropriate value. The results of four datasets and different values of k are plotted in Figure 3 in the form of ROC curves. In this figure, the horizontal axis is the warning rate and the vertical axis is the malware detection rate. In other words, by selecting a certain percentage of the entire list of apps on the horizontal axis, the vertical axis shows the percentage of detected malware in this list. The ROC curve for the values of k 1,2,3,5,10 and also the area under the curve (AUC) from zero up to different percentages of the warning rates are shown. As shown in this figure, we obtained the detection rate of the proposed method for different values of k 1,2,3,5,10 and finally conclude that after no tangible change can be seen. In fact, there was very little difference between and . Therefore, after , there is no need to further increase this variable, because its increase not only does not affect the performance, but also increases the execution time. Therefore, we have considered the final value of this parameter equal to 10. As can be seen in Figure 3, for all datasets, after , there is not much change in performance, and even for the third dataset, after , we do not have much change in performance. In fact, a tangible change cannot be seen between and .
5.4 Performance Comparison
In the following experiments, we have compared the efficiency of the proposed method with the determined value of to other methods. Figure 4 shows the corresponding ROC for the proposed criterion and other criteria on different datasets. In this figure, again the horizontal axis is the warning rate and the vertical axis is the malware detection rate. As can be seen in the different subplot of this figure, the proposed method shows significant efficiency compared to all previous methods, especially in the first and second integrated datasets (subplot (a)) and the fourth dataset (c). The ERS, IRS and RSS methods are in the next ranks of efficiency. In the case of the third dataset (b), it can be seen that, for low warning rates, the proposed method has not shown good performance, but with the increase in the warning rate, its detection rate has increased, and compared to the other three methods, its detection rate becomes greater. As can be seen from the different subfigures of Figure 4, in general, the proposed method has higher detection rate, which shows that it is a stronger criterion for calculating the security risk and finally detecting malware.
The reason for the superiority of the proposed method over the previous methods is that in the proposed twin k-NN, the idea of the closest neighbors of malware and the nearest neighbors of apps are used separately to calculate the risk values. On the other hand, due to the binary nature of the data, the Hamming distance has been used. In addition, the proposed method calculates the Hamming distance in the multi-dimensional space of the samples and uses the information of other bad and good samples of apps correctly, while in the ERS and RSS methods, the selected features are used separately to calculate the risk. In fact, in ERS and RSS criteria, the risk of each feature is calculated separately, while in the proposed method, all good and bad samples are used to calculate risk according to the criteria of formula (4). In the IRS criterion, although the entire multidimensional space of samples is used together, the distances to the center of bad and good samples are calculated and the nearest neighbors are not used. On the other hand, it used the Euclidean distance, which is not compatible with the nature of the data. Therefore, the proposed method works better than other risk calculation criteria.
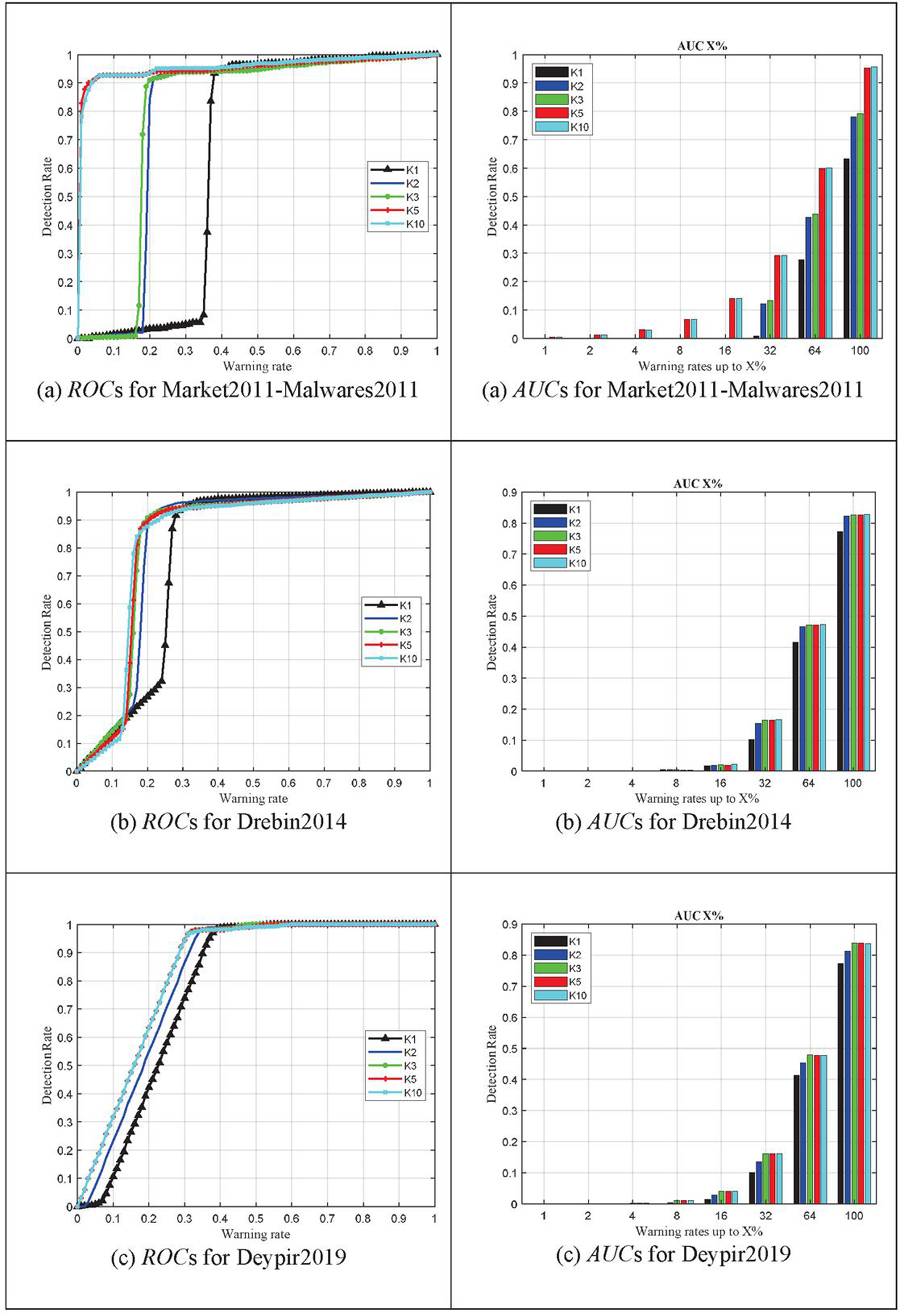
Figure 3 Comparing the detection rate of the proposed criterion using ROC and AUC charts for different values of k parameter.
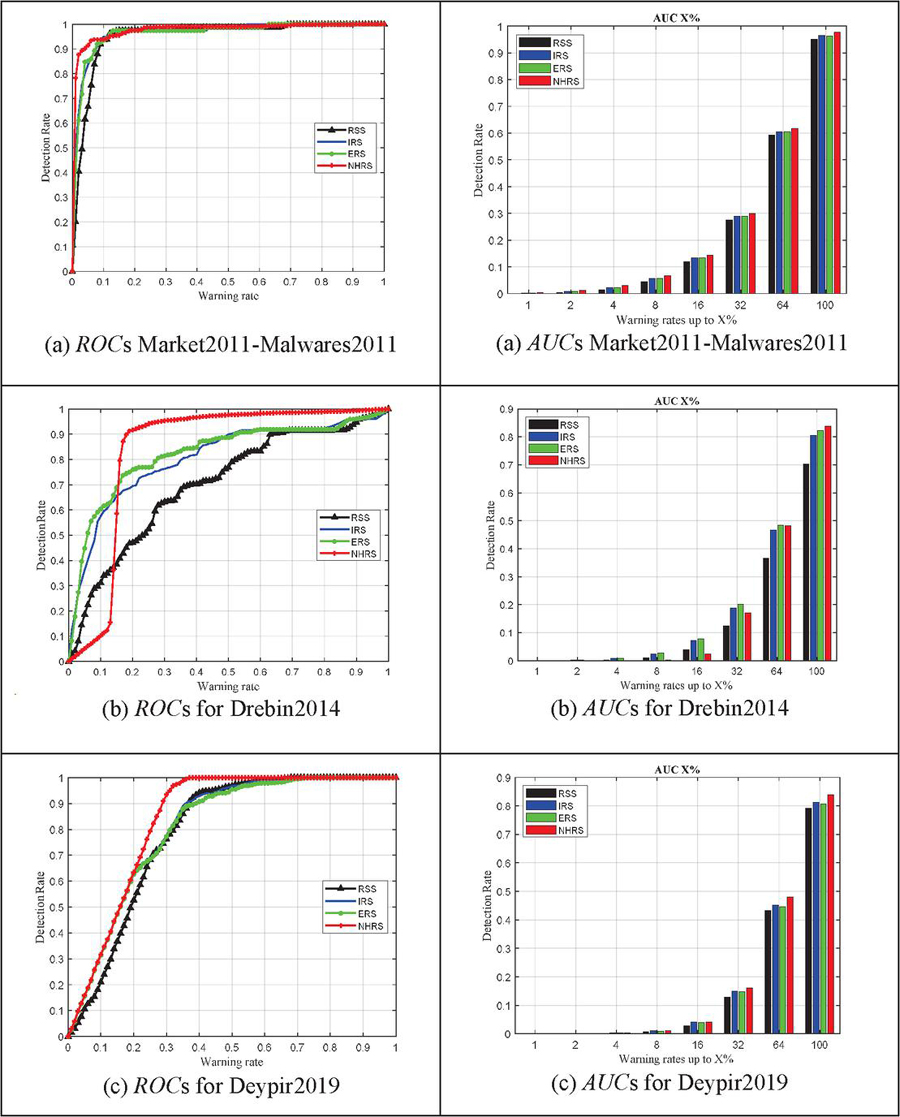
Figure 4 Comparing the detection rate of different criteria using their ROC and AUC charts.
5.5 Precision, Recall, and f1-scores
In the next experiment, precision, recall, and f1 scores of all risk computation metrics on all datasets are computed and the result are reported in Table 3. For this purpose, the following values are determined in the results. True positive indicates malware that has been detected successfully. False positive indicates the number of benign apps mistakenly detected as malware. False negatives show the amount of malware that has been incorrectly identified as benign apps. Precision is the ratio of the number of malwares successfully detected to the total number of all the detected malwares. The equation for this ration is shown as follows (5):
| (5) |
Recall is the amount of malware that was successfully detected to the number of all the malwares detected successfully or categorized unsuccessfully as harmless ratio:
| (6) |
The f-score is the harmonic mean from the precision and recall is the criterion indicating how capable the model act in distinguishing between the two classes.
| (7) |
As can be seen in Table 3, for all datasets, the proposed NHRS obtains the best precision, recall and f1-score. The reason is that the proposed NHRS estimates the amount of risk value more accurately than other criteria. Therefore, in the results it obtains true positives, fewer false positives, more true negatives and fewer false negatives compared to other risk measurement criteria.
Table 3 Comparing precision, recall, and f1-scores
| Dataset | Criteria | Precision | Recall | f1-score |
| Market 2011 – Malwares 2011 | RSS | 0.3012 | 0.3005 | 0.3009 |
| IRS | 0.5272 | 0.5252 | 0.5262 | |
| ERS | 0.4432 | 0.4421 | 0.4427 | |
| NHRS | 0.7679 | 0.7660 | 0.7670 | |
| Drebin 2014 | RSS | 0.0670 | 0.7771 | 0.1234 |
| IRS | 0.0792 | 0.9185 | 0.1458 | |
| ERS | 0.0777 | 0.9013 | 0.1430 | |
| NHRS | 0.0831 | 0.9644 | 0.1530 | |
| Deypir 2019 | RSS | 0.7861 | 0.7815 | 0.7838 |
| IRS | 0.8139 | 0.8091 | 0.8115 | |
| ERS | 0.8040 | 0.7969 | 0.8004 | |
| NHRS | 0.9248 | 0.9220 | 0.9234 |
6 Conclusion
Today, the Android operating system is widely used in a wide range of devices, including mobile phones, smart watches, cars, home appliances, virtual reality headsets, etc. Due to the popularity of the Android operating system in a wide range of devices and systems, as well as the increasing complexity of its security attacks and its vulnerabilities through malware, the need to provide stronger methods to identify and deal with these threats exists. In this study, a new criterion, namely NHRS, for calculating the security risk of Android apps was introduced and a new algorithm was developed based on it. Experiments conducted on real data related to Android useful and malicious apps showed that the proposed method performs much better than recently proposed ones in terms of detection rate, precision, recall, and f1-score. The superiority and robustness of the proposed method over previous methods has three main reasons. First, the proposed criterion uses the k-nearest neighbors of useful and malicious apps in order to better estimate security risk values. Second, it is an instance-based method and it utilizes the entire feature space of previous apps. Third, the use of the Hamming distance produces more appropriate values than other types of distances such as Euclidean distance due to the binary nature of feature vectors. For future work, we plan to use different deep learning models in order to more accurately estimate the security risk of Android applications. Also, we are going to use dynamic features in addition to the static features of the apps for more realistic risk estimation.
Statements and Declarations
The authors declare that they have no known competing financial interests or personal relationships that could have appeared to influence the work reported in this paper.
References
[1] https://inside.com/xr/posts/hackers-remotely-connect-to-vr-devices-via-big-brother-malware-299588 [Access Date august 30 2022].
[2] https://www.bleepingcomputer.com/news/security/new-android-malware-on-google-play-installed-3-million-times/ [Access Date august 30 2022].
[3] L. Wen and H. Yu, “An Android malware detection system based on machine learning,” vol. 20136, p. 20136, 2017.
[4] S. Gunalakshmii and P. Ezhumalai, “Mobile keylogger detection using machine learning technique,” Proc. IEEE Int. Conf. Comput. Commun. Syst. ICCCS14, no. November 2011, pp. 051–056, 2014.
[5] J. Sahs and L. Khan, “A Machine Learning Approach to Android Malware Detection,” 2012 Eur. Intell. Secur. Informatics Conf., pp. 141–147, 2012.
[6] S. Y. Yerima, S. Sezer, and I. Muttik, “Android Malware Detection Using Parallel Machine Learning Classifiers,” 2014 Eighth Int. Conf. NextGener. Mob. Apps, Serv. Technol., no. Ngmast, pp. 37–42, 2014.
[7] M. G. Schultz, E. Eskin, E. Zadok, and S. J. Stolfo, “Data Mining Methods for Detection of New Malicious Executables,” Proc. 2001 IEEESymp. Secur. Priv., p. 38, 2001.
[8] W. G. Hatcher, D. Maloney, and W. Yu, “Machine learning-based mobile threat monitoring and detection,” 2016 IEEE/ACIS 14th Int. Conf. Softw. Eng. Res. Manag. Appl. SERA 2016, pp. 67–73, 2016.
[9] C. Gavrilu, Drago, Mihai, D. Anton, and L. Ciortuz, “Malware detectionusing machine learning,” Comput. Sci. Inf. Technol. 2009. IMCSIT’09. Int. Multiconference, pp. 735–741, 2009.
[10] Y. Chen, Y. Li, A. Tseng, and T. Lin, “Deep Learning for Malicious Flow Detection,” IEEE Access, p. 7, 2018.
[11] Rahali, A., Lashkari, A. H., Kaur, G., Taheri, L., Gagnon, F., & Massicotte, F. (2020, November). Didroid: Android malware classification and characterization using deep image learning. In 2020 The 10th international conference on communication and network security, pp. 70–82.
[12] Li, H., Zhou, S., Yuan, W., Luo, X., Gao, C., and Chen, S. (2021, April). Robust android malware detection against adversarial example attacks. In Proceedings of the Web Conference 2021 (pp. 3603–3612).
[13] H. Li, S. Zhou, W. Yuan, J. Li, and H. Leung, “Adversarial-example attacks toward android malware detection system,” IEEE Systems Journal, 14(1), pp. 653–656, 2019.
[14] C. S. Gates, J. Chen, N. Li, and R. W. Proctor, Effective risk communication for android apps. IEEE Transactions on dependable and secure computing, 11(3), pp. 252–265, 2013.
[15] H. Peng, C. Gates, B. Sarma, N. Li, Y. Qi, R. Potharaju, and I. Molloy, “Using probabilistic generative models for ranking risks of android apps,” In Proceedings of the 2012 ACM conference on Computer and communications security, ACM, October 2012, pp. 241–252.
[16] C. S. Gates, N. Li, H. Peng, B. Sarma, Y. Qi, R. Potharaju, and I. Molloy, “Generating summary risk scores for mobile applications,” Dependable and Secure Computing, IEEE Transactions on, 11(3), 2014, pp. 238–251.
[17] M. Deypir, “Estimating Security Risks of Android Apps Using Information Gain,” Electronic and Cyber Defense, 5(1), 2017, pp. 73–83 (in Persian).
[18] M. Deypir, “Entropy-based security risk measurement for Android mobile applications,” Soft Computing, 23(16), pp. 7303–7319, 2019.
[19] Son, H. X., Carminati, B., and Ferrari, E. (2021, August). A Risk Assessment Mechanism for Android Apps. In 2021 IEEE International Conference on Smart Internet of Things (SmartIoT) (pp. 237–244). IEEE.
[20] Son, H. X., Carminati, B., and Ferrari, E. (2022). A Risk Estimation Mechanism for Android Apps based on Hybrid Analysis. Data Science and Engineering, 1–11.
[21] Deypir, M., and Horri, A. (2018). Instance based security risk value estimation for Android applications. Journal of information security and applications, 40, 20–30.
[22] Arp, D., Spreitzenbarth, M., Hubner, M., Gascon, H., Rieck, K., & Siemens, C. E. R. T. (2014, February). Drebin: Effective and explainable detection of android malware in your pocket. In Ndss (Vol. 14, pp. 23–26).
[23] D. Geneiatakis, I. N. Fovino, I. Kounelis, and P. Stirparo, “A Permission verification approach for android mobile applications,” Computers & Security, 49, 2015, pp. 192–205.
[24] B. P. Sarma, N. Li, C. Gates, R. Potharaju, C. Nita-Rotaru, and I. Molloy, “Android permissions: a perspective combining risks and benefits,” In Proceedings of the 17th ACM symposium on Access Control Models and Technologies, June 2012, pp. 13–22.
[25] A. D. Schmidt, R. Bye, H. G. Schmidt, J. Clausen, O. Kiraz, K. Yüksel, and S. Albayrak, “Static analysis of executables for collaborative malware detection on android,” In Communications, 2009. ICC’09. IEEE International Conference on, June 2009, pp. 1–5.
[26] Y. Zhou, Z. Wang, W. Zhou, and X. Jiang, “Hey, You, Get Off of My Market: Detecting Malicious Apps in Official and Alternative Android Markets,” In NDSS, Vol. 25, No. 4, February 2012, pp. 50–52.
[27] Y. Aafer, W. Du, and H. Yin, “DroidAPIMiner: Mining API-level features for robust malware detection in android,” In Security and Privacy in Communication Networks, 2013, pp. 86–103.
[28] M. Christodorescu, S. Jha, C. Kruegel, “Mining specifications of malicious behavior,” In Proceedings of the 1st India software engineering conference, ACM, February 2008, pp. 5–14.
[29] R. Surendran, M. M. Uddin, T. Thomas, and G. Pradeep, “Android Malware Detection Based on Informative Syscall Subsequences,” IEEE Access, 2024.
[30] K. Rieck, T. Holz, C. Willems, P. Düssel, and P. Laskov, “Learning and classification of malware behavior,” In Detection of Intrusions and Malware, and Vulnerability Assessment, 2008, pp. 108–125.
[31] A. Shabtai, and Y. Elovici, “Applying behavioral detection on android-based devices,” In Mobile Wireless Middleware, Operating Systems, and Applications, 2010, pp. 235–249.
[32] I. Burguera, U. Zurutuza, and S. Nadjm-Tehrani, “Crowdroid: behavior-based malware detection system for android,” In Proceedings of the 1st ACM workshop on Security and privacy in smartphones and mobile devices, October 2011, pp. 15–26.
[33] Y. Zhou, and X. Jiang, “Dissecting android malware: Characterization and evolution”, In Security and Privacy (SP), 2012 IEEE Symposium on May 2012, pp. 95–109.
[34] D. Barrera, H. G. Kayacik, P. C. van Oorschot, and A. Somayaji, “A methodology for empirical analysis of permission-based security models and its application to android,” In Proceedings of the 17th ACM conference on Computer and communications security, October 2010, pp. 73–84.
[35] X. Lu, J. Zhao, S. Zhu, and P. Lio, “SNDGCN: Robust Android malware detection based on subgraph network and denoising GCN network,” Expert Systems with Applications, 123922. 2024.
[36] L. Shen, M. Fang, J. Xu, “GHGDroid: Global Heterogeneous Graph-based Android Malware Detection,” Computers & Security, 103846, 2024.
[37] D. Barrera, H. G. Kayacik, P. C. van Oorschot, and A. Somayaji, “A methodology for empirical analysis of permission-based security models and its application to android,” In Proceedings of the 17th ACM conference on Computer and communications security, October 2010, pp. 73–84.
[38] W. Enck, D. Octeau, P. McDaniel, and S. Chaudhuri, “A Study of Android Application Security,” In USENIX security symposium, August 2011, Vol. 2, p. 2.
[39] W. Enck, M. Ongtang, and P. McDaniel, “On lightweight mobile phone application certification,” In Proceedings of the 16th ACM conference on Computer and communications security, November 2009, pp. 235–245.
[40] S. Chakradeo, B. Reaves, P. Traynor, W. Enck, “Mast: triage for market-scale mobile malware analysis,” In Proceedings of the sixth ACM conference on Security and privacy in wireless and mobile networks, April 2013, pp. 13–24.
[41] K. W. Y. Au, Y. F. Zhou, Z. Huang, and D. Lie, “Pscout: analyzing the android permission specification,” In Proceedings of the 2012 ACM conference on Computer and communications security, October 2012, pp. 217–228.
[42] Li, L., Chen, X., and Song, C. (2022). A robust clustering method with noise identification based on directed K-nearest neighbor graph. Neurocomputing, 508, 19–35.
[43] Y. Cai, J. Z. Huang, and J. Yin, A new method to build the adaptive k-nearest neighbors similarity graph matrix for spectral clustering. Neurocomputing, 493, pp. 191–203, 2022.
[44] M. Yang, Q. Wen, Detecting android malware with intensive feature engineering. In 2016 7th IEEE International Conference on Software Engineering and Service Science (ICSESS), 2016, pp. 157–161. IEEE.
[45] N. Zhang, Y. A. Tan, C. Yang, and Y. Li, “Deep learning feature exploration for android malware detection,” Applied Soft Computing, 102, 2021, 107069.
[46] H. Zhu, H. Wei, L. Wang, Z. Xu, and V. S. Sheng. “An effective end-to-end android malware detection method,” Expert Systems with Applications, 218, 119593, 2023.
[47] A. T. Kabakus, DroidMalwareDetector: A novel Android malware detection framework based on convolutional neural network. Expert Systems with Applications, 206, 2022, 117833.
Biographies

Mahmood Deypir received his Ph.D. degree in 2011 and M.Sc. degree in 2006, both from Shiraz University. He is interested in researching areas such as data mining and pattern recognition, and network security. He has published a number of papers in ISI journals and international conferences.

Toktam Zoughi received her Ph.D. in computer engineering (artificial intelligence) from the Amirkabir University of Technology, Tehran, Iran, in 2019 and M.Sc. in computer engineering (artificial intelligence) from Shiraz University, shiraz, Iran, in 2010. Since January 2020, she has been an assistant professor at Department of Electrical and Computer Engineering, Shariaty College, Technical and Vocational University (TVU), Tehran, Iran. Her research interests mainly focus on deep learning, machine learning, speech processing, image processing, and NLP.
Journal of Web Engineering, Vol. 23_4, 535–560.
doi: 10.13052/jwe1540-9589.2343
© 2024 River Publishers