Optimized RMDL with Transfer Learning for Sentiment Classification in the MapReduce Framework
Konda Adilakshmi1, 2,*, Malladi Srinivas1, Anuradha Kodali2 and V. Srilakshmi2
1Koneru Lakshmaiah Education Foundation, Vaddeswaram, Andhra Pradesh, India
2Gokaraju Rangaraju Institute of Engineering and Technology (GRIET), Bachupally, Hyderabad - 500090, India
E-mail: lakshmiadi145@gmail.com
*Corresponding Author
Received 02 June 2023; Accepted 29 December 2023; Publication 22 February 2024
Abstract
A core task in sentiment analysis is sentiment categorization, and it is crucial to understand user feelings based on their remarks in social media or product evaluations. Due to ambiguous phrases, refusal words, and other factors, categorizing sentiment presents several challenging issues. The objective of this research is to develop a hybrid optimization-based deep learning model and MapReduce framework-based sentiment categorization approach. The review document is taken from a dataset and used in this case with the MapReduce methodology. MapReduce is a software framework and programming model for analyzing massive volumes of data that consists of two phases, mapper and reducer. BERT tokenization and aspect term extraction are executed in the mapper phase, whereas sentiment analysis is performed in the reducer stage utilizing random multimodal deep learning (RMDL) with transfer learning and AlexNet and ResNet 50 as pre-trained models. In addition, the exponential coot political algorithm (ECPA) is offered as an optimization algorithm for weight optimization in RMDL. The ECPA is obtained by combining the exponential weighted moving average model (EWMA) with the coot algorithm, as well as a political optimizer (PO). The proposed ECPA_RMDL model has acquired 90.9% precision, 89.7% recall, and 89.9% f-measure.
Keywords: MapReduce, deep learning, review document, AlexNet, ResNet 50.
1 Introduction
Big data analysis is gaining traction in computer science, and it characterizes the king-size of data that moves freely through social media, the web, remote sensing data, medical records, and so on, and can be structured, unstructured, or semi-structured [1]. Social media is one example of big data, and it serves to facilitate global connection and information sharing with the aim of linking individuals with comparable shared interests in order to achieve efficient information transmission among them. When compared to traditional media, which functions on the principle of a single source and multiple users, social media relies on various primary sources and receivers to ensure better reachability and usability [2]. Online public opinion research, mining for product or service reviews, and other applications all frequently use sentiment analysis. Text sentiment analysis is a well-established research topic in natural language processing (NLP). It is essential in an intelligent network or civilization [3]. Reviews contain rich user opinions on products and services [4]. One of the most important components of NLP object recognition is the identification of feelings. The emotions should be applied to many ways of communication, such as voice, facial expressions, and bodily indicators. Text messaging is presently the most widely used means of communication. Text messages can be used for a variety of purposes, and they are essential among texts for effectively understanding emotions. The user’s feelings can be understood by a tweeter chat, which can then respond in a more delicate and humane manner. If a gadget can detect emotions in message text, it can produce regular speech in a text-to-speech combination [5, 6].
Sentiment analysis and emotion detection are critical in discussion systems and have lately gained prominence [7]. These can be applied in many different situations, such as mining conversational participants’ opinions and enhancing robot agent feedback. Furthermore, sentiment analysis in live discussions can be utilized to generate conversations with certain feelings to improve human–machine interaction [8]. Analysis and knowledge extraction from subjective content posted online are the objectives of sentiment analysis. Sentiment analysis has recently emerged as a key area of research in data mining and NLP due to the wide range of academic and commercial applications it offers as well as the quick development of Web 2.0. In order to specify the polarity of a document, various methods and tools have been developed recently. Several applications of sentiment analysis depend on the binary classification task of polarity detection. To achieve excellent polarity classification results, most older approaches for sentiment analysis trained shallow models with effective features [9, 10]. The crucial component of big data known as sentiment analysis is sometimes denoted to as sentiment classification, opinion analysis, sentiment mining, or opinion mining. Due to the abundance of biased writings published in social forums, blogs, and the media in the early 2000s, it is a text classification system that gained popularity. Opinion surveys, e-commerce, agronomy speech recognition, and education all rely heavily on sentiment analysis [2].
Incremental learning investigates the learning technique in streaming data contexts as it appears in different shapes in the literature, and its use is not always consistent [11]. The requirement to use data mining techniques on streaming data, where the training of data instances takes place over a timeline, promotes incremental learning. Several applications for sentiment analysis can benefit from the binary categorization task of polarity identification. Many pioneering methods for assessing sentiment-optimized shallow models on carefully chosen helpful attributes to yield decent polarity classification results. On linguistic data such as parts of speech tags and vocabulary features, these models mainly used classical classification approaches such as support vector machines (SVM), naive Bayes (NB), and latent Dirichlet allocation (LDA) [10]. Neural networks [12] are currently popular due to their capacity to examine features automatically and adapt complexity models on large data sets. Deep learning approaches, in particular, demonstrated diverse historic performance in language translation and sentiment categorization [13, 14]. However, the NLP sector has seen substantial advancements in deep learning technology, and a number of deep learning-based online test sentiment valuation procedures have been devised. Recurrent neural networks (RNNs) [15] and convolutional neural networks (CNNs) [3] are used to extract sentence features. RNN and CNN are two neural network techniques that work well for automatically learning phrase features in deep learning. Several areas of artificial intelligence have seen considerable advancements because of this self-learning feature technique.
The major aim of this study is to build and develop an ECPA_RMDL technique for sentiment categorization in the MapReduce framework. The review document is extracted from a dataset and processed using the MapReduce methodology. Large volumes of data can be processed using the programming style and software architecture known as MapReduce. It comprises two phases namely mapper and reducer. In this instance, the mapper stage involves BERT tokenization and aspect term extraction, while reducer stage involves sentiment classification using RMDL with transfer learning and pre-trained models AlexNet and ResNet50. Furthermore, the ECPA optimization technique is proposed for weight optimization in the RMDL. However, the developed ECPA is a novel design that combines the EWMA and Coot algorithms, as well as the political optimizer (PO).
This paper suggests an effective sentiment classification method for MapReduce’s incremental document-level sentiment analysis using the ECPA RMDL. The ECPA technique is created here by combining the EWMA and coot algorithms with the PO technique.
This is the arrangement of the remaining sections of this investigative paper: in Sections 2 and 3, a literature review of common methods to sentiment classification is provided, followed by an explanation of a suggested technique. Following a discussion of the results of proposed technique in Section 4, and the conclusion is revealed in Section 5.
2 Motivation
Social networking websites are the most popular places for users to express themselves online. Moreover, sentiment analysis, often known as opinion mining, involves creating a system to compile and analyze opinions about a product that are expressed in blog posts, comments, or reviews. DL-based algorithms are used to successfully complete the sentiment analysis procedure because it is so crucial to people’s day-to-day lives. The DL-based method also produced favorable results. This section examines numerous literary problems and sentiment analysis-related literature.
2.1 Literature Survey
This section provides a review of a literature analysis of prevailing strategies for sentiment classification, as well as their merits and drawbacks. Li et al., [8] developed a framework called a bidirectional emotional recurrent unit (BiERU) for analysing informal sentiment. This framework showed that it was possible to streamline the model structure while also enhancing performance, but it did not explore the possibility of representing arguments with amplifiers and random turns. Basiri et al., [10] created an attention-based bidirectional CNN-RNN deep model (ABCDM), which improved semantic presentations but cannot be easily extended to other languages. Poongothai and Sangeetha [2] developed a chronological-brain storm optimization based support vector neural network (CBSO-SVNN), which efficiently managed larger dimension data and hence lowered complexity, although this technique only used basic phrases for sentiment classification. For training review sentiment classification, Thakur and Deshpande [19] introduced a kernel optimized-support vector machine (KO-SVM) classifier, which achieved the best performance with the least amount of data while not utilising additional datasets.
Liang et al., [16] developed a graph convolutional network based on SenticNet (GCN-SenticNet) to improve sentence graph dependencies. Long short-term memory (LSTM) layers were established in particular to learn contextual illustrations, while GCN layers were made to record the connections between contextual terms in different aspects. However, the approach obtained a comparative performance in a relatively bad result. Liu [17] created the combining bag of words (CBOW) linguistic model using deep learning for sentiment analysis. Here, the tuning method was greatly enhanced, which decreased the classification cross entropy loss function, but it was unsuccessful due to further enhancements to assessment performance. Alsayat [18] used word-embedding technology to create the LSTM network, which has good classification accuracy and can understand new and strange phrases. However, this model was not updated. Guo [6] developed a tensor voting-based scene text segmentation approach to address the issue that the natural scene text is frequently contaminated by various types of noises, such as stripes, highlights, and breaks, resulting in a drop in text recognition accuracy. However, the strategy neglected to focus on progress in emotion detection, modelling the magnitude of feelings, allowing many emotion classes to be active at the same time, and researching alternate emotion class models.
2.2 Challenges
The following are the shortcomings of existing approaches for sentiment classification.
• The BiERU approach proposed in [8] for sentiment analysis does not accept most of the current emotion classification models for improved discrimination of diverse emotions.
• Although ABCDM was introduced in [10], it did not evaluate the efficacy of this technique for other sentiment duties such as grading and support for prediction, as well as further stages such as sentences and feature level sentiment analysis.
• The introduced method in [2] did not integrate other effective deep learning techniques for sentiment classification, and the relationship between sentiment assessment of stock values and social network was not foreseen.
• KO-SVM was developed in [19], and for train reviews sentiment classification achieved top performance with minimal data quantity, despite not utilising additional datasets for best sentiment classification performance.
• On social networking sites like Facebook and Twitter, as well as on online review platforms like Yelp and Amazon, sentiment analysis is growing in popularity. Nevertheless, comprehensive data collection for high output efficiency remains a challenge. Reviews indicate less clarity regarding the capacity for generalisation and specialisation. This was the most difficult assignment.
3 Proposed ECPA_RMDL for Sentiment Classification
Sentiment classification is a specialized text categorization assignment with the objective of classifying articles according to their opinions. The objective of this research is to introduce a hybrid optimization-based DL model and MapReduce framework-based sentiment categorization approach. The review document is taken from a dataset and used in this case with the MapReduce methodology. MapReduce is a software framework and programming model for processing massive volumes of data that consists of two phases, mapper and reducer. In this situation, BERT tokenization and aspect term extraction are carried out in the mapper stage, and sentiment classification is carried out in the reducer step by RMDL with transfer learning and pre-trained AlexNet [20] and ResNet 50 [20] models. Furthermore, the optimization technique ECPA is developed for weight optimization in RMDL [21]. The ECPA is a novel design that incorporates EWMA [22], coot [23], and PO [24]. Figure 1 depicts the block diagram of the proposed ECPA_RMDL for sentiment classification in the MapReduce framework.
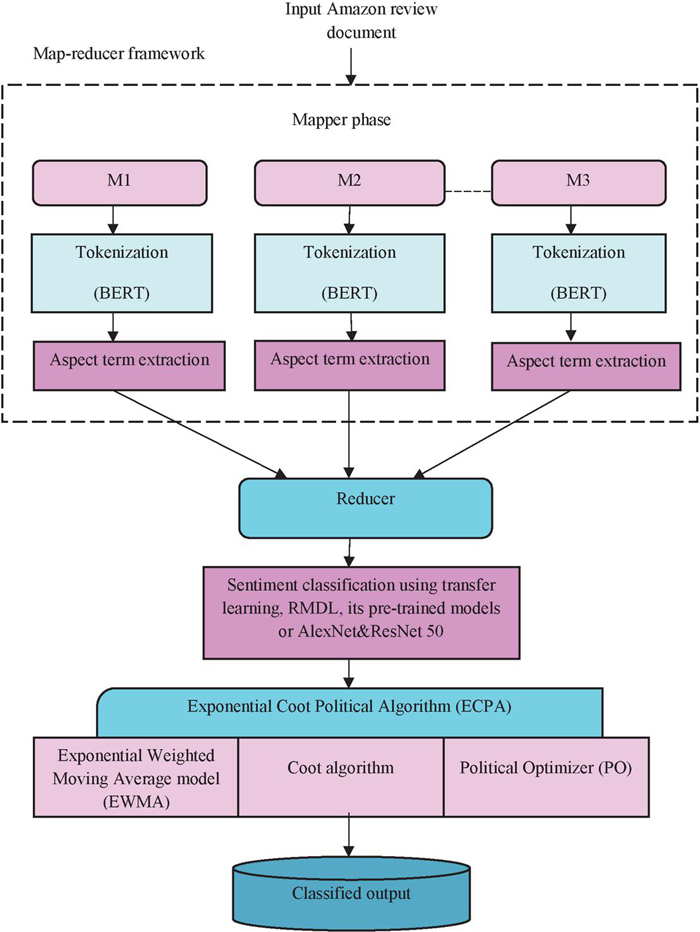
Figure 1 Block diagram of the proposed ECPA_RMDL for sentiment classification.
3.1 Data Acquisition
In the data acquisition process, the review data is occupied from the dataset [25]. Let us deliberate database with count of review data from Amazon for sentiment classification as an input, which is articulated as,
| (1) |
wherein, indicates Amazon input review data, represents the th data in the total number of review data, and is total data in training database .
3.2 Mapper Phase
The MapReduce programming paradigm, which is used in the processing and production of data collections, was anticipated by Google in 2004. Many challenges are dealt with by this system, including data dissemination, machine-to-machine communication, job scheduling, fault tolerance, and others. Hadoop MapReduce [26] is a programming paradigm and software framework for creating applications that process data in parallel on huge clusters of computing nodes in a fast and efficient manner. The Hadoop environment is used to construct programmes using the data processing programming model known as MapReduce. Hadoop MapReduce was integrated with a support vector machine (SVM) to create a data management methodology. It is also extremely flexible and increases classifying accuracy.
3.2.1 BERT tokenization
Tokenization is the process of dividing up a text into tokens. To tokenize the review data, Bert tokenization is used. In this case, data is submitted to the BERT tokenizer [27], which is the first fine tuning-based representation model to achieve state-of-the-art performance on a wide range of sentence-level and token-level activities. The input identification can absolutely depict a single statement or a couple of sentences (such as question, answer) in a single token sequential manner because BERT performs a wide range of downstream tasks. Each sequence’s principal token is generally a specific classification token (CLS). The pair of sentences are reduced into a brief segment for the classification task’s cumulative sequence description, the last hidden state connected to this token. There are two ways to distinguish the sentences. A singular token (SEP) is used to first identify them. Then, for each token, add a dominated introduction showing whether denouncing 1 or sentence 2 is associated. The input implanting is regarded as special CLS token’s final hidden vector in this scenario. Adding an appropriate token, section, and position semantic similarity produces output depiction for a particular token indicated as .
3.2.2 Aspect term extraction (ATE)
The ATE task analyses tweets or comments to identify features. The ATE job regulates whether or not token is associated with any aspect. Tokenized information ATE can learn about aspect properties and extract them from text immediately, saving labour and time [28]. The ATE consists of the following steps:
Step 1: Assessment of BERT-SPC
A BERT-based sentiment polarity classifier (BERT-SPC) technique was suggested to improve the aspect polarity classifier (APC) task performance. BERT-input SPC’s sequence is “[CLS]” + sequence + “[SEP]” + aspect + “[SEP]”.
Step 2: Intention of BERT
It is essential to fine-tune the learning process for pre-trained BERT. Both BERT-shared layers, which are regarded as embedded layers, are independently tuned using the multi-task learning joint loss function. The local and global output contexts are as follows:
| (2) | ||
| (3) |
Here, and are tokenized inputs of local and global features, the comparable BERT-shared layer buried in local and global context characteristics is represented by and , and and are tokenized outputs of the local and global output feature.
Step 3: Aspect polarity classifier (APC)
An APC head-pooled learning cascaded contextual features. The hidden layer is separated through head-pooling in the main badge of the training set, and the SoftMax capability is used to assess the opinions extremity.
| (4) | ||
| (5) |
wherein, denotes the number of sentiment classes, represents the global as well as framework features, and indicates the polarity originated by the APC.
Step 4: Aspect term extractor (ATE)
ATE basically accomplishes token-level categorization for each token, providing those features are in the proper place of the token . In terms of the aspect polarity classifier, the token category is represented as,
| (6) |
Here, the number of category tokens is represented as , the token group assumed by the APC is indicated as , and the output originating from ATE is signified as .
3.3 Reducer Phase
The mapper phase selects the output of ATE of , which is then exposed to the reducer phase, where the process of sentiment classification calculation is done using the developed ECPA_RMDL. A reduce function is additionally provided by the user, which deals with the initial key pairs and the value set relevant to the transitional key value. The reducer phase includes a number of reducers that use reduce functions to complete the jobs. Using the suggested ECPA_RMDL technique, sentiment classification is done during the reducer phase.
3.3.1 Sentiment classification analysis
In sentiment classification analysis, three inputs are taken. The first input and third input are forwarded to training of AlexNet [20] and ResNet 50 [20], respectively which are subjected to the fetch architecture. Both outputs are transferred to training of RMDL [21]. On the other hand, the second input is directly fed to training of RMDL. Finally, training of RMDL is transferred to the classified output. The AlexNet [20] architecture uses ReLU as a nonlinear activation function for improvising the convergence rate and alleviating the vanishing gradient issue. The AlexNet used to solve the image categorization issue is one that is based on CNN. It was initially employed to categorize dogs and cats. Convolution layers are the top layer in this case, and normalisation layers and pooling layers are next. Also, the formation of the SoftMax layer comes after the formation of the completely linked layer. This SoftMax layer normalizes the input received from the previous fully linked layer. ResNet [20] solves the problem of vanishing input or gradient until it reaches the end of the network. Unlike AlexNet and Google Net, ResNet takes advantage of residual influences. Figure 2 shows the structure of the sentiment classification model.
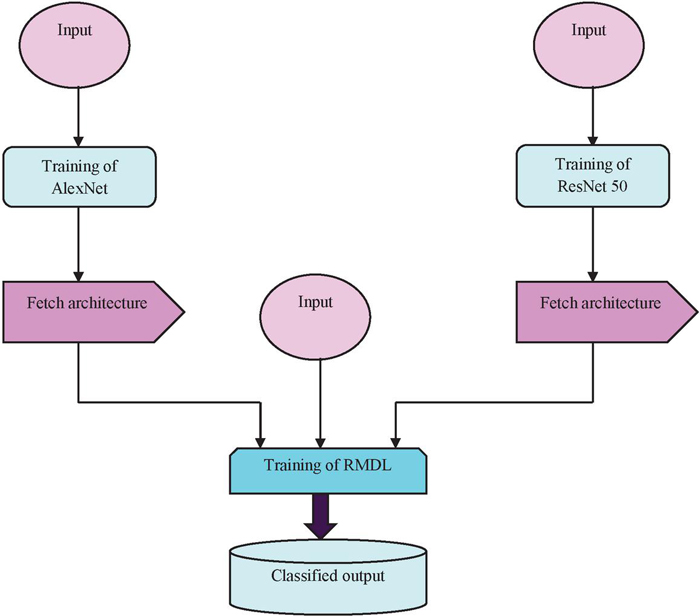
Figure 2 Block diagram of the sentiment classification.
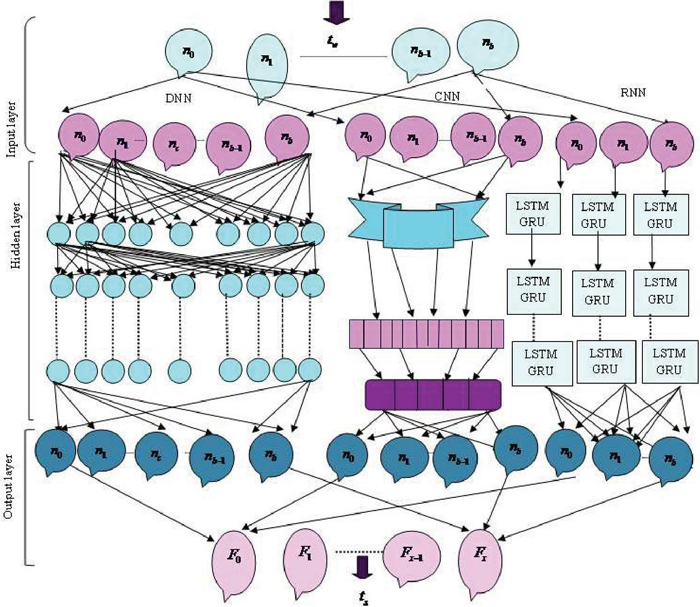
Figure 3 Architecture of RMDL.
Sentiment classification using RMDL
In the sentiment analysis procedure, the RMDL worked admirably. It is a novel ensemble, DL method for classification that focuses on figuring out the best DL structure and improving resilience and accuracy through DL structure.
Architecture of RMDL
RMDL [21] is a high-performance model that includes key deep learning techniques such as deep neural networks (DNNs), recurrent neural networks (RNNs), and a convolutional neural network (CNN) model. Additionally, the RMDL architecture is depicted in Figure 3, in which the data serve as the RMDL’s input for further processing.
(a) DNN framework: The learning framework is generated at random, whereas the DNN framework has numerous classifications. The total number of distinct layers and associated nodes is selected at random. An activation function that is activated by a typical back-propagation method is utilized in this strategy. Moreover, a summarization function creates the SoftMax function in the output layer, which is denoted as,
| (7) | ||
| (8) |
Here, indicates output, and represents the input state.
(b) RNN framework: This model adds weights to numerous data points. Consequently, it works well for classifying sequential data, strings, and text. In order to carry out an efficient semantic analysis in this scenario, past node information is measured. In addition, the general assertion is as follows:
| (9) | ||
| (10) |
wherein, the element wise operator is indicated as , represents a state of time , signifies the input state of , the frequent weight matrix is indicated as , the weight input is represented as , and is the bias vectors.
Long short-term memory (LSTM): LSTM architecture belongs to RNN classification, which totally maintains long-term significance. It addresses difficulties related to disappearing gradients. The LSTM is a chain-like structure that uses a variety of entryways to store vast amounts of survey data. Besides, LSTM’s ceaseless development is portrayed as,
| (11) | ||
| (12) | ||
| (13) | ||
| (14) | ||
| (15) | ||
| (16) |
Here, the input state is represented as , is the memory cell value, indicates the forget state instigation and and signifies output state.
Gated recurrent unit (GRU): The RNN gating approach in the GRU framework is two gates. In the meantime, there is no internal storage in the GRU, and the phases that are completed in GRU cells are referred to as,
| (17) |
Here, input vector is indicated as , the apprise state vector of is represented as , the difference parameters are signified by , and , and the activation parameter is .
| (18) | |
| (19) |
From the above equation, the reset gate vector is represented as , the output vector is denoted as and is the limitation imposed by hyperbolic tangent.
(c) CNN framework: CNN is a kind of DL plot that is utilized for text summing up positions and is the last part of RMDL. In addition, the convolution layers function as element maps, providing variety in the information channels. CNN is a type of DL scheme that is used for text summarising jobs and is a last portion of RMDL. Furthermore, convolution layers serve as feature maps, providing variety in the input filters. Pooling was used by the CNN to reduce the amount of output sent from one layer to another in order to simplify computing. Diverse pooling strategies are still utilized to reduce outputs while keeping a crucial feature. The most famous pooling methodology is max pooling, which picks the thing in the pooling window. In a CNN, the last layer is directly connected, and maps inside a column are compressed to fulfil the final layer with the combined output of layered highlighted maps. The mechanisms with the most votes are used to determine the final summarising result after RMDL architecture has been modified. Finally, output of RMDL is signified as . Figure 3 displays architecture of RMDL.
3.3.2 Proposed ExpCootPA_TL MR framework for sentiment analysis
This section describes the developed ExpCootPA_TL MR framework, which is designed by the incorporation of the exponential weighted moving average model (EWMA) [22], the coot algorithm [23], and the political optimizer (PA) [24]. Here, the EWMA scheme was introduced by Robert [31, 32]. Small changes in the process target value could be detected using this method. The EWMA is utilized to regulate factors by rotting impressive loads, and it provides a superior balance between precision and complexity in resolving improvement challenges. The recursive method of solution control is used, which means that the previous solution is used to solve the current one. In addition, the coot is a small waterfowl that moves in a swarm in search of food and is a member of the railing family Rallidae. To get the best answer, one must consider the coot’s movement. With the EWMA included, the coot is better able to explore the world for the best solution and is more likely to arrive at a local solution by convergence. Additionally, politics itself is an optimization process from two angles: each person works hard to win the election, and each party works hard to get as many seats in parliament as possible in order to form a government. Politics is a fantastic source of inspiration for optimization algorithms since people (such as party members) may be viewed as candidate solutions and personal favourability can be viewed as the position of the candidate solution in the search space. Furthermore, a candidate solution’s position vector or design variables can be used to reproduce a number of performance-related parameters that characterize a political member’s goodwill. As a result, the EWMA, coot algorithm, and PO hybridization aids in expanding search space’s exploration to find best global solution.
Step 1: Initialization
The population of the coot is commenced as . Using the optimization, the solution to the corresponding problem cannot be found in a single iteration. Consequently, the quantity of cycles likewise should be instated and is shown as . Coots are positioned in the sight area randomly as in Equation (20),
| (20) |
where, the coot’s location insight area is designated as , the upper and lower boundaries of the sight area are specified as and correspondingly and signifies dimension . The notation for the boundary area of sight is represented as,
| (21) | ||
| (22) |
Step 2: Fitness function
The degree of similarity between the achieved solution and the planned solution is calculated and expressed as,
| (23) |
Here, the fitness of the proposed ExpCootPA_TL-MR framework is defined as , the targeted solution is designated as , the obtained solution is denoted as , and the total sample is illustrated as .
Step 3: Randomization
The following is an indication of where the coots in the sight area are positioned in relation to one another as they randomly move around to investigate additional areas of the search space:
| (24) |
where, describes where the coot is located within the field of view. The coot seeks a food source during the randomized search by moving around the viewing region and looking in all directions. Whenever it finds food, it updates its position.
Now, substitute on both sides,
During the randomization-based food search, which updates the solution iteratively via exponential weight decay, the coot has no chance of hitting the local solution because of the hybridization of EWMA. Additionally, better weightage is allocated to the new arrangement by considering the previous arrangement, which assists with upgrading the securing of the worldwide best arrangement. As a result, the EWMA, coot algorithm, and PO hybridization aids in expanding search space’s exploration to find the best global solution. From the political optimization algorithm the equation is,
Consider the second condition from Equation (3.3),
| (28) |
Here,
The equation becomes,
| (29) | ||
| (30) | ||
| (31) |
Substitute Equation (31) into Equation (3.3),
| (32) | ||
| (33) | ||
| (34) |
Here, indicates position of the solution at the th iteration, indicates the position of the solution at the th iteration, represents random number between (0,1), indicates position of solution using EWMA at the th iteration and represents the position of the solution using EWMA at the th iteration.
| (35) |
where, indicates the current iteration and signifies the maximum iteration.
| (36) |
From Equation (36), and represent the upper bound and lower bounds, and indicates the number of total variables.
Step 4: Chain movement
Equation (34) above is the newly developed equation for the PA’s position update in the sight area while investigating to identify the food.
The coot’s position in the current and previous iterations is averaged to use chain movement. It can also be assessed by measuring the distance vectors of two coots, with the second coot being half a distance vector behind the first. The chain development’s plan should be visible as,
| (37) |
Step 5: Following leader
The position is altered by the coot in the feature space in response to the leader’s movement. Here, each pioneer is dispensed with a record number and people from get-together follow the pioneer considering the document number of pioneers. The definition for recognizing a pioneer is tended to as,
| (38) |
Here, denotes the number of leaders in the swarm, means the estimation of index, and represents the conforming index number. After determining the index to follow the leader, the members do so based on the number on the index. Position updating is used and is expressed as,
| (39) |
The chosen leader is shown as , and the range for the random number is [0,1]. Here, the range for the random number is [1,1].
Step 6: Local search
The local search criterion makes use of the optimal solution acquiring the food. As a result, members of the groups also alter their positions in order to obtain food based on the leader in this scenario. Subsequently, the position updating is indicated as,
| (40) |
Here, the best position attained by the coot is designated as , the range [0,1] of random number and . The factor, is assessed as follows,
| (41) |
As a result, the food for the optimization solution is obtained in this stage, and the feasibility of the solution is evaluated to determine its correctness.
Step 7: Identifying the feasibility
The fitness is re-evaluated using Equation (23) to determine whether the solution is feasible.
Step 8: Termination
When the global best solution has been reached or is complete, the algorithm is said to have reached its conclusion. Algorithm 1 contains the ExpCootPA_TL-MR framework pseudocode.
Algorithm 1. Pseudo-code for ExpCootPA TL-MR Framework
Pseudo-code for ExpCootPA TL-MR Framework
1 Initialize population
2 Random criteria are used to choose leaders.
3 Evaluating the fitness
4 Estimate the Xbest
5 While (ρ < ρmax)
6 Evaluate ν and O
7 Using Equation (38) detect index leader
8 If (rand > 0.5)
9 Update position using Equation (39) depending on indexed leader
10 else
11 If (rand < 0.5, y := 1)
12 Update the coot’s chain movement-based position using Equation (37)
13 else
14 Equation (25) is used to update the position during the exploration phase
15 end
16 end
17 Equation (40) is used to update the position during the exploitation phase.
18 end
19 ρ = ρ + 1
20 stop
As a result, the proposed ExpCootPA_TL-MR Framework’s best solution is used to adjust the TL’s weight during the learning phase, reducing information loss and increasing the efficiency of the incremental sentiment analysis.
4 Results and Discussion
The ECPA_RMDL model performs sentiment analysis of Amazon reviews better than other models. It relates to the performance indicators Recall, f-measure, and precision. The following sections include a discussion of methodology comparison, the experiment’s setup, a description of the data collection, analysis of performance metrics, and the results of the experiment.
4.1 Experimental Setup
The proposed ECPA_RMDL is executed as a Python tool for sentiment categorization.
4.2 Dataset Description
The data collection [25] consists of excellent foods from Amazon reviews and spans more than 10 years, with 500,000 reviews up to October 2012. There are available user reviews, product reviews, and plain text reviews. Moreover, all Amazon categories’ reviews are included. The review file has a size of 300.9 MB and is called reviews.csv.
4.3 Evaluation of Metrics
The performance measures outlined in the subsections below are used to assess the effectiveness of an ECPA_RMDL algorithm for sentiment classification.
4.3.1 Recall
Recall is defined as amount of correctly classified groups, which may be expressed as follows:
| (42) |
wherein, is designated as the true positive and signifies the false negative.
4.3.2 Precision
Precision is the degree to which two or more calibrations for sentiment categorization are identical to one another. It can be stated this way:
| (43) |
where, signifies as the false positive.
4.3.3 F-measure
Recall and precision are combined into a single score by the f-measure. The f-measure expression is given below:
| (44) |
Here, indicates precision, and represents recall.
4.4 Performance Analysis
This section analyses performance measurements by training data percentage change for the proposed ExpCootPA_TL-MR framework’s proposed framework for sentiment categorization.
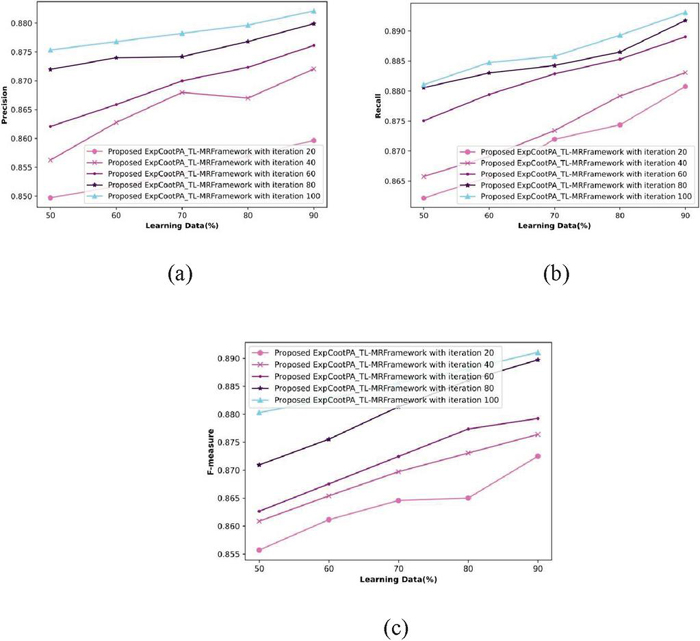
Figure 4 Analysis of ECPA_RMDL in terms of precision, recall, and f-measure.
4.4.1 Analysis based on percentage of learning data
By changing the iterations from 20% to 100%, Figure 4 illustrates an evaluation of the suggested ExpCootPA_ TL-MR framework. Figure 4(a) shows how learning data are modified over multiple rounds to evaluate performance in terms of precision. A performance assessment of precision for the proposed ExpCootPA_ TL-MR framework for iteration 20 is 86.3%, 40 is 87.2%, 60 is 87.6%, 80 is 88%, and 100 is 88.2%, when considering learning data as 90%. Figure 4(b) shows an evaluation of recall performance using training data change with various iterations. With the suggested ExpCootPA_ TL-MR framework iterations 20, 40, 60, 80, and 100, the performance estimation of recall is 88.1%, 88.3%, 88.9%, 89.2%, and 89.3% when the learning data is 90%. Figure 4(c) illustrates performance evaluation with regard to the f-measure by varying the learning data via various iterations. The proposed ExpCootPA_ TL-MR framework’s f-measure for iterations 20, 40, 60, 80, and 100 is 87.3%, 87.6%, 87.9%, 89%, and 89.1% when learning data is 90%.
4.5 Comparative Techniques
The effectiveness of the proposed ECPA_RMDL technique is tested against existing techniques such as BiERU [8], ABCDM [10], CBSO-SVNN [2], AVSMO_SqueezeNet, ExpCoot_DCNN, and the proposed ExpCootPA_ TL-MR framework.
4.6 Comparative Analysis
In this section, performance metrics from the ECPA_TL-MR framework are compared using the k-fold value and changes in the percentage of learning data.
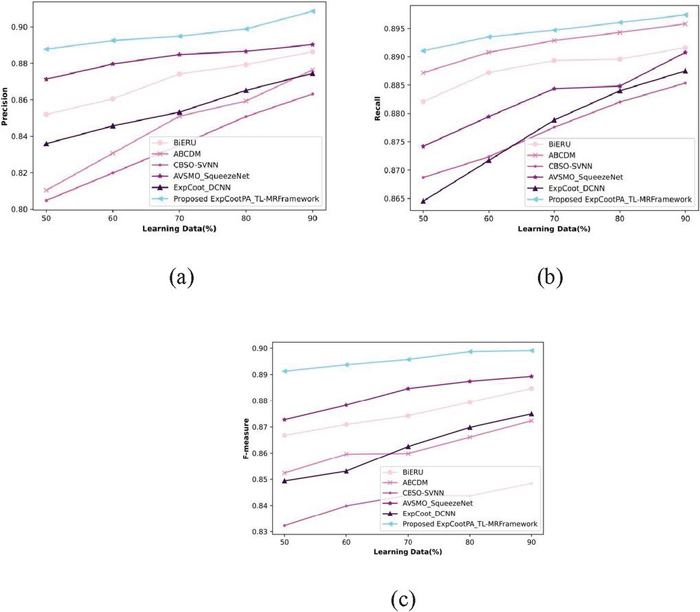
Figure 5 Investigation based on learning data in terms of (a) precision, (b) recall, and (c) f-measure.
4.6.1 Analysis based on learning data
Figure 5 compares the estimation of the ExpCootPA TL-MR framework when performance metrics are taken into account and learning data is changed from 50% to 90%. Figure 5(a) illustrates an estimation of the precision of the ExpCootPA_TL-MR framework. In comparison, the precision attained by the BiERU, ABCDM, CBSO-SVNN, AVSMO SqueezeNet, and ExpCoot DCNN methods for 90% of the training data was 88.6%, 87.6%, 86.3%, 89%, and 87.5%, respectively. An analysis of the suggested ExpCootPA_TL-MR framework’s recall is shown in Figure 5(b). BiERU, ABCDM, CBSO-SVNN, AVSMO SqueezeNet, and ExpCoot DCNN each obtained 89.2%, 89.6%, 88.5%, 89.1%, and 88.8% recall for 90% learning data, but recall gained by the ExpCootPA-MR framework is 89.7%. Figure 5(c) shows how the suggested ExpCootPA TL-MR framework is evaluated in relation to the f-measure. For 90% of the training data, the proposed ExpCootPA TL-MR framework achieved an f-measure of 89.9% while BiERU, ABCDM, CBSO-SVNN, AVSMO SqueezeNet, and ExpCoot DCNN gained 88.5%, 87.2%, 84.8%, 88.9%, and 87.5%, respectively.
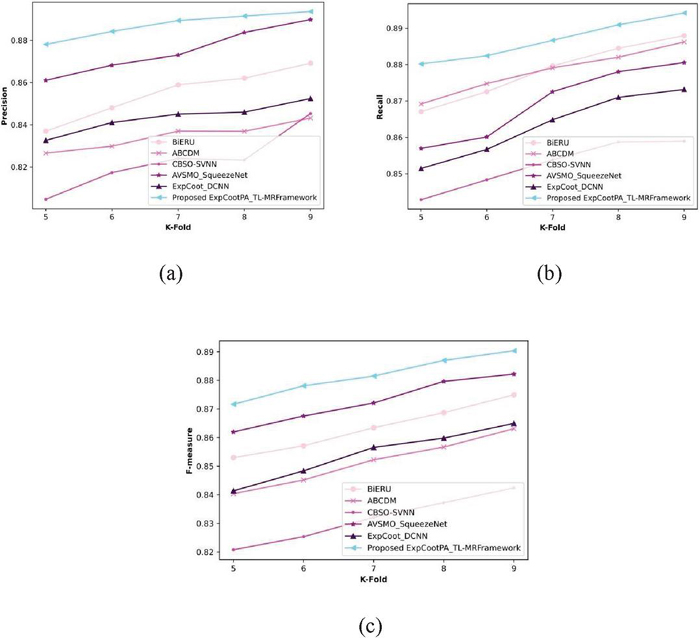
Figure 6 Analysis based on k-fold values in terms of precision, recall, and f-measure.
4.6.2 Analysis based on the k-fold value
A comparison of the proposed ExpCootPA TL-MR framework’s performance metrics is displayed in Figure 6 by changing value of the k-fold from 5 to 9. Figure 6(a) depicts a precision assessment of the proposed ExpCootPA_TL-MR framework. When the k-fold is 9, the ExpCootPA TL-MR framework achieves a precision of 89.4%, whereas BiERU, ABCDM, CBSO-SVNN, AVSMO SqueezeNet, and ExpCoot DCNN reach 86.9%, 84.3%, 84.5%, 89%, and 85.2%, respectively. Figure 6(b) displays an estimation of the ExpCootPA_TL-MR framework with regard to recall. For a k-fold value of 9, recall achieved by the ExpCootPA_TL-MR framework is 89.4%, while that of the BiERU, ABCDM, CBSO-SVNN, AVSMO_SqueezeNet, and ExpCoot_DCNN is 88.8%, 88.6%, 85.9%, 88.1%, and 87.3%. The suggested ExpCootPA TL-MR framework’s estimation of the f-measure is exposed in Figure 6(c). While other methods like BiERU, ABCDM, CBSO-SVNN, AVSMO SqueezeNet, and ExpCoot DCNN obtained 87.5%, 86.3%, 84.2%, 88.2%, and 86.5%, the f-measure attained by the suggested ExpCootPA TL-MR framework is 89% when the k-fold value is 9. Additionally, the proposed ExpCootPA_TL-MR framework performance improvement regarding precision for the k-fold value is 9, when for other methods, like BiERU it is 2.80%, for ABCDM it is 5.70%, for CBSO-SVNN it is 5.48%, for AVSMO_SqueezeNet it is 0.45% and for ExpCoot_DCNN it is 4.70%. When the k-fold is 9, the suggested ExpCootPA TL-MR framework outperforms existing approaches like BiERU, ABCDM, CBSO-SVNN, AVSMO_SqueezeNet, and ExpCoot_DCNN in terms of recall by 0.67%, 0.67%, 0.89%, 3.91%, and 1.45%, respectively. For the k-fold value of 9, performance enhancement of the developed ExpCootPA TL-MR framework regarding the f-measure when compared with other methods, such as BiERU is 1.69%, ABCDM 3.03%, CBSO-SVNN 5.39%, AVSMO SqueezeNet 0.90%, and ExpCoot DCNN 2.81%.
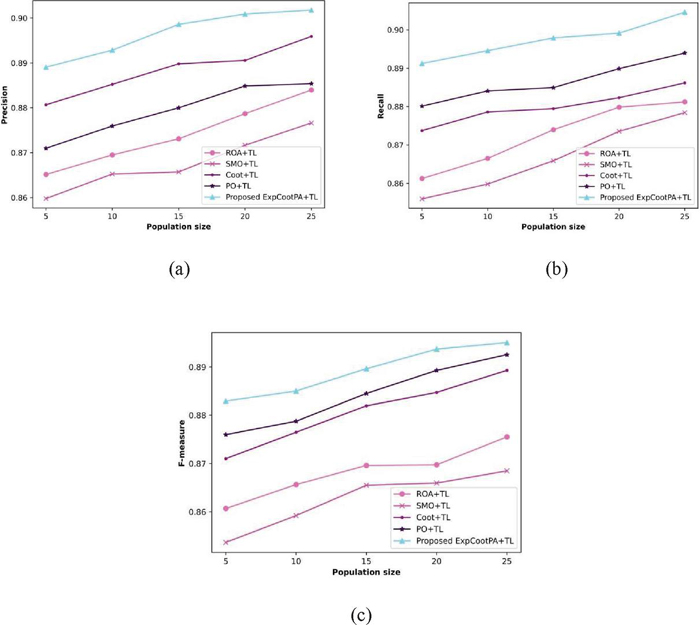
Figure 7 A methodological investigation of the proposed algorithm in terms of precision, recall, and f-measure.
4.7 Algorithmic Analysis
Remora Optimization Algorithm Transfer+Learning (ROA+TL) [29], Spider Monkey Optimization+Transfer Learning (SMO+TL) [30], Coot+Transfer learning (COOT+TL) [23], Political Optimizer+Transfer Learning (PO+TL) [24], and the proposed ExpCootPA+TL are the various algorithms that were taken into consideration for the evaluation. By varying population sizes from 5 to 25, an algorithmic evaluation of the performance metrics is also carried out.
Figure 7 illustrates an algorithmic study of a suggested algorithm with relation to performance indicators by altering population sizes. Figure 7(a) reveala an estimation technique that uses precision. In comparison, the precision obtained by ROA+TL, SMO+TL, Coot+TL, PO+TL and ExpCootPA_TL for a population size of 25 is 85.5%, 87.7%, 89.6%, 88.5% and 90.2%, respectively. The performance enhancement of the established ExpCootPA_TL with regard to precision while compared with other algorithms like ROA+TL is 5.21%, SMO+TL is 2.77%, Coot+TL is 0.67% and PO+TL is 1.88%. Figure 7(b) shows a recall-based estimation in action. While the population size is 25, recall attained by ExpCootPA_TL is 90.5% whereas other algorithms namely, ROA+TL, SMO+TL, Coot+TL, and PO+TL acquired 88.1%, 87.8%, 88.6%, and 89.4%. When compared to existing algorithms, including ROA+TL, SMO+TL, Coot+TL, and PO+TL, the performance improvement of the suggested ExpCootPA_TL with respect to recall is 2.65%, 2.98%, 2.10%, and 1.22%, correspondingly. Figure 7(c) illustrates an evaluation using the f-measure. The f-measure attained by ExpCootPA_TL is 89.5% whereas ROA+TL, SMO+TL, Coot+TL, and PO+TL attained 87.6%, 86.8%, 88.9% and 89.3%, for population size 25. When compared to other algorithms like ROA+TL, SMO+TL, Coot+TL, and PO+TL, the suggested ExpCootPA_TL has an f-measure performance improvement of 2.12%, 3.02%, 0.67%, and 0.22%, respectively. When compared to other algorithms, the proposed algorithm therefore demonstrated maximum effectiveness.
4.8 Comparative Discussion
Table 1 provides an explanation of a similar topic of the ExpCootPA_TL-MR framework. This means that the suggested ExpCootPA_TL-MR framework has, while taking into account a learning data 90%, attained maximum precision, recall, and f-measure of 90.9%, 89.7%, and 89.9%.
Table 1 Comparative discussion
| Proposed | |||||||
| Metrics/ | CBSO- | AVSMO_ | ExpCoot_ | ExpCootPA_TL-MR | |||
| Methods | BiERU | ABCDM | SVNN | SqueezeNet | DCNN | Framework | |
| Learning | Precision (%) | 88.6% | 87.6% | 86.3% | 89% | 87.5% | 90.9% |
| data 90 | Recall (%) | 89.2% | 89.6% | 88.5% | 89.1% | 88.8% | 89.7% |
| f-measure (%) | 88.5% | 87.2% | 84.8% | 88.9% | 87.5% | 89.9% | |
| K-fold | Precision (%) | 86.9% | 84.3% | 84.5% | 89% | 85.2% | 89.4% |
| value 9 | Recall (%) | 88.8% | 88.6% | 85.9% | 88.1% | 87.3% | 89.4% |
| f-measure (%) | 87.5% | 86.3% | 84.2% | 88.2% | 86.5% | 89% |
5 Conclusion
A core task in sentiment analysis is sentiment categorization, and it is crucial to understand user feelings based on their remarks in social media or product evaluations. Due to difficult words, refused words, and other factors, sentiment categorization presents a number of challenging issues. In this work, incremental sentiment analysis was introduced using a hybrid optimization-based deep learning technique. For incremental sentiment analysis, the ExpCootPA_TL-MR framework is used in this paper. The proposed ExpCootPA is used to change the weights of the TL_MR-Framework. In this case, the MapReduce paradigm is used to extract the review document from a dataset. MapReduce is a software framework and programming model that consists of two phases, mapper and reducer, for analysing large amounts of data. Although sentiment analysis is carried out in the reducer stage using random multimodal deep learning (RMDL) with transfer learning and pre-trained models AlexNet and ResNet 50, BERT tokenization and aspect term extraction are done in the mapper stage. Additionally, ECPA is offered as an optimization algorithm for weight optimization in RMDL. On the other hand, the recently created ECPA is special since in addition to the PO, it also includes the EWMA and the coot algorithm. Additionally, the proposed ECPA_RMDL has acquired maximal values of 90.9% of precision, 89.7% of recall, and 89.9% of f-measure.
References
[1] M.K. Kurian, S. Vishnupriya, R. Ramesh, G. Divya, and D. Divya, “Big data sentiment analysis using Hadoop”, International Journal for Innovative Research in Science and Technology, vol. 1, no. 11, pp. 92–96, 2015.
[2] M. Poongothai, and M. Sangeetha, “Chronological-brain storm optimization-based support vector neural network for sentiment classification using map reduce framework”, Sādhanā, vol. 45, pp. 1–12, 2020.
[3] Z. Xiao, X. Li, L. Wang, Q. Yang, J. Du, and A.K. Sangaiah, “Using convolution control block for Chinese sentiment analysis”, Journal of Parallel and Distributed Computing, vol. 116, pp. 18–26, 2018.
[4] N. Jindal, and B. Liu, “Opinion spam and analysis”, In Proceedings of the 2008 international conference on web search and data mining, pp. 219–230, February, 2008.
[5] G. Zhang, C.H.R. Hsu, H. Lai, and X. Zheng, “Deep learning-based feature representation for automated skin histopathological image annotation”, Multimedia Tools and Applications, vol. 77, pp. 9849–9869, 2018.
[6] J. Guo, “Deep learning approach to text analysis for human emotion detection from big data”, Journal of Intelligent Systems, vol. 31, no. 1, pp. 113–126, 2022.
[7] Y. Ma, K.L. Nguyen, F.Z. Xing, and E. Cambria, “A survey on empathetic dialogue systems”, Information Fusion, vol. 64, pp. 50–70, 2020.
[8] W. Li, W. Shao, S. Ji, and E. Cambria, “BiERU: Bidirectional emotional recurrent unit for conversational sentiment analysis”, Neurocomputing, vol. 467, pp. 73–82, 2022.
[9] I. Chaturvedi, E. Ragusa, P. Gastaldo, R. Zunino, and E. Cambria, “Bayesian network based extreme learning machine for subjectivity detection”, Journal of The Franklin Institute, vol. 355, no. 4, pp. 1780–1797, 2018.
[10] M.E. Basiri, S. Nemati, M. Abdar, E. Cambria, and U.R. Acharya, “ABCDM: An attention-based bidirectional CNN-RNN deep model for sentiment analysis”, Future Generation Computer Systems, vol. 115, pp. 279–294, 2021.
[11] A. Gepperth, and B. Hammer, “Incremental learning algorithms and applications”, In European symposium on artificial neural networks (ESANN), 2016.
[12] Y. Goldberg, “A primer on neural network models for natural language processing”, Journal of Artificial Intelligence Research, vol. 57, pp. 345–420, 2016.
[13] L. Zhang, S. Wang, and B. Liu, “Deep learning for sentiment analysis: A survey”, Wiley Interdisciplinary Reviews: Data Mining and Knowledge Discovery, vol. 8, no. 4, p. e1253, 2018.
[14] Z. Hameed, and B. Garcia-Zapirain, “Sentiment classification using a single-layered BiLSTM model”, Ieee Access, vol. 8, pp. 73992–74001, 2020.
[15] T.H. Nguyen, and K. Shirai, “Phrasernn: Phrase recursive neural network for aspect-based sentiment analysis”, In Proceedings of the 2015 conference on empirical methods in natural language processing, pp. 2509–2514, September, 2015.
[16] B. Liang, H. Su, L. Gui, E. Cambria, and R. Xu, “Aspect-based sentiment analysis via affective knowledge enhanced graph convolutional networks”, Knowledge-Based Systems, vol. 235, pp. 107643, 2022.
[17] B. Liu, “Text sentiment analysis based on CBOW model and deep learning in big data environment”, Journal of ambient intelligence and humanized computing, vol. 11, pp. 451–458, 2020.
[18] A. Alsayat, “Improving sentiment analysis for social media applications using an ensemble deep learning language model”, Arabian Journal for Science and Engineering, vol. 47, no. 2, pp. 2499–2511, 2022.
[19] R.K. Thakur and M.V. Deshpande, “Kernel Optimized-Support Vector Machine and Mapreduce framework for sentiment classification of train reviews”, International Journal of Uncertainty, Fuzziness and Knowledge-Based Systems, vol. 27, no. 06, pp. 1025–1050, December 2019.
[20] I. Wahlang, P. Sharma, S. Sanyal, G. Saha, and A.K. Maji, “Deep learning techniques for classification of brain MRI”, International Journal of Intelligent Systems Technologies and Applications, vol. 19, no. 6, pp. 571–588, 2020.
[21] K. Kowsari, M. Heidarysafa, D.E. Brown, K.J. Meimandi, and L.E. Barnes, “Rmdl: Random multimodal deep learning for classification”, In Proceedings of the 2nd international conference on information system and data mining, pp. 19–28, April, 2018.
[22] M.S. Saccucci, R.W. Amin, and J.M. Lucas, “Exponentially weighted moving average control schemes with variable sampling intervals”, Communications in Statistics-simulation and Computation, vol. 21, no. 3, pp. 627–657, 1992.
[23] I. Naruei, and F. Keynia, “A new optimization method based on COOT bird natural life model”, Expert Systems with Applications, vol. 183, pp. 115352, 2021.
[24] Q. Askari, I. Younas, and M. Saeed, “Political Optimizer: A novel socio-inspired meta-heuristic for global optimization”, Knowledge-based systems, vol. 195, pp. 105709, 2020.
[25] Amazon Reviews for Sentiment Analysis dataset taken from, “https://www.kaggle.com/datasets/bittlingmayer/amazonreviews”, accessed on February, 2023.
[26] J. Khairnar, and M. Kinikar, “Sentiment analysis-based mining and summarizing using SVM-MapReduce”, International Journal of Computer Science and Network Security (IJCSNS), vol. 15, no. 5, pp. 85, 2015.
[27] J. Devlin, M.W. Chang, K. Lee, and K. Toutanova, “Bert: Pre-training of deep bidirectional transformers for language understanding”, arXiv preprint arXiv:1810.04805, 2018.
[28] H. Yang, B. Zeng, J. Yang, Y. Song, and R. Xu, “A multi-task learning model for chinese-oriented aspect polarity classification and aspect term extraction”, Neurocomputing, vol. 419, pp. 344–356, 2021.
[29] Jia, H., Peng, X. and Lang, C., “Remora optimization algorithm”, Expert Systems with Applications, vol. 185, pp. 115665, 2021.
[30] H. Sharma, G. Hazrati, and J.C. Bansal, “Spider monkey optimization algorithm”, Evolutionary and swarm intelligence algorithms, pp. 43–59, 2019.
[31] S. W. Roberts, “Control Chart Tests Based on Geometric Moving Averages,” Technometrics, Vol. 1, No. 3, pp. 239–250, 1959.
[32] S. W. Roberts, “A Comparison of Some Control Chart Procedures,” Technometrics, Vol. 8, No. 3, pp. 411–430, 1966.
Biographies

Konda Adilakshmi joined the Department of Computer Science and Engineering, GRIET, Hyderabad in 2010. She completed an M.Tech (Computer Science & Engineering) from St.Theresa Institute of Engineering and Technology, Vizayanagaram in the year 2012. Her area of interest includes: text mining, machine learning, data science and natural language processing. She has 9 years of teaching experience. She has published papers in international journals. She is an Oracle Certified Associate (OCA).

Malladi Srinivas is working as Professor in Computer Science and Engineering in KLU. He completed a Ph.D. from KLU, Vijayawada in 2018. He published various research articles in international conferences and Journals. His research interests are data mining, big data analytics, machine learning and software engineering.

Anuradha Kodali is working as Professor in Computer Science and Engineering in GRIET. She completed her Ph.D. from JNTU, Anantapur in 2011 and her Ph.D. in Mathematics from JNTU, Hyderabad in 2006. Previously, she studied for a Master of Technology in Computer Science from Birla Institute of Technology, Ranchi. Her research interests are data mining, big data analytics, machine learning and software engineering.

V. Srilakshmi is working as Associate Professor in the CSE Department at GRIET. She completed her Ph.D. in Computer Science and Engineering from JNTU College of Engineering, Anantapur. She completed her M.Tech (Computer Science & Engineering) from JNTU University, Hyderabad in the year 2011. Her research interest include text mining, machine learning, data science and natural language processing.
Journal of Web Engineering, Vol. 22_8, 1101–1132.
doi: 10.13052/jwe1540-9589.2282
© 2024 River Publishers