Generating Automated Layout Design using a Multi-population Genetic Algorithm
Arun Kumar1,*, Kamlesh Dutta2 and Abhishek Srivastava1
1Department of Computer Science and Engineering, Indian Institute of Technology, Indore, India
2Discipline of Computer Science and Engineering, National Institute of Technology, Hamirpur, India
E-mail: chauhan.arun.cse@gmail.com
*Corresponding Author
Received 30 January 2023; Accepted 28 February 2023; Publication 16 June 2023
Abstract
The problem of space layout planning, constrained by a number of functional and non-functional requirements, not only challenges architects in coming up with a good solution, but is more difficult to give an alternative. Genetic algorithms (GAs) have been found suitable for solving the problem of providing alternative solutions. However, GAs have been found to be susceptible to the problem of local maxima and plateau conditions. To overcome these problems, the multi-population genetic algorithm (MPGA) improves the diversity of the population, thereby improving the quality of the solution. Algorithms are employed to automatically generate layout designs in best-connected ways, either rectangular or square. The area of the floor plans is optimized to minimize the extra area in the layout. The layouts are divided into four groups and these groups are related to each other based on highest proximity. Layout designs have been simulated using GA and MPGA algorithms and MPGA has shown significant improvement in computation time as well as quality over alternative solutions. In addition, the algorithm also provides the architect with the facility to interactively modify the dimensions and adjacent criteria during the design phase. The system works on clouds and shows the result for inputs passed by an architect.
Keywords: AutoCAD, layout, layout planning, genetic algorithm (GA).
1 Introduction
Layout design is a time-consuming task for an architect as there are many constraints on the space and lengthy procedures to arrange the space in the final layout. To design a layout, an architect has to consider all the parameters such as connectivity, position and size of the layout members, and arranging the sizes of the different spaces in a visually pleasing manner, while ensuring that the combined area of all the layout components fits well within the total floor area. In other words, when designing the layout of spaces (e.g., kitchen, bedrooms, drawing room, etc), it is important to consider both the aesthetic appeal and the practical aspects such as to fit all spaces in the total available area (total layout area). The dimensions of each area or room should be chosen in a way that the total floor area is optimally utilized. This approach helps in creating a well-balanced and functional space that looks good and meets the practical requirements. For example, if we have n layout members, there can be n! (n factorial) possible floor plans and it is a very difficult task to choose some good solutions from the floor plans of a large space. Therefore, while we think this problem could be automated, the permutation of spaces and other requirements make it computationally intensive.
Layout planning deals with NP-complete (non-deterministic polynomial time) problems. Some topological and dimensional restrictions are imposed on the problem to make it implementable in reasonable time. Similar to [1], layout members are organized into groups using a multi-population genetic algorithm (MPGA). Layout members in a group are arranged based on their relatedness. In addition to arranging layout members into a group, MPGA focuses on the fitness value of individuals using a multi-population technique. The higher the fitness value, the more related layout members in the group. A weighted relationship matrix is used for a topological relationship [2, 3]. It establishes the relationship between the matrix layout members. Other constraints are dimensional constraints such as the width and length of layout members and the layout itself, with maximum and minimum ranges of the length and width of layout members. Maximum priority is given to the relation of spaces first, then priority to the area of the layout members. A genetic algorithm (GA) is an appropriate approach to solve such a deeply complex problem. A GA is a heuristic method used to explore a large search space [4–8] with optimal results.
The paper is organized as follows. Section 1 introduces the problem of layout member planning, and the role of topological and dimensional constraints. Section 2 presents a detailed review of related work on layout problems as reported by various researchers. Section 3 explains the MPGA algorithms. Section 4 discusses the results and analysis of the proposed approach. Section 5 discusses future directions and summarizes the present work.
2 Related Work
Architectural layout planning includes many areas such as building or house planning, workshop planning and VLSI circuit planning. For layout planning, several techniques are employed. Some of the earliest works on layout planning used graph theory to solve the problem. The author in [9] proposed an interactive programming approach using graph theory to solve architectural space layout problems. He suggested that if the program’s input contained incomplete definitions about layout, the output could be worse. Some authors applied a cell organization technique to layout design using graph theory [10]. A mathematical model based on the fuzzy inference system [11] is used for the spatial analysis of the architectural layout design. Layout designs with parallel blocks [12] use an orthogonal compartment placement (OCP) approach with the possibility of gaps. This approach is based on constraint satisfaction and topological algebra. To reduce the spacing or excess area between layout members, [13] implemented a technique, although the relationship between subspaces was not considered in the paper. The relationship between spaces can be presented either graphically [14–17] or using a relationship matrix [18].
Apart from graph theory, a genetic algorithm is also used for layout design. Layout of a multi-storey office department designed to speed up using a hybrid genetic algorithm [19] using local search integration. Bausys and Pankrasovaite [20] generated a layout using an improved genetic algorithm with a directional operator. A CAD plug-in was developed to assist an architect in designing using a generative algorithm [21] which is slightly different from a GA. Several authors (Rodrigues et al.) [22] came up with an advanced hybrid evolutionary computation technique to help floor planners iterate steps and create different possible floor designs. Several authors used genetic algorithms to solve architectural planning problems [23–28] but they gave hypothetical solutions.
GA is also used for the facility layout problem (FLP), not only for houses or building layout planning. One of the GA approaches, the island model genetic algorithm (IMGA) [29] was proposed to solve the FLP. The IMGA is used to maintain population diversity and to better resolve the problem in a few iterations. To solve the uneven region, the feature layout problem [30], proposed a biased random key genetic algorithm. This algorithm minimizes the sum of the weighted distances between the centroids of facilities and discovers the dimensions and locations of the facilities. To optimally organize temporary facilities at construction sites (minimize the transportation distance between site personnel and equipment), Kumar and Cheng [31] proposed an automated framework. This framework is implemented with a GA using an A* algorithm. A novel hybrid system for the unequal area facility layout problem using a GA [32] is presented. The system combines two different approaches that allow interaction between the architect and the algorithm. Komarudin and Wong [33] proposed an algorithm to solve the UA-FLP. The algorithm terminates when an implementation has the maximum number of iterations or the maximum number of iterations without any improvement in the solution.
A GA is not the only way to solve the FLP. Some researchers also solved the problems of FLP using other techniques. For example, Matai [34] solved the FLP using simulated annealing. Guan and Lin [35] proposed a hybrid algorithm based on ant colony optimization and a variable neighborhood search to solve the facility layout problem. To improve performance, Lee and Lee [36] used simulated annealing and a Taboo search to generate a shape-based block layout. GA has the ability to search a large space with optimal solutions. So, a GA is capable of solving more problems than in houses and FLP layout, such as VLSI circuit design. Designing a VLSI circuit is very similar to layout planning. To optimize the circuit area using genetic approaches with reduced computation time, an evolutionary approach [37] is proposed. Iterative prototype optimization with evolved improvements (POEMS) algorithm has been designed for VLSI floor planning [38]. POEMS uses a GA for a local search on each iteration and uses a non-slicing structure to maintain the rectangle. For the floor plan of an integrated circuit (IC), Jabri [39] used the rectangular dualization technique to generate a rectangular topology. The author also proposed an algorithm for converting a tree of bi-connected subgraphs into a block neighborhood graph.
All the approaches used so far for space layout planning are either hypothetical or slow in execution [40]. Layout planning is an NP-complete problem and cannot be solved in reasonable time [41]. To solve layout problems in a reasonable time with optimal results, we propose a rule-based system using MPGA. MPGA has significant advantages over a sequential GA with respect to fitness value and execution time. The comparison is validated in the experimental section. The proposed work considers topological and dimensional constraints such as the relationship, position and size of the layout members. The proposed system connects all layout members based on their adjacency relationships. Based on relationships, the members of the layout are first divided into groups. Furthermore, these groups are linked again based on their layout members.
3 The Proposed Multi-population Genetic Algorithm
A genetic algorithm is a powerful approach to explore a large space and generate optimal results. However, sometimes the genetic algorithm gets stuck at a local maxima or a local plateau. The reason for being stuck at a local maxima is the low diversity (individuals of the same fitness value) in a subset of the population p. To solve such problems and increase diversity, the MPGA uses the migration of individuals in a population. In addition, the MPGA gathers related layout members into a single group. This would be possible when the fitness value of an individual is maximized.
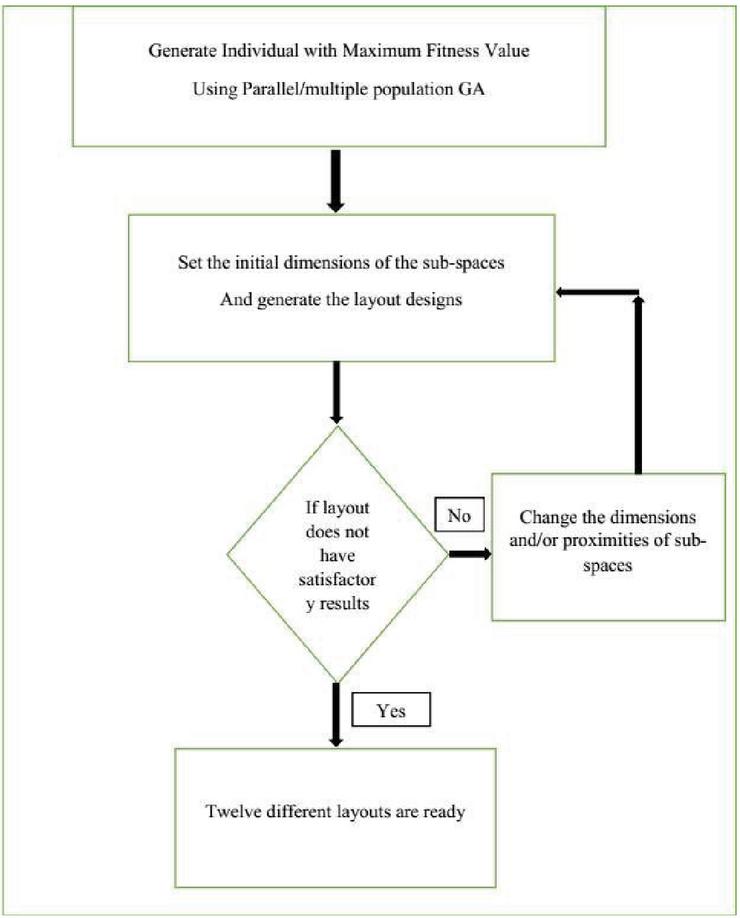
Figure 1 Proposed work flowchart.
The methodology of the present work is shown in Figure 1. First of all, highly fit individuals are prepared with the help of MPGA. Next, the dimensions of highly fit individuals and layout members are passed to the rule based system (RBS). The RBS prepares twelve optimal layouts from the three best individuals; however, the number of solutions are not bound to 12. If the layout does not meet the architect’s expectations, the layout can be changed by inputting the layout members and changing the dimensions.
3.1 Migration Technique
The property of the genetic algorithm to get stuck at a local optimum is overcome by using migration techniques [42]. In this topology (Figure 2), individuals are migrated into sub-populations (the population is divided into some groups and each group contains the same number of individuals, where a group is referred to as a sub-population. The individual with the highest fitness value in the sub-population replaces the worst individual in the sub-population . If the worst fitness value of individuals is greater than the best of then no replacement occurs. Any individual except the migrated individual may be migrated to any other sub-population. The purpose of migration is to remove individuals that have similar fitness values from a region of the population. Migration is shown using Equation (1).
| (1) |
where and are sub-populations; (select at most x individuals from the sub-population ) is the selection condition; m is the total number of persons to be migrated; n is the total number of sub-populations. Several experiments are conducted between sequential GA and MPGA, which validates the uses and advantages of the migration technique in the results and discussion section.
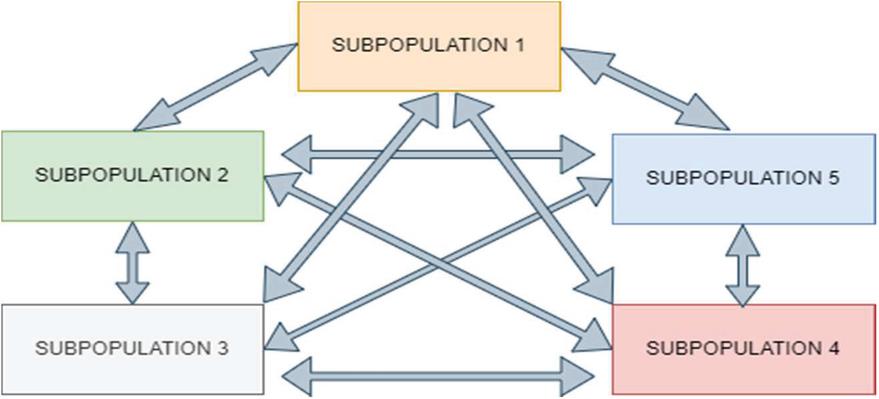
Figure 2 Unrestricted migration topology.
Algorithm 1 Multi-population genetic algorithm
1: New Population
2: n number of subpopulations
3: k maximum number of individuals to be selected for migration
4: K maximum iterations
5: Begin
6: generate initial population P.
7: divide P into subpopulations .
8: evaluate the of .
9: determine the best initial avg_fitness (average fitness).
10: for ( to )
11: for ( to )
12: for ( to )
13:
14: ;
15: end for
16: ;
17: end for
18: for ( to )
19: select parents list L using selection SUS.
20: for { to (length.L)}
21: Randomly select parent1 from L
22: Randomly select parent2 from L
23: parents list (parent1 parent2)
24: a DoCrossover (parents)
25: P.append(a)
26: Select random individual I from P
27: a DoMutation(I)
28: P.append(a)
29: end for
30: kk1;
31: end for
32: check for the terminating conditions;
33: jj1;
34: end for
35: select the final avg_fitness value of each P.
36: determine the top avg_fitness f among all the P.
37: select the individuals from f.
38: End.
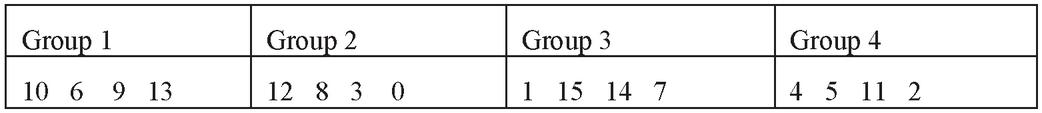
Figure 3 Individual structure.
Table 1 Mapping of layout members
| Layout Members | Room 0 | Bedroom | Latrine | Bath 1 | Kitchen | Dining Room | Lib | Study Room 1 | Study Room 2 | Bath 2 | Drawing | Room 11 | Room 12 | Room 13 | Room 14 | Room 15 |
| 0 | 1 | 2 | 3 | 4 | 5 | 6 | 7 | 8 | 9 | 10 | 11 | 12 | 13 | 14 | 15 |
3.2 Initial Population
Layout members are randomly generated into groups of individuals. For each individual, exactly four groups of layout members are generated. The advantages of this method are that the fitness value of some individuals will not be worst. So, each individual in a population has four groups and each group has four layout members. The integer encoding scheme is used to create an individual. The individual structure is shown in Figure 3. Each integer in the individual represents a layout member. The mapping of layout members with the integers is shown in the Table 1.
The purpose of the MPGA is to group all layout members that have great relationships to be connected to each other. For example, the library has a good relationship with the study rooms. The relationships of layout members are presented using the relationship matrix (Table 2). In the relationship matrix, 0 represents the lowest relationship between two layout members, where 10 represents the highest relationship between them to be placed together in a group.
Table 2 Relationship matrix of spaces
| Subspaces | Room 0 | Bedroom | Latrine | Bath 1 | Kitchen | Dining Room | Lib | Study Room 1 | Study Room 2 | Bath 2 | Drawing | Room 11 | Room 12 | Room 13 | Room 14 | Room 15 |
| Room 0 | 0 | 9 | 6 | 6 | 4 | 6 | 7 | 6 | 4 | 5 | 3 | 2 | 2 | 2 | 8 | 6 |
| Bedroom | 9 | 0 | 6 | 10 | 7 | 6 | 7 | 6 | 4 | 5 | 9 | 2 | 2 | 2 | 8 | 6 |
| Latrine | 6 | 6 | 0 | 8 | 3 | 4 | 2 | 5 | 4 | 9 | 3 | 6 | 6 | 4 | 4 | 6 |
| Bath1 | 6 | 10 | 8 | 0 | 6 | 8 | 6 | 9 | 4 | 4 | 3 | 4 | 4 | 4 | 4 | 6 |
| Kitchen | 4 | 7 | 6 | 6 | 0 | 10 | 5 | 5 | 2 | 2 | 8 | 2 | 2 | 2 | 4 | 2 |
| Dining Room | 6 | 6 | 4 | 8 | 10 | 0 | 6 | 5 | 5 | 2 | 9 | 5 | 2 | 2 | 4 | 2 |
| Library | 7 | 7 | 8 | 6 | 5 | 6 | 0 | 10 | 10 | 8 | 2 | 2 | 2 | 2 | 4 | 2 |
| Study Room1 | 6 | 6 | 9 | 9 | 5 | 7 | 10 | 0 | 6 | 6 | 4 | 4 | 4 | 4 | 4 | 6 |
| StudyRoom2 | 4 | 4 | 4 | 4 | 2 | 6 | 10 | 6 | 0 | 8 | 5 | 6 | 6 | 6 | 6 | 9 |
| Bath 2 | 5 | 5 | 9 | 4 | 2 | 2 | 8 | 6 | 8 | 0 | 8 | 4 | 4 | 4 | 6 | 4 |
| Drawing | 3 | 9 | 3 | 3 | 8 | 9 | 2 | 4 | 5 | 8 | 0 | 2 | 2 | 2 | 4 | 4 |
| Room 11 | 2 | 2 | 6 | 4 | 2 | 5 | 2 | 4 | 6 | 4 | 2 | 0 | 8 | 10 | 2 | 9 |
| Room 12 | 2 | 2 | 6 | 4 | 2 | 2 | 2 | 4 | 6 | 4 | 2 | 8 | 0 | 10 | 2 | 9 |
| Room 13 | 2 | 2 | 4 | 4 | 2 | 2 | 2 | 4 | 6 | 4 | 2 | 10 | 10 | 0 | 2 | 4 |
| Room 14 | 8 | 8 | 4 | 4 | 4 | 4 | 4 | 4 | 6 | 6 | 4 | 2 | 2 | 2 | 0 | 6 |
| Room 15 | 6 | 6 | 6 | 6 | 2 | 2 | 2 | 6 | 9 | 4 | 4 | 9 | 9 | 4 | 6 | 0 |
To evaluate the fitness of an individual, it is necessary to specify the relationship weights between two layout entities within a group. There are four layout members in a group, so there will be six combinations of layout members in a group. The overall fitness value of an individual is the sum of the fitness values of all groups. The fitness value is denoted by in Equation (2).
| (2) |
where and are the layout members of the group, is the number of layout members and G is the total number of groups. The selection operator is one of the essential operators of a genetic algorithm since the randomness of a population depends on the selection of individuals. In this work, stochastic universal selection (SUS) [43] is used, as it provides better randomness in the population than other selection operators [43].
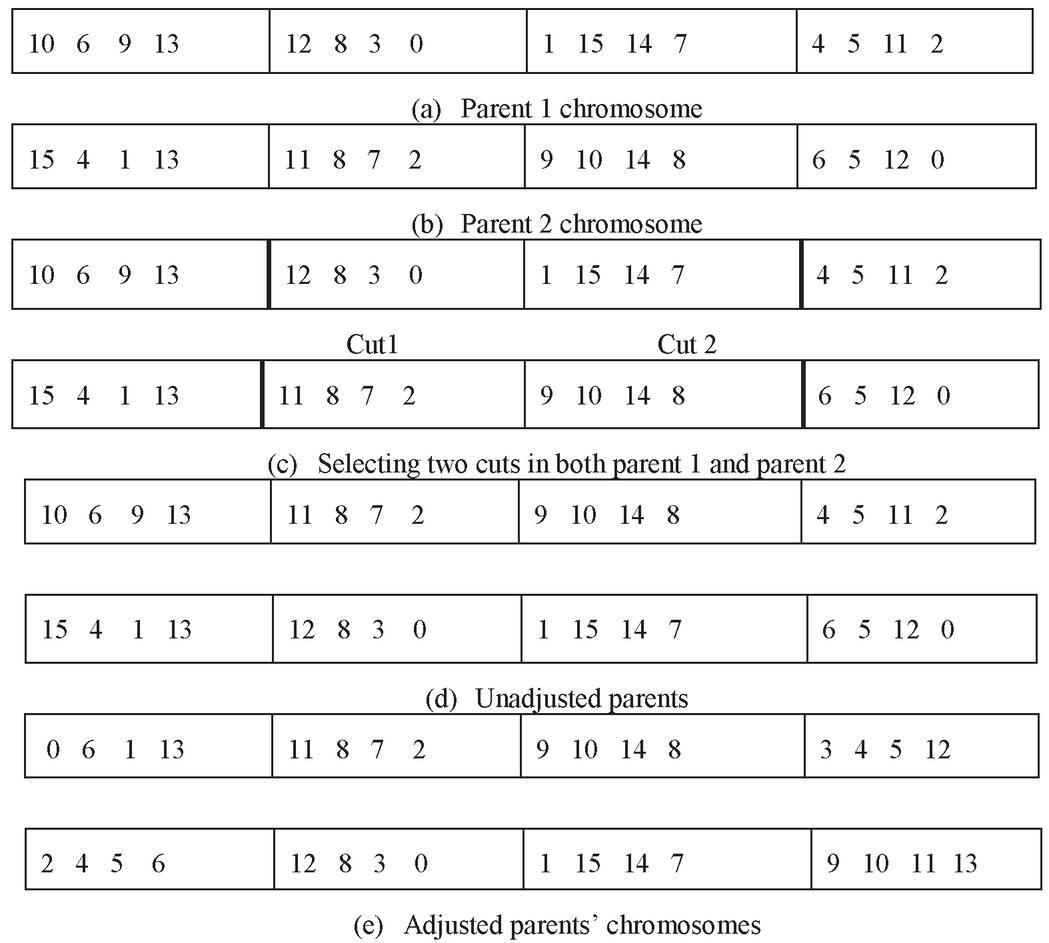
Figure 4 Order crossover operator.
3.3 Order Crossover and Mutation
A crossover is a mating technique typically used between two individuals. With the mating of individuals, new offspring are produced. Using crossover, the population is folded towards the convergence point. A number of evolving methods are used to accommodate certain conditions. A brief overview of the two types is as follows:
• One-point crossover: One-point crossover is used when the crossover point is selected with an individual where genes are swapped between parents and two offspring are produced (see Figure 4).
• Two-point crossover: Two points are selected for the parent. Then genes are exchanged between the two points to produce two offspring. The crossover operator removes exact duplications between two parents from the old population in the new offspring. This ensures that the new population that is being produced using the crossover operation can survive in the next iterations and also has the desired qualities of the parents.
In ordered crossover [44] two cut-points (Figure 4c) are chosen randomly in two randomly chosen parents (e.g., Figures 4a and 4b). The genes/groups that lie between these two cut points are directly copied from one parent to the other. The cut point in one individual (Figure 4c) is an interchangeable part with the other individual. Duplicate elements of the remaining genes are removed using a sliding motion (Figure 4e). Although the convergence process of ordered crossover is slow, it gives better results. The sliding motion places spaces in chromosomes using the relationship value of one space to another.
Mutation operators are used to increase more diversity in a population. Mutations are generally used to optimize diversity in populations and generate new adaptive solutions to avoid local optima. In this work, a mutation in an individual randomly selects two groups. Two layout members are selected at random from both the groups and the layout members are exchanged in both the groups.
4 Rule Based System Algorithm
The proposed system (RBS) is a rule-based programming system that efficiently places various spaces in a layout and generates various alternative designs of the layout. The technique takes the three fittest individuals from the MPGA as input. Other additional inputs are the dimensions (width and length) of all layout members. The algorithm below works:
1. The inputs to RBS are the space and dimensions of chromosomes that are produced by MPGA as four groups.
2. Then the designing algorithm randomly selects any group from the chromosome and starts placing its members in a rectangle. A group has a maximum of four layout members, so it randomly selects any member from the group and places it in the layout. In this manner the next member to be selected and placed in the rectangle is selected only if it has the highest proximity to the already placed layout member compared to the other remaining layout members in the group.
3. This process continues until all the members of the group are placed in the rectangle. Therefore, a group can be placed in a layout in four different ways or arrangements as there are four positions in a group. However, out of four different arrangements, only one arrangement is selected which has the minimum area among all the four possible arrangements. Step 2 will be repeated until all four groups are placed. In the end, there will be four rectangles from these four groups.
4. The other purpose of RBS is to keep all four arrangements/rectangles in the layout in the best possible way. So, first, a rectangle is randomly selected from the list of these four rectangles, and it is placed in the layout. The fourth step of RBS is to select only that rectangle from the list of remaining rectangles whose members are maximally close to the members of the rectangle already placed in the layout. This step is repeated until all the rectangles are placed in the layout.
5. In this fashion, four different layouts are generated, because the four rectangles can be arranged in four different ways. From three fittest individuals, a total of 12 different alternatives are generated in this work. However, number of solutions can be any value, as per architect/customer requirements.
5 Result and Discussion
The results are explained in two steps, Sections 5.1 and 5.2. In the first step the MPGA results discuss the fitness value and diversity of the population. In the second step, the results of the rule-based system are interpreted. The proposed work is implemented in AutoCAD using Auto LISP as a programming language. The algorithms are run on an Intel i3 processor with 4 GB of random-access memory (RAM).
5.1 Experiments on the Fitness Value using GA and MPGA
GA uses implicit parallelism to explore the search space of a problem. The implicit parallelism assumption is that the GA starts the search for the optimal solution from more than one point. However, sometimes it gets stuck in local optima due to individuals with similar fitness values. Therefore, to overcome this problem with the search line, MPGA performs well. It has also been noted that MPGA is useful for reducing computation time [45] because of its parallelism. For explaining the difference between GA and MPGA the following experiment is conducted on the population. There are two populations are generated of 150 and 250 individuals. The population size for the experiments is taken as 150 and 250 individuals. The population is taken on the basis of two parameters, one is time, and the other is sufficient randomness among individuals. If the population size is too large, it will impact the time to generate the solution. However, it can improve the randomness between individuals. Therefore, we take population sizes 150 and 250, as they generate better randomness and require less time to generate a solution.
The sequential GA is applied over both populations with the different mating sizes (10% to 50% of the population size). Mating size is taken to be 50% maximum because after this the results are almost same, i.e., there is almost no improvement in fitness value. Therefore, the maximum fitness value using sequential GA is 8.45 when the population size is 250 and 7.51 when the population size is 150 (Figure 5). If the population size increases, the fitness value also increases, because with size of population the randomness among the population increases. The best fitness value of GA is 8.45 when the population size is 250, as shown in Figure 5, and for the same population size, the fitness value of MPGA is 9.55.
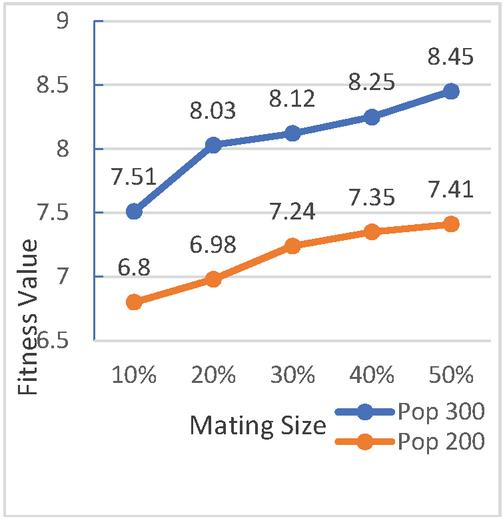
Figure 5 Fitness value when population sizes are 150 and 250 using GA.
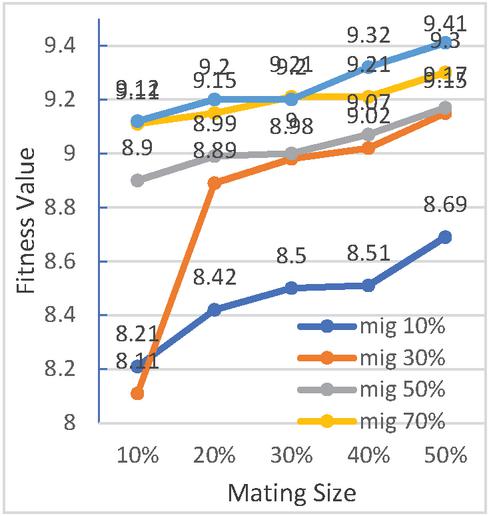
Figure 6 Fitness value when population size is 250 using MPGA.
The property of MPGA is that it divides the population into sub-populations and then uses the migration of individuals among them. Experiments for MPGA are explained in the following two cases. In these cases, the number of sub-populations is taken to be 5 and 10 respectively.
Case I
Figure 6 shows the results on the fitness value when the number of sub-populations is 10 and the population size is 250. Therefore, there are 25 individuals in each sub-population. Many experiments are carried out to find the best fitness value. When the mating rate (number of individuals selected to produce a new generation) is 10%, 20%, 30%, 40%, 50% of the population, different migration sizes (10%, 30%, 50%, 70% and so on) 90% is taken for each. So, these different migration frequencies are applied between the 10 sub-populations, and it is observed that fitness value increases with the increase in migration frequency. As shown in Figure 6 when migration frequency is 90% and mating size is 50%, the fitness value is 9.41 and it is 8.11 when both are least. Beyond these rates the population begins to lose their randomness, consequently convergence at early stages or erosion of the results.
Case II
In Figure 7, the result on fitness is shown when the population size is 250 and number of sub-populations is 5. In this case the fitness value tends to be high because as the number of sub-populations decrease, the number of individuals in each sub-population increases. As a result, the randomness among the population increases and it does not become homogenous in the initial state. Therefore, the best fitness value is 9.55, as shown in Figure 7, when both migration frequency and mating rate are 50%.
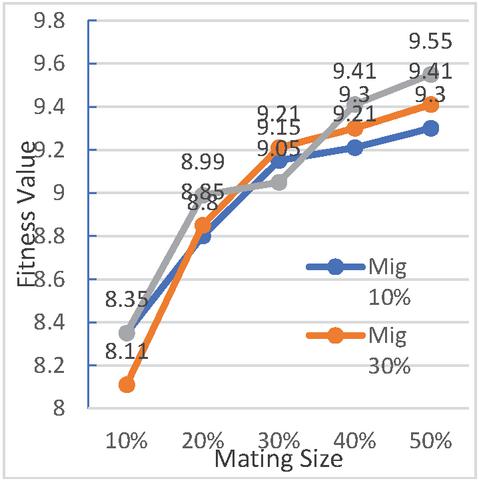
Figure 7 Fitness value when migration rate is 10%, 30% and 50%.
However, a migration frequency higher than 50% also produced the same fitness value (that is, no further increase in fitness value). So, here it can be seen that there are not many combinations left in the search space, i.e., this is the highest point of fitness value. Experiments performed over 10 sub-populations do not give a fitness value greater than 9.41 as the populations begin to lose their randomness, resulting in convergence at an early stage. Below 5 sub-populations results are also not good because all combinations could not be searched and even execution starts to become somewhat sequential.
Figure 8 shows the fitness values of sequential GAs. These experiments show that the GA gets stuck at some local minima that is 8.5 and no further improvement is observed, even after increasing the mating size. This plateau condition occurs when all nearby individuals are of similar fitness values, i.e., the randomness between them is almost zero. Therefore, MPGA produces good fitness value as it increases the diversity in the population [46].
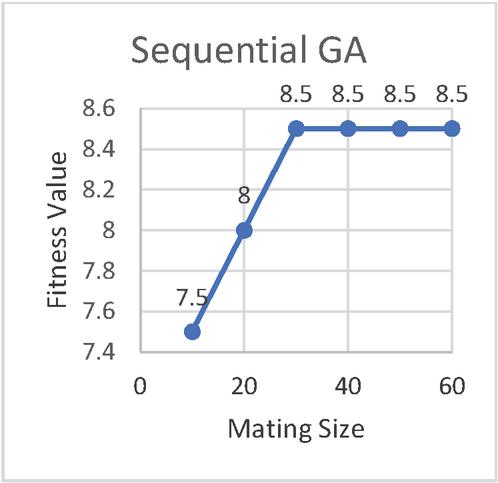
Figure 8 Sequential GA stuck at a plateau with fitness value 8.5.
5.2 Results and Analysis of the Rule-based System
The rule based system (RBS) arranges the spaces in the layout and provides an architect with a better solution. For the analysis of the proposed approach, we generated layouts for 4 and 16 layout spaces, which show the capabilities of RBS to layout the spaces in the best-connected way. The first experiment of the proposed approach is to create the layout of four spaces. A group of an individual is shown in Figure 9 with four layout spaces.

Figure 9 A group instance of an individual.
Any gene/group of the individual contains four layout members. Therefore, it can have only four arrangements. The arrangements of above gene/group using RBS, are shown in Figures 10–13. The members of a group are placed in a rectangle or square because if the diameter of the placed layout members is minimized then the extra spaces will also be minimized.
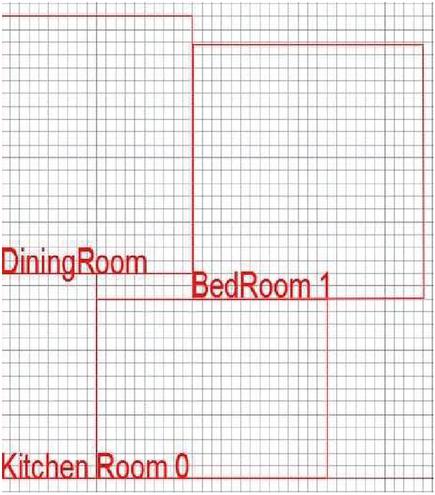
Figure 10 Arrangement when the Kitchen is placed first.
Table 3 Relationship matrix featuring Room 0, Bedroom 1, Kitchen and Dining Room
| Subspaces | Room 0 | BedRoom 1 | Kitchen | Dining |
| Room 0 | 0 | 9 | 4 | 6 |
| BedRoom 1 | 9 | 0 | 7 | 6 |
| Kitchen | 4 | 7 | 0 | 10 |
| Dining | 6 | 6 | 10 | 0 |
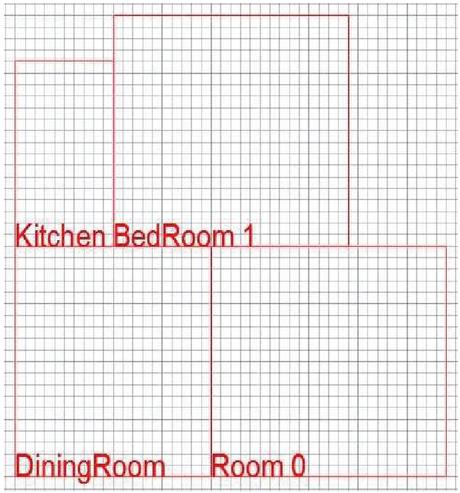
Figure 11 Arrangement when dining is placed first.
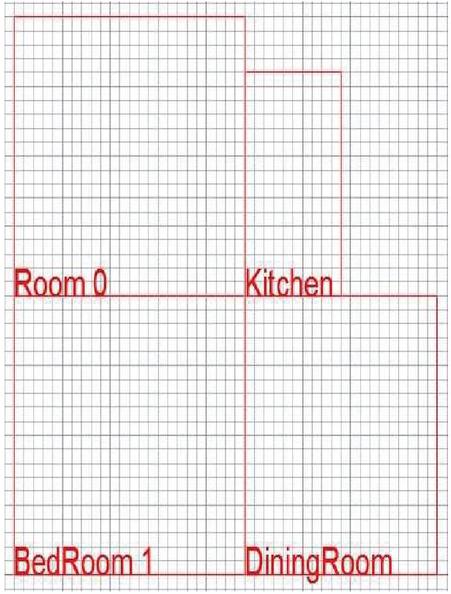
Figure 12 Arrangement when bedroom 1 is placed first.
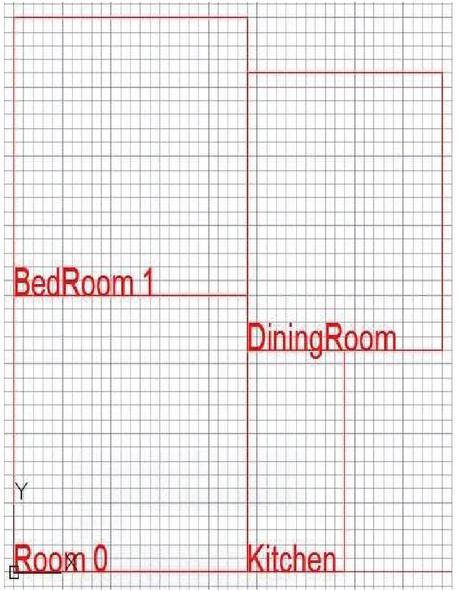
Figure 13 Arrangement when Room 0 is placed first.
Layout members are made adjacent to each other in a rectangle according to their proximity to each other. As shown in Figure 10, the kitchen is adjacent to the dining room as it has maximum proximity to the kitchen. With the dining room, the bedroom is connected and so on. Adjacencies in Table 3 are taken from Table 2 to show the spatial layout of Room 0, Bedroom 1, Kitchen and Dining Room (e.g. Kitchen is adjacent to Dining Room, Dining Room is adjacent to Bedroom and Bedroom is adjacent to Room 0, see Figure 10).
A layout that holds group members should have sufficient width and length to accommodate all of these spaces. At this stage, the area of the rectangle may exceed the area of the group members. However, as this RBS works, it takes only the rectangle out of the four in which the members of the group occupy the least area. The arrangement given in Figure 10 has the least area occupied by its members. The remaining three arrangements (Figures 11–13) are neglected by the proposed approach. Therefore, the extra spaces are minimized in this step. The dimensions of the rectangle shall be the total height of the spaces and the total width of the layout members.
It can be seen that the spaces in these layouts are of different sizes, which is also a part of the approach, i.e., if a space is not fitting in the layout, it automatically adjusts by decreasing either the height or the width, or both. However, there are some restrictions, which are imposed on the adjustment: it cannot decrease beyond a certain limit (user defined threshold on width and length). Working this way, the system now has four rectangles with minimum area which finally gives four other arrangements. In this research, 16 spaces are taken, and they are placed in the layout, the generated output by the system are given in Figures 14–17 using a single individual.

Figure 14 First layout of a given individual.
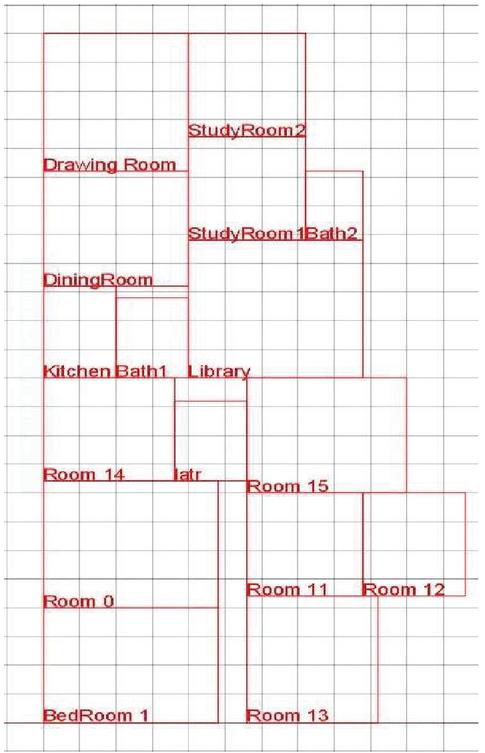
Figure 15 Second layout of a given individual.
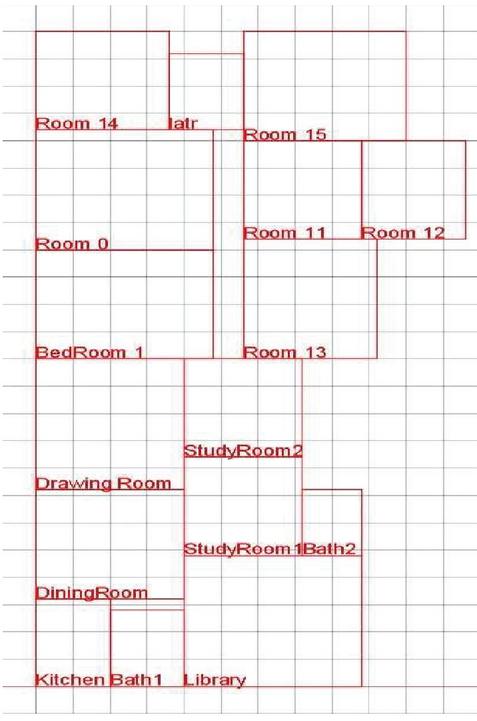
Figure 16 Third layout of given individual.

Figure 17 Forth layout of a given individual.
Table 4 Area and dimensions of the layout members
| Spaces | Area (Square Unit) | Width (Unit) | Height (Unit) |
| Room 0 | 132 | 12 | 11 |
| Bedroom | 120 | 12 | 10 |
| Latrine | 35 | 5 | 7 |
| Bath1 | 35 | 5 | 7 |
| Kitchen | 40 | 5 | 8 |
| Dining Room | 100 | 10 | 10 |
| Library | 144 | 12 | 12 |
| Study Room 1 | 72 | 8 | 9 |
| Study Room 2 | 72 | 8 | 9 |
| Bath 2 | 24 | 4 | 6 |
| Drawing | 120 | 10 | 12 |
| Room 11 | 72 | 8 | 9 |
| Room 12 | 63 | 7 | 9 |
| Room 13 | 99 | 9 | 11 |
| Room 14 | 81 | 9 | 9 |
| Room 15 | 110 | 11 | 10 |
In Figures 14–17 the layout members are mentioned with their names and where nothing is mentioned it is the unused area in the layout. Additional spaces can be used as passageways, storerooms or premises, etc. In this research a total of 12 options are provided to an architect using the top three chromosomes constructed by the MPGA.
The total area of a layout is equal to the sum of the areas of the layout members plus some extra space. The total layout area taken up is 1480 unit while the area of the layout members is around 1320 unit (Table 4) and for extra space 160 unit area is taken. Therefore, the results of the approach are very close to the total area of the layout. The Figures 14 and 17 arrangements have an area of about 1450 units while the Figures 15 and 16 arrangements have an area of about 1500 units.
6 Conclusion and Future Work
The proposed task generates twelve options for a layout in the best-connected way. The extra spaces are handled very efficiently, i.e., the total area is used for the areas of the given space. The generated layout can be adjusted by the architect by changing the dimensions and the closeness of the spaces, then the end result will be similar to a good layout. The rectangles are connected using the relationship matrix, i.e., only the spaces that are most related to each other will be connected. This means that the gap between relative spaces will be less compared to less related ones. The proposed method uses stochastic universal selection which provides minimum bias and maximum diversity. MPGA is used to obtain the maximum fitness value which gives the optimal result for the fitness value by removing convergence on some local maxima. It provides optimum maxima. In this research, square and rectangular shapes are used for the layout design, but this system can also be enhanced for other shapes, i.e., it can have other shapes like circular, triangular only by changing some parameters. In the MPGA, some parameters can be changed for making the GA more efficient.
References
[1] A. Kumar, K. Dutta, A. Gupta, S. Badyal, Rohan, D. “Assisting an architect with alternative automated space layout designs using order crossover Genetic Algorithm in AutoCAD,” IEEE International Conference on Advances in Mechanical, Industrial, Automation and Management Systems (AMIAMS), 2017, pp. 298–303.
[2] K. Shekhawat, “Automated space allocation using mathematical techniques,” Ain Shams Engineering Journal, vol. 6, no. 3, pp. 795–802, 2015.
[3] M. Verma, and M. K. Thakur, “Architectural space planning using genetic algorithms,” The 2nd International Conference on Computer and Automation Engineering (ICCAE), vol. 2, pp. 268–275, 2010.
[4] D. E. Goldberg, Genetic Algorithms in Search, Optimization, and Machine Learning, New York: Addison-Wesley, 1989.
[5] K. S. Nawaz Ripon, S. Kwong, K. F. Man, “A real-coding jumping gene genetic algorithm (RJGGA) for multi objective optimization,” Information Sciences: An International Journal, vol. 177, no. 2, pp. 632–654, 2007.
[6] S. E. Kesen, S. K. Das, Z. Güngör, “A genetic algorithm based heuristic for scheduling of virtual manufacturing cells (VMCs),” Computers and Operations Research, vol. 37, no. 6, pp. 1148–1156, 2010.
[7] W. Groissboeck, E. Lughofer, S. Thumfart, “Associating visual textures with human perceptions using genetic algorithms,” Information Sciences: An International Journal, vol. 180, no. 11, pp. 2065–2084, 2010.
[8] R. Mallipeddi, S. Mallipeddi, P. N. Suganthan, “Ensemble strategies with adaptive evolutionary programming,” Information Sciences: An International Journal, vol. 180, no. 9, pp. 571–1581, 2010.
[9] J. Ruch, “Interactive space layout: A graph theoretical approach,” Proceedings of the 15th Design Automation Conference (DAC78), 1978, pp. 152–157.
[10] J. Roth and R. Hashimshony, “Algorithms in graph theory and their use design,” Computer-Aided Design, vol. 20, no. 7, pp. 373–381, 1988.
[11] B. C. Arabacioglu, “Using fuzzy inference system for architectural space analysis,” Applied Soft Computing, vol. 10, no. 3, pp. 926–937¸ 2010.
[12] F. Regateiro, J. Bento, J. Dias, “Floor plan design using block algebra and constraint satisfaction,” Advance Engineering Informatics, vol. 26, pp. 361–382, 2012.
[13] M. Inoue and H. Takagi, “Layout algorithm for an EC-based room layout planning support system,” IEEE Conference on Soft Computing in Industrial Applications (SMCia/08), Muroran, Hokkaido, Japan, 2008, pp. 165–170.
[14] W.R. Miller, “Computer-aided space planning, an introduction,” DMG Newsletter, vol. 5, pp. 6–18, 1971.
[15] R. E. Krof, “A shape independent theory of the space allocation,” Environment and Planning B, vol. 4, pp. 37–50, 1977.
[16] J. Grason, An approach to computerized space planning using graph theory,” DAC ’71 Proceedings of the 8th Design Automation Workshop, 1971, pp. 170–178.
[17] J. Gilleard, Layout – A hierarchical computer model for the production of architectural floor plans,” Environment and Planning B, vol. 5, no. 2, pp. 233–241, 1978.
[18] M. K. Thakur and M. Kumari, “Architectural layout planning using genetic algorithms,” The 3rd IEEE International Conference on Computer Science and Information Technology (ICCSIT), 2010.
[19] J. S. Gero and V. A. Kazakov, “Evolving design genes in space layout planning problems,” Artificial Intelligence in Engineering, vol.12, no. 3, pp. 163–176, 1998.
[20] R. Bausys and I. Pankrasovaite, “Optimization of architectural layout by the improved genetic algorithm,” Journal of Civil Engineering and Management, vol. 11, no. 1, pp. 13–21, 2005.
[21] S. Krish, “A practical generative design method,” Computer-Aided Design, vol. 43, no. 1, pp. 88–100, 2011.
[22] E. Rodrigues, A. R. Gaspar, A. Gomes, “An evolutionary strategy enhanced with a local search technique for the space allocation problem in architecture. Part 1: Methodology,” Computer-Aided Design, vol. 45, no. 5, pp. 887–897, 2013.
[23] T. Schnier and J. Gero, “Learning genetic representations as alternative to hand-coded shape grammars,” Artificial Intelligence in Design, vol. 10, no. 2, pp. 39–57, 1996.
[24] J. C. Damski and J. S. Gero, “An evolutionary approach to generating constraint based space-layout topologies,” in Junge R. (ed) CAAD Futures, 1997, pp. 855–874.
[25] M. Rosenman, “The generation of form using an evolutionary approach,” Dasgupta, D. Michalewicz (eds), Evolutionary Algorithms in Engineering Applications, 1997, pp. 69–86.
[26] J. J. Michalek, R. Choudhary, P. Y. Papalambros, “Architectural layout design optimization,” Engineering Optimization, vol. 34, no. 5, pp. 461–484, 2002.
[27] M. Inoue and H. Takagi, “Architectural room planning support system using methods of generating spatial layout plans and evolutionary multi-objective optimization,” Transactions of the Japanese Society for Artificial Intelligence, vol. 24, no. 1, pp. 25–33, 2009.
[28] M. Mourshed, I. Manthilake, J. Wright, “Automated space layout planning for environmental sustainability,” Proceedings of 3rd CIB Conference on Sustainable Building and Development SABE2009, 2010. http://www.sasbe2009.com/papers.html.
[29] J. M. Palomo-Romero, L. Salas-Morera, L. Garc´a-Hern´andez, “An island model genetic algorithm for unequal area facility layout problems,” Expert Systems with Applications, vol. 68, pp. 151–162, 2017.
[30] J. F. Gonçalves and M.G. Resende, “A biased random-key genetic algorithm for the unequal area facility layout problem,” European Journal of Operational Research, vol. 246, pp. 86–107, 2015.
[31] S. Kumar and J. C. Cheng, “A BIM-based automated site layout planning framework for congested construction sites,” Automation in Construction, vol. 59, pp. 24–37, 2015.
[32] L. Garcia-Hernández, J. M. Palomo-Romero, L. Salas-Morera, A. Arauzo-Azofra, H. Pierreval, “A novel hybrid evolutionary approach for capturing decision maker knowledge into the unequal area facility layout problem,” Expert Systems with Applications, vol. 42, no. 10, pp. 4697–4708, 2015.
[33] Komarudin and K. Y. Wong, “Applying ant system for solving unequal area facility layout problems,” European Journal of Operational Research, vol. 202, no. 3, pp. 730–746, 2010.
[34] R. Matai, “Solving multi objective facility layout problem by modified simulated annealing,” Applied Mathematics and Computation, vol. 261, pp. 302–311, 2015.
[35] J. Guan and G. Lin, “Hybridizing variable neighborhood search with ant colony optimization for solving the single row facility layout problem,” European Journal of Operational Research, vol. 248, no. 3, pp. 899–909, 2016.
[36] Y. H. Lee and M. H. Lee, “A shape-based block layout approach to facility layout problems using hybrid genetic algorithm,” Computers and Industrial Engineering, vol. 42, no. 2–4, pp. 237–248, 2002.
[37] M. Rebaudengo and M. S. Reorda, “Gallo A genetic algorithm for floorplan area optimization,” IEEE Transaction on Computer-Aided Design of Integrated Circuits and Systems, vol. 15, no. 8, pp. 943–951, 1996.
[38] T. Singha, H. S. Dutta, M. De, “Optimization of floor planning using genetic algorithm,” Procedia Technology, vol. 4, pp. 825–829, 2012.
[39] M. A. Jabri, “Building rectangular floorplans-a graph theoretical approach,” VLSI Design, vol. 1, no. 2, pp. 99–111, 1994.
[40] K. Dutta and S. Sarthak, “Architectural space planning using evolutionary computing approaches: a review,” Artificial Intelligence Review, vol. 36, no. 4, pp. 311–321, 2011.
[41] A. Drira, H. Pierreval, S. Hajri-Gabouj, “Facility layout problems: A survey,” Annual Reviews in Control, vol. 31, no 2, pp. 255–267, 2007.
[42] H. Pohlheim, The Multipopulation Genetic Algorithm: Local Selection and Migration, Systems Technology Research, Daimler Benz AG Alt-Moabit 96a, D-10559 Berlin, http://www.pohlheim.com/Papers/mpga\_gal95/gal2\_1.html.
[43] K. Jebari and M. Madiafi, “Selection methods for genetic algorithms,” International Journal of Emerging Sciences, vol. 3, no. 4, pp. 333–345, 2013.
[44] K. Chan and H. Tansri, “A study of genetic crossover operations on the facilities layout problem,” Computers and Industrial Engineering, vol. 26, no. 3, pp. 537–550, 1994.
[45] K. Belkadi, M. Gourgand, M. Benyettou, “Parallel genetic algorithms with migration for the hybrid flow shop scheduling problem,” Journal of Applied Mathematics and Decision Sciences, pp. 1–17, 2006.
[46] M. Kurdi, “An effective new island model genetic algorithm for job shop scheduling problem,” Computers Operations Research, vol. 67, pp. 132–142, 2016.
Biographies

Arun Kumar received his bachelor’s degree in computer science and engineering from Uttar Pradesh Technical University in 2010, his master’s degree in computer science and engineering from National Institute of Technology in 2017, and his Philosophy of Doctorate degree has been submitted in Computer Science and Engineering to Indian Institute of Technology in 2022, respectively. He is currently working as an Assistant Professor at the Department of Computer Science and Engineering, Faculty of Engineering, Bennett University. His research areas include machine learning, deep learning, and evolutionary algorithms.

Kamlesh Dutta is currently working as an Associate Professor at the Department of Computer Science and Engineering, Faculty of Engineering, National Institute of Technology. Her research areas include machine learning, deep learning, and evolutionary algorithms.
Journal of Web Engineering, Vol. 22_2, 357–384.
doi: 10.13052/jwe1540-9589.2227
© 2023 River Publishers