Ethereum Smart Contract Account Classification and Transaction Prediction Using the Graph Attention Network
Hankyeong Ko1, Sangji Lee2 and Jungwon Seo3,*
1Graduate School of Metaverse, Sogang University, 915 Ricci Hall 35 Baekbeom-Ro, Mapo-gu, South Korea
2Data Science·Artificial Intelligence, Sogang University, 307 Adam Schall Hall 35 Baekbeom-Ro, Mapo-gu, Sepul, South Korea
3Department of Computer Science and Engineering, Sogang University, 915 Ricci Hall 35 Baekbeom-Ro, Mapo-gu, Seoul, South Korea
E-mail: hko920920@sogang.ac.kr; sjlee21@sogang.ac.kr; jungwon@sogang.ac.kr
*Corresponding Author
Received 23 January 2024; Accepted 19 June 2024
Abstract
This study explores the application of a Graph Attention Networks version 2 (GATv2) model in analyzing the Ethereum blockchain network, addressing the challenge posed by its inherent anonymity. We constructed a heterogeneous graph representation of the network to categorize contract accounts (CAs) into different decentralized application (DApp) categories, such as DeFi, gaming, and NFT markets, using transaction history data. Additionally, we developed a link prediction model to forecast transactions between externally owned accounts (EOAs) and CAs. Our results demonstrated the effectiveness of the heterogeneous graph model in improving node embedding expressiveness and enhancing transaction prediction accuracy. The study offers practical tools for analyzing DApp flows within the Web3 ecosystem, facilitating the automatic prediction of CA service categories and identifying active DApp usage. While currently focused on the Ethereum network, future research could expand to include layer 2 networks like Arbitrum One, Optimism, and Polygon, thereby broadening the scope of analysis in the evolving blockchain landscape.
Keywords: Blockchain, decentralized application(Dapps), Graph Attention Networks version 2 (GATv2).
1 Introduction
Blockchain technology was first introduced to the public in 2008 through a white paper authored by Satoshi Nakamoto [1]. Blockchain technology serves as a decentralized repository, specifically designed to uphold the integrity and transparency of data. One of the key features of blockchain is its capacity to securely store and manage data without relying on centralized authority [2].
With the advent of blockchain technology, cryptocurrencies like Bitcoin emerged, poised to play a pivotal role in enhancing the security and privacy of the digital market [3]. The rise of cryptocurrencies has been further accelerated by the introduction of smart contracts on the blockchain. Ethereum, in particular, rediscovered and popularized smart contract technology, enabling the movement of digital assets based on predefined rules, with automated execution of functions when specific conditions are met [4]. This intersection of smart contracts and cryptocurrencies has given birth to the concept of decentralized finance (DeFi), facilitating the creation of a wide range of services across various fields, including gaming and banking [5]
The development of DeFi services has spurred the creation of decentralized applications (Dapps) that leverage smart contracts. Dapps ensure data integrity and transparency by recording transaction histories, facilitated through user interfaces, directly onto the blockchain via smart contracts [6]. Unlike conventional applications, Dapps are considered to offer enhanced security against data manipulation and hacking threats. In line with this assessment, a report by DappRadar, a company specializing in Dapp-related analytics, revealed that in 2022 the daily user count for Dapps reached 2.4 million, marking a 396% increase from the previous year [7].
The industry encompassing decentralized applications and services, experiencing a swift surge in user adoption, finds representation in the concept of Web3, which is currently gaining substantial attention and market value [8]. The advancement of blockchain technology has given rise to DeFi applications and the emergence of concepts like Web3, resulting in a gradual increase in the number of blockchain users. For instance, Etherscan, an Ethereum analysis platforms reported that the number of user wallets surpassed 300 million in the first quarter of 2023 [9], accompanied by a count of over 48 million deployed Ethereum smart contracts [10].
As highlighted earlier, the blockchain market is undergoing rapid transformation, yet there exists a notable gap in research concerning analytics technologies capable of keeping pace with these changes. Presently, existing analytics tools in the market are primarily utilized as investment indicators for cryptocurrencies or for monitoring illicit transactions. Furthermore, blockchain networks, including Ethereum, predominantly operate on an anonymity-by-default basis, posing challenges in identifying the specific service account associated with a given smart contract. While Etherscan offers a labeling service for certain accounts, its reliance on user reports limits its capacity to swiftly categorize all smart contracts comprehensively.
In this paper, we present a novel solution to address the existing gap in analytics and account identification technologies that can effectively adapt to the dynamic blockchain market. Our proposed solution introduces a prediction model. Specifically, we propose a classification model that utilizes artificial intelligence neural network algorithms to discern the types of smart contracts based on blockchain transaction data. In our approach, smart contracts are categorized into eight distinct classes, including DeFi, exchange, game, gambling, marketplace, collectibles, social, and high-risk. We leverage the transaction history between anonymous accounts to facilitate the classification of these smart contracts. Additionally, our approach puts forth a predictive model designed to anticipate transactions occurring between specific wallet addresses and smart contracts.
The contribution of this paper is as follows:
• In the context of the privacy-focused Web3 environment, user information is typically confined to their assets and transaction history. However, the transaction prediction model introduced in this paper goes beyond this limited data scope. It can anticipate the likelihood of a transaction occurring between a specific individual wallet and a contract account by taking into account not only the available data but also the contract account type information derived from the aforementioned contract type classification model.
• The adoption of our proposed model enables the prediction of which wallet, among anonymous users, is most likely to engage in transactions with specific contracts. When put into practical use, this capability could pave the way for the implementation of customized recommendation features akin to those offered by popular application marketplaces like Google Play Store and Apple Store. This, in turn, has the potential to significantly boost business expansion within the Web3 industry Dapps.
• Furthermore, leveraging this model for the analysis of Dapp users in the Web3 industry can provide valuable insights into current industry trends and user usage patterns. From a business perspective, harnessing this data is expected to yield substantial benefits, including improved user retention and the attraction of new users.
This paper is structured as follows: in Section 2, we delve into the prerequisites for modeling, while Section 3 provides an overview of related research. Section 4 details the design of our model, elaborating on the node-embedding model’s structure that we employ consistently throughout our study and its application in training the account type classification and transaction prediction models. Moving on to Section 5, we outline our approach to preparing experimental data, training under varying conditions, and conducting comparative evaluations of performance.
2 Preliminaries
2.1 Ethereum Account
In the Ethereum network, transactions are primarily associated with accounts, which are categorized into two main types [11]. The first is the externally owned account (EOA), a fundamental account type managed via a private key, enabling it to initiate or receive transactions. The second type is contract accounts (CAs), which are under the control of contract code. An account comprises several components, including a nonce representing the cumulative transaction count, the current Ethereum balance, contract code (present only in CAs), and a storage field. The presence or absence of contract code is a key distinguishing factor for identifying the account type. Additionally, the initial transaction for a CA is the deployment transaction, allowing the deployer EOA to be traced through its transaction history.
2.2 Graph Attention Network
Graphs are data structures that represent objects and their interconnections using nodes and edges, respectively. Their versatility in modeling various complex systems, including social networks, protein interactions, and physics, has led to extensive research across multiple domains. Consequently, graph neural networks, a deep learning framework tailored for graph-based data, have garnered considerable attention [12].
The graph attention network (GAT) [13] is an architecture that employs a self-attention mechanism for node classification in graph-structured data. The attention mechanism focuses on the most pertinent aspects of input data, regardless of their size or scale. The transformer [14], another model that utilizes self-attention to compute a single sequence representation, has demonstrated significant performance improvements over traditional models employing recurrent or convolutional neural networks, particularly in machine transaction.
Similar to the graph convolutional network (GCN), GAT leverages information from neighboring nodes but places more emphasis on nodes with fewer neighbors by assigning them higher weights. What sets GAP apart from GCN is its consideration of node features in weight calculations, as illustrated in Equation (1).
| (1) |
The GATv2 model has been introduced as an enhancement to the original GAT [15]. The GAT score function can be simplified to a single linear layer since it comprises a weight matrix and an attention mechanism , which serves as a feedforward neural network. To address this limitation, GATv2 repositions so that it operates after the nonlinear function LeakyReLU, and subsequently, a multi-layer perceptron (MLP) is applied to calculate the score value for each query–key pair connecting the node representations , , followed by . The score function of GATv2 is depicted in Equation (2).
| (2) |
3 Related Work
In this section, we will review the current state of the art in transaction analytics. Previous research in this field can be broadly categorized into two main types. Firstly, there is transaction analysis and prediction research [16, 17], which involves the application of machine learning algorithms to analyze and forecast transactions. This type of research has gained momentum with the rise of cryptocurrency investments and the exploitation of anonymity. Secondly, we have research that integrates graph representation, which has emerged as a prominent trend in recent years [18, 19, 20].
Harlev et al. [16] utilized the gradient boosting technique to categorize anonymous accounts in Bitcoin transaction logs into 10 distinct categories, including exchanges, hot wallets, mining pools, and scams. Hu et al. [17] introduced a model for classifying Ethereum smart contracts into six types, using criteria from DappRader, a Dapp information platform. They applied the LSTM algorithm to analyze time series data on transaction occurrence frequencies and the flow of holding by type. Furthermore, they conducted experiments to apply this model to outlier detection tasks by type.
Although machine learning research using transaction data [16, 17] has proposed account type classification models to aid in the detection of phishing accounts and abnormal transactions, these models have certain limitations that hinder their applicability in the analysis of users in the Web3 environment.
Beres et al. [18] conducted experiments on Ethereum user identification using node embeddings. They established connections (predictions) between addresses believed to belong to the same user based on various paths, such as Twitter, ENS, and DAOs. They suggested that their model could be employed to tract the flow of Ethereum through mixers like Tornado Cash. Huang et al [19] introduced a classification model for Ethereum accounts, known as GCN for Ethereum with Heterophily (EH-GCN), which employs the graph convolution network (GCN) algorithm. They utilized a large-scale dataset of Ethereum transactions and identified a high degree of heterophily in network relationships. To account for this, they applied high-order neighbor-based sampling and embedding. Each account was presented as a node, and edges between nodes were created based on transactions within two hops. Node features for training included balance, transaction frequency, and quantity. Liu et al. [20] proposed a filter and augment graph neural network (FA-GNN) for classifying Ethereum network accounts. This model draws inspiration from the GraphSAGE approach. For learning large-scale graphs, FA-GNN incorporates neighbor sampling and information aggregation from these neighbors as node embedding features, significantly enhancing learning performance.
While prior research using graphs [18, 19, 20] has primarily represented and learned homogeneous graphs, treating nodes and edges, i.e. accounts and transaction types, as equivalent, this approach faces limitations when applied to the analysis of Web3 users. In Web3, user analysis requires a heterogeneous graph structure that distinguishes between different node types (EOA, CA) and edge types (normal, internal).
Therefore, in this paper, we introduce a model designed for the analysis of Dapp users in Web3, an expanding industry. Our approach extends beyond mere techniques for detecting phishing accounts and abnormal transactions. Moreover, our model is capable of representing data in the form of a heterogeneous graph, effectively differentiating between node and edge type (EOA, CA, normal, internal) and using them as input data, resulting in improved performance.
4 Approach
Section 2 discussed that Ethereum on-chain data encompasses numerous accounts and transaction occurrences, with distinct types for both accounts and transactions. This data structure lends itself well to representation as a heterogeneous graph, where accounts serve as nodes, and the transactions connecting these accounts are represented as edges. In this study, we leverage node embedding models using graph neural networks to construct and experiment with two models introduced in the Section 1. The first model focuses on identifying CA types, akin to a node classification task in graph analysis. The second problem involves predicting whether a transaction will occur between an EOA and a CA, which can be framed as a link prediction task.
4.1 Node Embedding Model
The models utilized in this research are founded on node embeddings employing the GATv2 algorithm, tailored for heterogeneous graphs. The process involves converting a dataset containing node and edge information into graph objects and subsequently generating the final embeddings through a graph neural network. An overview of this overall structure is illustrated in Figure 1.
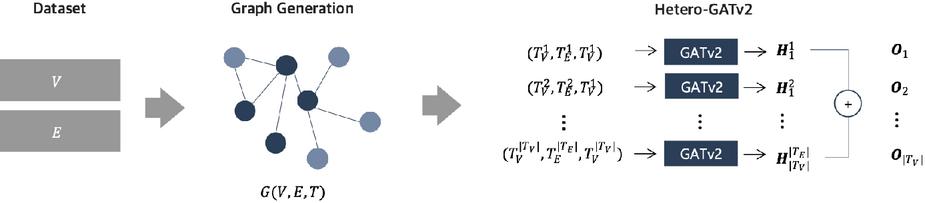
Figure 1 Structure of the node embedding model (herto-GATv2).
Initially, a dataset containing node and edge information is provided as input to construct a graph. The node dataset () encompasses node types and node attribute details, while the edge dataset () encompasses type and attribute information for each edge. This information is utilized to generate a heterogeneous graph denoted as .
If the graph is initially directed, it is transformed into an undirected (bi-directional) graph to facilitate subsequent message passing. Consequently, each in the node set is represented as a vector of attributes, and each in the edge set is represented as a vector of edge attributes. Subsequently, a type mapping function denoted as is employed to distinguish the type of each node and edge.
In this study, we denote the th type of a node as and the and th edge type as . If it is a homogeneous graph with no type distinction, it is labeled as , and if it is a heterogeneous graph, it is labeled as .
The resulting heterogeneous graph is passed through layers of the GATv2 neural network to output node embeddings. In this study, the number of layers is 3. Since GATv2 is basically a homogeneous graph-based algorithm, to apply it to heterogeneous graphs, separate neural networks must be constructed and trained for each node and edge type.
This means that each type performs message passing through the GATv2 layer independently. On the other hand, traditional GAT and GATv2 use only node features. However, for the Ethereum on-chain data covered in this study, we assumed that information from edges, which represents transactions history, would also have an important impact on learning performance. Therefore, we included it in the calculation of attention scores and message updates.
Therefore, in our model, we calculate the attention score for nodes , and the edge between them in the GATv2 layer, as shown in Equation (3). Then, in layer , we construct a message function as shown in Equation 4 to update the state value of node .
| (3) | |
| (4) |
If different types have different feature sizes, the input dimensions will follow the feature size of that type, but the final output dimension size will be the same for all. The output values from all three GATv2 layers are then summed together for each node type to obtain the final node embedding matrix . From this point on, the node embedding model described above will be referred to as - in this paper to distinguish it from other existing algorithms.
4.2 Contract Account Type Classification Model
After graphically representing Ethereum on-chain data, we can apply - to create a model for classifying contract account types. Ethereum technically divides accounts (nodes) into EOAs and CAs, and transactions (edges) into general and internal transactions, including message calls to contract accounts. This structure can be utilized to form a heterogeneous graph.
Using this data - creates a node embedding for each EOA and CA, utilizing the embedding matrix specifically for the CA type nodes that we aim to predict. The dimensionality of this embedding is determined by the number of types we want to classify.
During the training process, we employed Adam as the optimization function and cross entropy loss as the loss function. To address potential class imbalance issues, we assigned weights to each class, ensuring that minority classes receive more significant updates during the parameter update process via the loss function.
4.3 Transaction Occurrence Prediction Model
From a graph perspective, predicting transaction occurrences can be framed as a link prediction task. Link prediction focuses on predicting the presence or absence of links (edges) in a network, rather than assigning labels to nodes. This task differs from node classification in terms of training objectives and methodologies. While various frameworks exist for link prediction, this study utilizes matrix factorization as its basis.
The graph is structured as a bipartite graph, with node types organized as EOA and CA. However, the scope is limited to edges originating from EOA and leading to CA. Node embeddings for this graph are generated by first creating initial embedding matrices for each node type. These node features are linearly combined, and message passing is independently performed for each node and edge type, employing -. Consequently, new embedding matrices of dimension are produced, denoted as and for EOA and CA, respectively.
The desired output from the link prediction model corresponds to the presence of an edge from a specific EOA to a CA. This is a binary classification problem. To achieve this we compute a vector for each dimension, as shown in Equation (5), through inner product, followed by summation.
| (5) |
Binary cross entropy is employed as the loss function, with logic applied to determine whether the value represents the true label comprising actual negative and positive edges. The objective is to minimize the error. Given that the input graph is relatively larger than the node classification problem, even with edge sampling, training occurs on the entire graph containing all nodes. Therefore, stochastic gradient descent is chosen as the optimization algorithm to alleviate computational burden and expedite the learning process.
5 Experiments
5.1 Data Collection and Pre-processing
To obtain label values for address and type classification, we leveraged two primary data sources: the Ethereum transaction tracking site Etherscan and the DApp information service DappRader. Etherscan’s Label Word Cloud provides label values for officially verified CAs in Etherscan. It allows us to associate a specific CA with the corresponding DApp, but it does not categorize the type of DApp (e.g., financial, gaming). On the other hand, DappRadar offers category information categorized by the service itself, but it can only be checked by searching for a specific CA address value.
In this study, we adopted a two-step approach. First, we crawled the CA addresses identified in the Etherscan Label Word Cloud. Subsequently, we individually queried these addresses in the DappRadar API to collect category information, which would serve as labels for the classification task. Among the categories provided by DappRadar, we excluded CAs categorized as “other”, as this category was deemed ambiguous.
For CAs with identified categories, we employed the Etherscan API to identify the EOAs that deployed them. Transaction data generated by the collected CAs was sourced from the Ethereum public dataset available on Google Cloud Platform’s BigQuery. We extracted transaction data spanning two and a half years, from January 2021 to June 2023, during a period of rapid growth in Dapp user numbers. Additionally, we queried both the identified CAs and all EOAs with a history of invoking them at the time of extraction.
Figure 2 provides a summarized overview of the entire data collection process as described above.
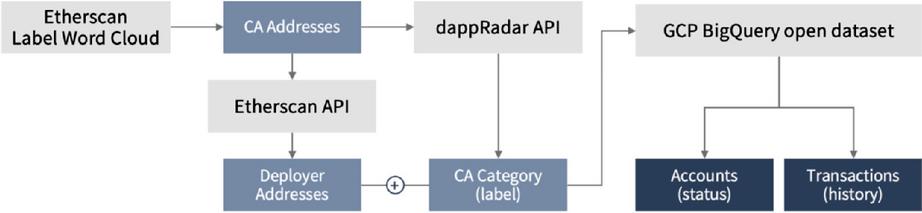
Figure 2 Data collection process.
Following the aforementioned procedure, we successfully generated two tables: the account table, which houses information about individual accounts, and the transaction table, which records details about transactions transpiring between two accounts. These tables are depicted in Tables 1 and 2, respectively.
| Field name | Description |
| ADDR | Address |
| TYPE | Account type (EOA, CA) |
| ETH_BALANCE | Ethereum balance |
| VALUE_ETH_FROM | Value transferred from Ethereum |
| VALUE_ETH_TO | Value transferred to Ethereum |
| TRANS_CNT_FROM | Transaction count from (sending) |
| TRANS_CNT_TO | Transaction count to (receiving) |
| FRST_TX_TS | First transaction timestamp |
| DAPP_ID | DApp ID (if related to CA) |
| DAPP_NM | DApp Name (if related to CA) |
| DAPP_CATEGORY | DApp category (if related to CA) |
| DAPP_DEPLOYER | DApp deployer (if related to CA) |
| Field Name | Description |
| ADDR_1 | Address of sender |
| ADDR_2 | Address of receiver |
| TYPE_1 | Type of sender’s account |
| TYPE_2 | Type of receiver’s account |
| IS_DEPLOYER_TRANS | Transaction by CA deployer |
| VALUE_ETH | Value in Ethereum |
| TRANS_CNT | Transaction count between ADDR_1 and ADDR_2 |
The data contained in the account table serves as node features in the graph, while the transaction table provides information for the edge features. It’s worth noting that in Table 2, the transaction table presents an aggregation of transactions between two unique accounts. Unlike previous research focused on detecting phishing accounts, we aggregate transaction hashes without distinguishing between them for several reasons.
Previous studies primarily dealt with data from a small number of EOAs that had been identified. In contrast, the data collected for this study was primarily based on contract accounts (CAs), resulting in a significantly larger number of EOAs and transactions associated with their invocations. Given the research’s objective, which centered on understanding the nature of contract accounts and identifying whether transactions occurred between them (i.e., the relationship), we believed that aggregating information between accounts would yield meaningful insights, obviating the need to discern individual transaction patterns.
Consequently, our data collection effort amassed a total of 32,666,765 accounts comprising 32,663,595 EOAs and 3170 CAs. These accounts engaged in a total of 81,220,508 transaction pairs
Before converting the collected data into graph objects, we conducted pre-processing to explore, analyze, and transform the data into a suitable format for model training. Initially, we removed the DAAP_ID and DAAP_NM columns from the account table since they were deemed unnecessary for training purposes. Additionally, we excluded the FRST_TX_TS column from the account table, which signifies the initial transactions of the account. For contract accounts (CA), we also eliminated the contract code deployment time. These datetime values were originally stored as datetime types during data collection, and we subsequently converted them into numeric variables in UNIX units. This transformation allowed us to represent account activity chronologically, with higher values indicating closer proximity to the recent extraction time and lower values indicating older accounts.
Table 3 Number of accounts per CA category
| Defi | Exchanges | Games | Gambling | Marketplace | High-risk | Social | Collectibles |
| 1164 | 1784 | 120 | 26 | 92 | 6 | 45 | 63 |
To encode the categorical variable associated with CA categories, we employed two distinct methods. First, for use as labels in the node classification problem, we generated eight features through one-hot encoding, each corresponding to a specific category, as detailed in Table 3. Here’s a brief description of the categories:
• DeFi: Contract accounts linked to decentralized exchange products, including services like staking, deposits, and swaps within a specific platform.
• Exchanges: Contract accounts affiliated with decentralized exchange services
• Games: Contract accounts categorized under gaming-related Dapps.
• Gambling: Contract accounts associated with gambling-related Dapps.
• Marketplace: Contract accounts involved in NFT exchanges, such as Opensea and Blur.
• Collectibles: Contract accounts tied to NFT projects like MAYC.
• Contract accounts related to other decentralized social applications.
• High-risk: Contract accounts identified as fraudulent or high-risk.
These one-hot encoded features served as labels for the node classification problem and as training inputs for edge prediction in the link prediction problem. For the link prediction task, we employed frequency encoding to create a single features, CATEGORY_FREQ, which captured the frequency of each category. This approach was adopted to prevent potential overfitting due to high dimensionality.
The original distributions of continuous variable such as ETH_BALANCE, VALUE_ETH_FROM, VALUE_ETH_TO, TRANS_CNT_FROM, TRANS_CNT_ TO, FRST_TX_TS, CATEGORY_FREQ, as well as numerical variables like VALUE_ETH and TRANS_CNT in the transaction table displayed significant skewness towards one side, as depicted on the left side of Figure 3. To mitigate this skewness, we applied a power transformation. However, since certain variables contained zero values, we opted for the Yeo-Johnson transformation instead of the Box-Cox transformation to accommodate these cases. As a result, the distribution were adjusted to a more normalized appearance, as illustrated on the right side of the figure.
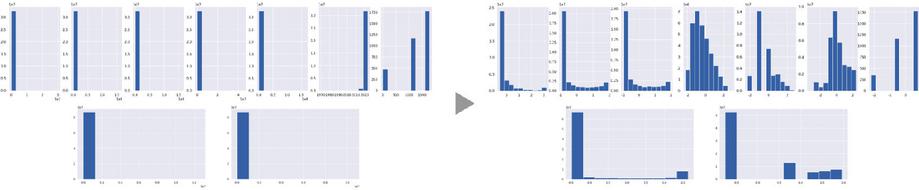
Figure 3 Existing distribution of numerical variables (left) and Yeo-Johnson transformation results (right).
Subsequently, we divided the data into training, validation, and test datasets. For the CA account classification task, we utilized the CA accounts from the account table as the foundation for partitioning into node units intended for use as nodes in the graph. We distributed the data across these datasets in an 8:1:1 ratio. Recognizing the imbalanced data distribution across labels, as indicated in Table 3, we employed a stratified sampling technique to ensure representation of all categories in the three datasets.Conversely, for the transaction prediction model, we did not factor in categories, as all nodes were incorporated in each dataset. Instead, we divided the data into a 7:1:2 ratio, with the ratios being based on call transactions originating from EOAs to CAs.
5.2 Graphing and Neighborhood Sampling
We leveraged the PyTorch Geometric (PyG) library to construct a graph object based on the pre-processed data. In this graph, each node represents an account, while the edges correspond to transactions occurring between these accounts. To facilitate the use of the proposed model, we categorized node types into EOA and CA, following the TYPE column in Table 1, and designated the edge types as TYPE_1 and TYPE_2, as defined in Table 2. Each edge represents a directed connection, originating from ADDR_1 (source node) and terminating at ADDR_2 (target node).
The node attributes are derived from ETH_BALANCE, VALUE_ETH_ FROM, VALUE_ETH_TO, TRANS_CNT_FROM, TRANS_CNT_TO and FIRST_ TX_TS, as presented in Table 1. Furthermore, we included VALUE_ETH and TRANS_CNT from Table 2 as edge attributes, which were used as features from model training. For the transaction prediction model, we introduced an additional category feature for CA-type nodes, supplementing the existing seven features used in model training. To mitigate potential overfitting risks, given the unbalanced distribution of each class, we employed a frequency encoding method (CATEGORY_FREQ) instead of one-hot encoding to avoid significant dimensionality expansion in the input data.
Consequently, the number of features for EOA nodes total seven, while CA nodes encompass eight features. This discrepancy does not impact the learning process, as the heterogeneous graph treats them as distinct node types. The structural layout of the resulting heterogeneous graph is depicted in Figure 4.

Figure 4 A heterogeneous graph representation of the Ethereum network.
The training dataset produces a rather sizable graph, making full-batch training unfeasible. As a solution, we adopted the neighbor sampling technique. For the CA type classification model, we sampled the target nodes, specifically CA type nodes, and their adjacent neighbors in line with the node classification task. Reflecting the graph configuration, where the median CA degree stood at 132, with the 1st quartile at 3000, the 34th quartile at 3000, and the 90th percentile at 3283, we undermined the number of neighbors sampled for training the CA accounts classification model within this range.
Conversely, for the transaction prediction model, we sampled neighbors based on call-type edge originating from EOA to CA since these are the link predictors. Regarding this type of edge, the EOA median degree amounted to 12, the 1st quartile to 2, and the 3rd quartile to 230, implying that the number of neighbors sampled for transaction prediction was relatively small. The NeighborLoader and LinkNeighborLoader, both provided by PyG, were employed to implement the actual sampling process.
Concerning the LinkNeighborLoader, we upheld a 1:1 ratio by masking the actual edges between two nodes as 1 if they existed (positive edges) and 0 if they didn’t (negative edges). To encompass transactions from as many distinct CA categories as possible, we prioritized sampling according to the number, giving preference to edges in the minority category. In the following section, we compare the performance of sampling under varying conditions and provide details of the outcomes.
5.3 Comparison and Evaluation Methods
In the CA type classification model, we assess performance by comparing whether the node embedding model - for heterogeneous graphs outperforms the existing homogeneous graph-based GATv2 model. The homogeneous graph used as a comparison benchmark can be constructed by removing only the type information of nodes and edges from the heterogeneous graph generated in Section 2.
The GATv2 configuration comprises three layers to create an environment as similar as possible to -. To distinguish this comparative model, we will refer to it as -. The message passing of - and - for the collected on-chain data graph in Figure 4 is organized as illustrated in Figure 5. To identify the appropriate sampling level, we adjust the number of neighbors to be sampled when comparing the two models and examine its impact on prediction performance.
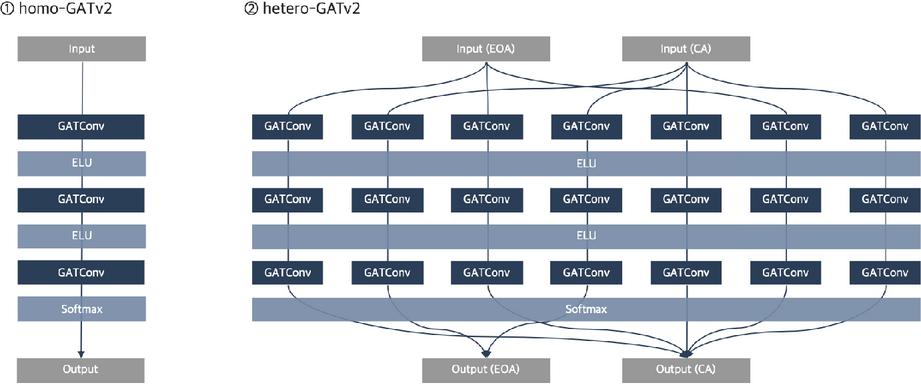
Figure 5 Comparison of - and - in contract account type classification.
Apart from accuracy, a commonly used classification metric, we employ the F1 score, precision, and recall to evaluate the two models. Accuracy gauges overall model performance, while the other three metrics are evaluated in two ways. First, we utilize the widely used macro method, allowing us to evaluate performance under the assumption that all classes carry equal importance. Second, given the unbalanced distribution of classification label values in the collected dataset in Table 3, we also apply the weighted method, which assigns weights in proportion to the actual number of classes (support). According to this calculation, classification performance for classes with a larger number of labels, such as DeFi and Exchanges, is considered more significant.
For the transaction prediction model, we compare the predictive performance of the model trained with and without the CA category values classified by the CA-type classification model as new node features to ascertain whether information not present in the existing on-chain data enhances prediction performance. Node embeddings for each type of EOA and CA were obtained through matrix factorization to conduct link predication.
The message passing configuration of - for the collected on-chain data graph in Figure 4 is displayed in Figure 6. In the previous experiment with the contract account type classification model, we exclusively employed the - model as the comparison with - indicated that - offers superior node embedding expressiveness.
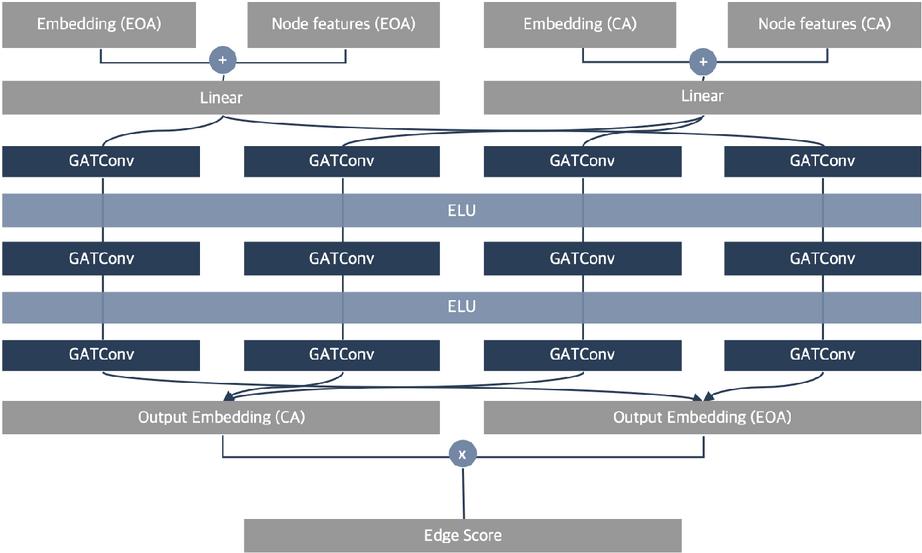
Figure 6 Node embedding with - in transaction prediction.
Transaction prediction models are evaluated using accuracy, precision, recall, and AUC metrics. Accuracy provides insight into overall predictive model performance. However, transaction prediction models function as binary classifiers, and we calculate the AUC as a suitable metric for them. The area under curve (AUC) represents the area beneath the receiver operating characteristic (ROC) curve. The ROC curve illustrates the trade-off between the false positive rate (FPR) and the true positive rate (TPR) as the threshold is adjusted, with higher values closer to 1, indicating better overall model performance across the threshold adjustment range.
5.4 Evaluation of the Contract Type Classification Model
We conducted a performance comparison between the - and - models for various combinations, varying the number of neighbors to sample. We aimed to keep the model parameters as similar as possible to test each model in an identical environment. For the sampling process, we considered up to 3 hops for each of the following neighbor numbers: 5, 10, 100, 300, 500, 1000, and 3000, taking into account the degree distribution of CAs. The batch size was fixed at 128. We employed three stacked 16-dimensional hidden layers and omitted batch normalization or dropout. The model learning rate was set to 0.01, and the weight decay value was set to 0.001.
Table 4 displays the performance metrics for both models as a function of the neighborhood sample size. The results indicate that - outperforms - across all metrics, with larger sample sizes slightly enhancing these metrics. However, for sample sizes exceeding 300, the overall improvement is marginal. Based on these findings, we can conclude that representing Ethereum network data as a heterogeneous graph enhances the representation of node embeddings compared to a homogeneous graph.
Table 4 Comparison of - and - classification models
| Sample size | Accuracy | F1 score (macro/weighted) | Precision (macro/weighted) | Recall (macro/weighted) | ||||
| Homo | Hetero | Homo | Hetero | Homo | Hetero | Homo | Hetero | |
| 5 | 0.63 | 0.79 | 0.23/0.61 | 0.61/0.78 | 0.27/0.65 | 0.61/0.78 | 0.24/0.63 | 0.62/0.79 |
| 10 | 0.67 | 0.81 | 0.27/0.65 | 0.70/0.81 | 0.31/0.73 | 0.76/0.81 | 0.28/0.67 | 0.67/0.81 |
| 100 | 0.73 | 0.83 | 0.37/0.71 | 0.75/0.83 | 0.41/0.75 | 0.82/0.85 | 0.36/0.73 | 0.75/0.83 |
| 300 | 0.74 | 0.86 | 0.56/0.74 | 0.68/0.86 | 0.65/0.76 | 0.70/0.86 | 0.54/0.74 | 0.68/0.86 |
| 500 | 0.73 | 0.86 | 0.48/0.72 | 0.70/0.86 | 0.49/0.75 | 0.71/0.86 | 0.49/0.73 | 0.72/0.86 |
| 1,000 | 0.70 | 0.84 | 0.53/0.70 | 0.68/0.84 | 0.58/0.72 | 0.69/0.84 | 0.51/0.70 | 0.67/0.84 |
| 3,000 | 0.71 | 0.88 | 0.44/0.70 | 0.66/0.88 | 0.44/0.72 | 0.66/0.88 | 0.45/0.71 | 0.64/0.88 |
| 5,000 | 0.73 | 0.86 | 0.51/0.72 | 0.69/0.85 | 0.52/0.74 | 0.69/0.86 | 0.52/0.73 | 0.69/0.86 |
To utilize the results of the CA classification model as training features in the transaction prediction model, we conducted hyperparameter tuning to enhance performance. In each training iteration, we compared the outcomes with the validation dataset and identified that the optimal performance was attained with the conditions detailed in Table 5. These settings led to significant improvements in unweighted F1 score, precision, and recall metrics, as demonstrated in Table 6, compared to the results presented in Table 4.
Table 5 Configure optimal model parameters with hyperparameter tuning
| Parameter name | Configuration value |
| Sample size | 500 * 3 hops |
| Batch size | 128 |
| Hidden layer dimension | 32 |
| Batch normalization | Yes |
| Dropout | 0.1 |
| Number of epochs | 100 |
| Learning rate | 0.01 |
| Weight decay | 0.001 |
Table 6 Evaluated optimal classification model performance (validation, test datasets).
| Dataset | Accuracy | F1 score (macro/weighted) | Precision (macro/weighted) | Recall (macro/weighted) |
| Validation dataset | 0.88 | 0.81/0.85 | 0.85/0.88 | 0.80/0.88 |
| Test dataset | 0.86 | 0.74/0.86 | 0.76/0.86 | 0.74/0.86 |
5.5 Link Prediction Model Evaluation
We trained two models, one using only balance and transaction history in the Ethereum network (GATv2 w/o category) and another model with CA category information included (GATv2 w/category) to investigate whether CA category information enhances performance. GATv2 w/category uses the previously collected CA category features, which are the actual label values, for making predictions. Specifically, we replaced only the CAs that were part of the test dataset during the training of the node classification model with the CA category values predicted by the - model. We then made predictions on the test dataset for link prediction to compare performance with the previous two models (GATv2 w/category (predicted)). The performance metrics for the three models are presented in Table 7.
Table 7 Comparison of model performance with and without CA categories
| Model | Accuracy | Precision | Recall | AUC |
| GATv2 w/o category | 0.73 | 0.77 | 0.73 | 0.87 |
| GATv2 w/category | 0.77 | 0.80 | 0.77 | 0.88 |
| GATv2 w/category (predicted) | 0.76 | 0.79 | 0.77 | 0.88 |
For category information, we sampled transactions from EOAs to CAs up to 3 hops in batches of 5, taking into account that EOAs have varying degrees, ranging from 2 to 230 (median 12). To prevent model overfitting, we added batch regularization and applied a dropout rate of 0.6. Both models used a learning rate of 0.001 and a weight decay parameter of 0.01. Since this is a binary classification task where the model predicts whether a transaction will occur or not, we assessed and compared performance using accuracy and AUC metrics. We observed that including category values improved accuracy, precision, and recall by approximately 2–3%, while the difference in the AUC metric was minimal, less than 1%.
Furthermore, we tested the GATv2 w/category model with a dataset that had been partially imputed with values predicted by the best classification model obtained through hyperparameter tuning (as described in Table 5). We found that there was no significant difference in performance compared to using the actual category values. Thus, for certain CAs, utilizing category predictions outperformed the model trained solely using existing transaction data.
6 Conclusions
In this research, we conducted a comprehensive examination of an account classification model and a predictive transaction occurrence model within the realm of computer science. Our primary objective was to address the challenge of limited analysis resulting from the inherent anonymity of blockchain technology. To achieve this, we focused on the Ethereum network, a prominent blockchain platform boasting a vast user base and extensive network activity. Our data collection efforts encompassed both account-related information and transaction data.
Given the coexistence of individual users and decentralized applications (DApps) within the Ethereum ecosystem, characterized by the continuous flow of internal and external transactions among accounts, we devised a model based on the Graph Attention Networks version 2 (GATv2). This graph neural network algorithm proved ideal for our purpose, as we structured the Ethereum network as a heterogeneous graph – a representation well-suited for our analytical goals.
Our research encompassed two primary tasks. Firstly, in the node classification task, we undertook the categorization of contract accounts (CAs) into various DApp categories, including but not limited to DeFi (decentralized finance), gaming, and NFT (non-fungible token) markets. This categorization relied on an analysis of transaction histories among accounts. Subsequently, we ventured into predicting the likelihood of transactions between externally owned accounts (EOAs) and contract accounts (CAs) through a process known as link prediction.
The outcomes of our experiments provided compelling insights. We demonstrated the capability to discern the nature of DApps by leveraging account balance and transaction data exclusively. Particularly noteworthy was our use of a heterogeneous graph model, which, when compared to prior studies rooted in homogeneous graph-based approaches, exhibited enhanced node embedding expressiveness – a pivotal contribution to on-chain data analysis. Furthermore, our research affirmed the value of incorporating DApp category information obtained through the CA type classification model. This inclusion led to improved accuracy in predicting transactions between accounts. It underscores the potential to derive meaningful insights from publicly accessible on-chain data while opening avenues for generating new variables to enrich subsequent model training efforts.
Our models offer a practical utility in categorizing DApp flows, presenting an invaluable tool for the analysis of DApp users from the perspective of the burgeoning Web3 ecosystem. For instance, our classification model empowers the automatic prediction of a specific CA’s service category, obviating the need for manual investigation. This feature complements existing transaction lookup services like Etherscan by enhancing their historical context. From a business standpoint, this predictive capability aids in swiftly identifying heavily utilized DApps by anonymous users, identified solely by their hash value addresses. Additionally, these insights enable the construction of predictive models to determine which users are most likely to engage with a particular CA.
It is worth noting that our research is currently limited to the Ethereum network. Nevertheless, the blockchain landscape is evolving, with the emergence of layer 2 networks such as Arbitrum One, Optimism, and Polygon – each offering solutions to Ethereum’s high gas costs and slow transaction speeds. These networks host several active DApp projects, each with its own distinctive attributes. Operating on the same Ethereum virtual machine (EVM), users can access them with a single wallet address. Future research initiatives may consider expanding our analysis to encompass transactions from layer 2 networks, thereby further enhancing performance and facilitating comprehensive analysis within the broader blockchain ecosystem
Acknowledgement
This research was supported by the MSIT (Ministry of Science and ICT), Korea, under the ITRC (Information Technology Research Center) support program (IITP-2024-RS-2023-00259099) supervised by the IITP (Institute for Information & Communications Technology Planning & Evaluation). This research was supported by the 2024 MSIT(Ministry of Science and ICT), Korea, under the Graduate School of Metaverse Convergence support program(IITP-2024-RS-2022-00156318) supervised by the IITP(Institute for Information & Communications Technology Planning & Evaluation). This work was supported by Institute of Information & communications Technology Planning & Evaluation (IITP) grant funded by the Korea government (MSIT) (RS-2024-00397538, Development of public opinion polling technology based on web3 that ensures fairness, anonymity, and transparency, 33%).
References
[1] Nakamoto, S. (2008). Bitcoin: A Peer-to-Peer Electronic Cash System.
[2] Q. Ynag, Y. Zhao, H. Huang, Z. Zheng, “Fusing blockchain and AI with metaverse: A survey”, 2022, arXiv:2201.03201.
[3] T.R. Gadekallu, Q.-V. Pham, D.C. Nguyen, P.K.R. Maddikunta, N. Deepa, B. Prabadevi, P.N. Pathirana, J. Zhao, W.-J. Hwang, “Blockchain for edge of things: Applications, opportunities, and challenges”, IEEE Internet Things J. 9 (2) (2022) pp. 964–-988
[4] A.A. Zarir, G.A. Oliva, Z.M. Jiang, A.E. Hassan, “Developing cost-effective blockchain-powered applications: A case study of the gas usage of smart contract transactions in the ethereum blockchain platform”, ACM Trans. Softw. Eng. Methodol. (TOSEM) 30 (3) (2021) pp. 1–-38.
[5] T. Min and W. Cai, “Portrait of decentralized application users: an overview based on large-scale Ethereum data,” CCF Transactions on Pervasive Computing and Interaction 4.2, pp. 124–141, 2022.
[6] H. Garg, M. Singh, V. Sharma and M. Agarwal, “Decentralized Application (DAPP) to enable E-voting system using Blockchain Technology,” 2022 Second International Conference on Computer Science, Engineering and Applications (ICCSEA), Gunupur, India, 2022, pp. 1–6.
[7] Available online: https:/www.coinlive.com/ko/news/Report-DApp-daily-users-surge-to-2-4M-in-Q1 (accessed on 22 January 2024).
[8] Russell Belk, Mariam Humayun, Myriam Brouard, “Money, possessions, and ownership in the Metaverse: NFTs, cryptocurrencies, Web3 and Wild Markets”, Journal of Business Research, Volume 153, 2022, pp. 198–205.
[9] Available online: https:/etherscan.io/charts (accessed on 22 January 2024).
[10] Available online: https:/dune.com/hagaetc/contracts-deployed-on-ethereum-per-month (accessed on 22 January 2024).
[11] V. Buterin, “Ethereum: A Next-Generation Smart Contract and Decentralized Application Platform,” white paper, 2014.
[12] J. Zhou, G. Cui, S. Hu, Z. Zhang, C. Yang and Z. Liu, “Graph neural networks: A review of methods and applications,” AI open, vol. 1, pp. 57–81, 2020.
[13] V. Petar, G. Cucurull, A. Casanova, A. Romeo, P. Lio and Y. Bengio, “Graph Attention Networks,” Proc. of ICLR, 2018.
[14] A. Vaswani, N. Shazeer, N. Parmar, J. Uszkoreit, L. Jones, A. N. Gomez, Ł. Kaiser and I. Polosukhin, “Attention Is All You Need,” Advances in neural information processing systems, 30, 2017.
[15] S. Brody, U. Alon and E. Yahav, “How Attentive Are Graph Neural Networks?,” Proc. of ICLR, 2022.
[16] M. A. Harlev, H. S. Yin, K. C. Langenheldt, R. R. Mukkamala and R. Vatrapu, “Breaking Bad: De-Anonymising Entity Types on the Bitcoin Blockchain Using Supervised Machine Learning,” Proc. 51st Hawaii Int. Conf. Syst. Sci., 2018.
[17] Hu, T., Liu, X., Chen, T., Zhang, X., Huang, X., Niu, W., Lu, J., Zhou, K., & Liu, Y. (2021). “Transaction-based classification and detection approach for Ethereum smart contract”, Inf. Process. Manag., 58, 102462.
[18] F. Beres, I. A. Seres and M. Quintyne-Collins, “Blockchain is Watching You: Profiling and Deanonymizing Ethereum Users,” 2021 IEEE international conference on decentralized applications and infrastructures (DAPPS), 2021.
[19] T. Huang, D. Lin and J. Wu, “Ethereum Account Classification Based on Graph Convolutional Network,” IEEE Transactions on Circuits and Systems II: Express Briefs 69.5, 2022.
[20] J. Liu, J. Zheng and J. Wu, “FA-GNN: Filter and Augment Graph Neural Networks for Account Classification in Ethereum,” IEEE Transactions on Network Science and Engineering 9.4.
Biographies

Hankyeong Ko is a Ph.D. candidate at Sogang Univeristy, majoring in Metaverse Engineering & Blockchain. He obtained a Master’s degree in Metaverse Engineering from Sogang University, with a specialization in Metaverse Engineering & Blockchain. Additionally, he holds a Bachelor’s degree in Business Administration from The Catholic University of Korea, where he graduated in September 2018.

Sangji Lee obtained a Master’s degree in Data Science: Artificial Intelligence from Sogang University and is currently working on a cryptocurrency exchange in South Korea. Additionally, she has studied at the Sungshin Women’s University with a major in Business Administration and a minor in Information System.

Jungwon Seo is a Ph.D. candidate at Sogang Univeristy, majoring in Software Engineering & Blockchain. He obtained a Master’s degree in Computer Science & Engineering from Sogang University in March 2020, with a major in Software Engineering & Blockchain. Additionally, he has studied at the State University of New York at Buffalo in the Business Department, graduating in May 2016 with a major in Management Information Systems.
Journal of Web Engineering, Vol. 23_5, 657–680.
doi: 10.13052/jwe1540-9589.2353
© 2024 River Publishers