A Study on Estimating Theme Park Attendance Using the AdaBoost Algorithm Based on Weather Information from the Korea Meteorological Administration Web
Jinkook Kim1 and Soohyun Kim2,*
1Korea Institute of Sport Science, South Korea
2Dept. of Sport and Healthcare, Namseoul University, South Korea
E-mail: navyjk@kspo.or.kr; shkim001@nsu.ac.kr
∗Corresponding Author
Received 23 June 2024; Accepted 23 July 2024
Abstract
The purpose of this study is to propose an efficient machine learning model based on five years of data for Seoul Grand Park in Republic of Korea, depending on the weather and day characteristics, and to increase its effectiveness as a strategic foundation for national theme park management and marketing. To this end, the AdaBoost model, which reflects the characteristics of the weather and the day of the week, was recently compared with the actual number of visitors and the predicted number of visitors to analyze the accuracy. The analysis showed 30 days of abnormal cases, and the overall annual distribution was found to show similar patterns. Abnormal cases required details of wind speed, average relative humidity, and fine dust concentration for weather information, and it was derived that more accurate predictions would be possible considering variables such as group visitors, new events, and unofficial holidays.
Keywords: Machine learning, AdaBoost, theme park, prediction of admission number.
1 Introduction
Of the various theme park genres, natural theme parks feature natural resources or landscapes such as gardens, forests, waterfalls and caves, and animals and plants [1]. Examples of representative natural theme parks include Knott’s Berry Farm, the first theme park in the United States. Also Farmland in Kumamoto Prefecture, Japan; Fisherman’s Wharf in Macau; and Lotte World and Everland in Korea.
According to Aecom (2017), Lotte World and Everland in Korea recorded 8.15 and 7.2 million visitors, respectively, ranking 14th and 16th in the world. These world-class theme parks serve as tourist landmarks in their region, attracting both Koreans and foreign visitors [2]. A key aspect of theme park operation is increasing the revisit rate by enhancing visitor satisfaction and making consistent investments over a long period. Global theme parks are also steadily responding to market trends to maximize customer satisfaction. They are strengthening their hardware development policies to develop new attractions in response to market changes and software-oriented policies such as re-planning routes to solve customer inconveniences and improve service quality [3].
Demand forecasting in the tourism sector is crucial as it provides essential data for developing policies for various activities [4]. If tourism demand is underestimated, it can inconvenience tourists due to the lack of convenience facilities for sightseeing spots; over-prediction creates unnecessary supply and budget waste. In the past, tourism demand was predicted based on the autoregressive integrated moving average (ARIMA) model, which used primarily time-series data [5]. However, in recent years, the trend has been to apply machine learning or use big data [6]. For example, Chen and Wang (2007) predicted tourism demand using support vector regression (SVR) and applied genetic algorithms (GAs) to determine the optimal SVR parameters [7]. Heerschap et al. (2014) analyzed tourists’ travel patterns by nationality using raw smartphone data and confirmed such data’s usefulness for this purpose [8]. Furthermore, Von Kirby et al. (2017) studied demand forecasting using the Adaptive Boosting (AdaBoost) algorithm to verify the high accuracy of data analysis [9].
Therefore, this study emphasizes the importance of understanding which variables influence predictions about the number of visitors to a theme park. Due to the limited number of precedent studies on demand forecasting for theme parks, only a few variables have been verified. This study predicts variables by considering the characteristics of outdoor activities and theme parks. First, the weather is a critical variable in outdoor activities [10]. The presence or absence of public holidays, a characteristic of specific dates, may also be a characteristic of specific dates and a significant influence. Furthermore, because theme parks provide various attractions, the influx of visitors may increase during special events.
Consequently, this study uses the AdaBoost algorithm, an efficient machine learning model – with five years of visitor data, according to the characteristics of weather and days of the week – to target Seoul’s Grand Park in Korea and establish an efficient operation policy for theme parks to analyze the accuracy of visitor predictions. This study aims to increase the effectiveness of theme park management and marketing as basic strategic data.
2 Research Method
2.1 Method
This study selected Seoul Grand Park, located in Gwacheon-si, Gyeonggi-do, Korea. Information was provided by the public data portal with weather data for Seoul and Gyeonggi Province from 1 January 2015 to 31 December 2019 [11]. Furthermore, information on daily paid visitors to Seoul Grand Park was provided by the Seoul Department of Culture, Sports and Tourism and used for analysis [12]. The status of paid visitors was the same as the weather data over five years, and the data due to closure from 18 December 2016 to 29 March 2017 were refined and used for internal construction.
Furthermore, information on the day of the week and public holidays was designated based on the standard calendar provided by the government. Daily visitors to Seoul Grand Park were classified into paid and free visitors. This study only used paid visitors as data. Table 1 presents the parameters of the input and output variables analyzed in this study. After refining the data for five years of variables, those for the four years, 2015–2018, were used as training data to perform machine learning. Based on the learned results, the 2019 data were used as test data to compare the predicted number of paid visitors to the actual number of visitors for a year.
Table 1 Input and output variables
| Variable | Parameters | |
| Input variables | Date | Date, day of the week, whether it was a public holiday |
| Climate | Daily minimum and maximum temperatures (C), daily precipitation (mm), maximum wind speed (m/s), total sunshine time (h), daily maximum snow cover (cm), average ground temperature (C), average relative humidity (%), minimum relative humidity (%), fine dust (g/m) | |
| Output variable | Number of daily paid visitors to Seoul Grand Park (persons) | |
2.1.1 Prediction methodology: AdaBoost
AdaBoosting
(1) Weak learners: AdaBoost starts by selecting a weak learner, which is a model that performs slightly better than random guessing but is not too complex. Often, decision trees with a small depth (also called "stumps") are used as weak learners, although other classifiers can also be employed.
(2) Weight initialization: Each sample in the training dataset is assigned an initial weight, usually set to 1/N, where N is the total number of samples. These weights indicate the importance of each sample in the learning process.
(3) Training iterations:
∙ Training the weak learner: In each iteration, a new weak learner is trained on the dataset. However, the training dataset is not used directly. Instead, the training set is sampled with a replacement (bootstrapping), and the samples are chosen according to their weights. This means that misclassified samples from previous iterations are given more weight, making them more likely to be included in the current training set.
∙ Weighted error: The weak learner’s performance is evaluated using a weighted error, which takes into account the weights of the samples. The weighted error is calculated as the sum of weights of misclassified samples divided by the sum of all weights.
∙ Classifier weight: A weight (alpha) is assigned to each weak learner based on its performance. Better performing learners are assigned higher weights. The formula for alpha is: alpha = 0.5 ln((1 error)/error), where error is the weighted error of the weak learner.
∙ Updating weights: After calculating the alpha, the weights of the samples are updated. Misclassified samples have their weights increased, making them more important for the next iteration. Correctly classified samples have their weights decreased.
(4) Final ensemble prediction:
∙ Combine weak learners: The weak learners’ predictions are combined into a final strong classifier. The alpha values act as weights for each weak learner’s prediction. Stronger weak learners (lower error) contribute more to the final prediction.
∙ Final prediction: The final prediction of the AdaBoost ensemble is calculated by summing up the weighted predictions of individual weak learners. The class with the highest weighted sum is the final prediction.
(5) Advantages and limitations:
∙ Advantages: AdaBoost is effective in improving the performance of weak learners, especially when they have low individual accuracy. It is also relatively simple to implement and can handle complex datasets and noisy data.
∙ Limitations: AdaBoost is sensitive to outliers, as it assigns more weight to misclassified samples. It can also be susceptible to overfitting if the weak learners become too complex. Additionally, AdaBoost can struggle if the weak learners are too weak, as it might not converge to a strong classifier.
AdaBoost assigns high weights to misclassified samples in the training data, so if the data contains a lot of noise, the model’s performance may degrade. There is a tendency to overfit noisy data. However, according to the PAC (probably approximately correct) learning theory, AdaBoost can reduce training errors given sufficient training data and has shown good performance in many real-world datasets. It has been successfully applied in various fields such as image recognition, natural language processing, and financial forecasting [25]. In particular, for predictions of attendance, revenue, and similar metrics, many previous studies have used this algorithm for predictions with promising results.
In summary, AdaBoost is a boosting algorithm that iteratively combines the predictions of weak learners while adjusting the sample weights to focus on misclassified examples. This process creates a strong ensemble model that often outperforms the individual weak learners.
Training method
AdaBoost was first introduced by Freund and Shapire (1997) [13] as a basic algorithm that uses boosting among ensemble techniques. AdaBoost applied in this study is a method that trains an accelerated classifier expressed as follows [15]
| (1) |
where is a weak learner that takes an object x and returns a real number representing the category to which that object belongs. The sign of a weak learner output indicates the predicted object classification, and the absolute value indicates the reliability of the classification. The Tth classifier converts a positive number if the sample classification is expected to be positive and a negative number otherwise. Each weak learner produces a hypothesis for each sample in the training set as an output. At each iteration step , one weak learner is selected and assigned a coefficient that minimizes the sum of training errors of the final t-step accelerated classifier.
| (2) |
At this time, is an accelerated classifier that is generated up to the previous training stage, is an error function, and indicates that a weak learner is currently considered to add to the final classifier.
Learning method
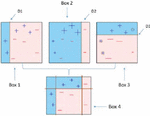
AdaBoost’s learning method proceeds through six steps [16]. The first weak learner classifies and as the first classification criterion (D1). The second weights the misclassified data (increased in the second figure). Then, the second weak learner classifies and again as the second classification criterion (D2) and weights the misclassified data (indicated by the large in the third figure). Next, the third weak learner finds error data by reclassifying and as the third classification criterion (D3) and performs the final prediction by combining all classifiers (Figure 1) [24].
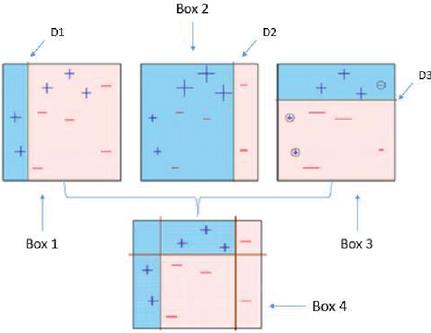
Figure 1 Boosting algorithms in machine learning.(Ray(2015) [24]).
Through this process, weak learners are sequentially trained, weights are assigned to individual learners, and all are combined to produce a prediction result with higher accuracy than individual weak learners. Furthermore, AdaBoost’s hyperparameters include base estimators, n estimators, and the learning rate. Base estimators are algorithms used for learning where default none and the decision tree classifier (max_depth 1) is generally applied. Furthermore, n estimators specify the number of weak learners to be created, with a default of 50. Finally, the learning rate applied every time learning proceeds is a coefficient applied when the weak learner sequentially corrects the error value, with a default of 1.0 [14].
When setting hyperparameters for AdaBoost, the reasons for the default values of basic parameters are as follows [26]:
• n_estimators: This parameter specifies the number of weak learners the model will use. The default value of 50 is chosen because it provides a good balance between performance and computational efficiency across various datasets. If the value is too low, the model might not learn enough. Conversely, if it is too high, the computational cost will increase, and there is a risk of overfitting.
• learning_rate: This parameter adjusts the weights of each weak learner. The default value of 1.0 is a straightforward setting that allows the model to learn relatively quickly.
• base_estimator: By default, a decision tree classifier with a depth of 1 is used. This is a simple model that serves as a “weak learner” and is a suitable basic model for AdaBoost.
2.2 Model Design
This study applied the AdaBoost model, a classification-based machine learning model built in a Python program environment, as its theme park paid visitor prediction model. The AdaBoost algorithm is operated by constructing many weak learners and synthesizing them through weights according to prediction performance [17]. Because this model analyzes by implementing a model using only certain variables, it reflects 100% of the data characteristics compared with other machine-learning algorithm analysis methods. Therefore, the overfitting phenomenon that deteriorates the prediction performance is less likely, with the advantage that the generation of new data is well formed [18]. Furthermore, it is the most suitable prediction model [19] considering there was relatively minimal sample data; the data consists of daily data for five years under a scenario where no previous research had been conducted to predict the number of visitors considering the weather and day of the week.
A generally used value was applied to the hyperparameter of the model set to construct the algorithm. The depth (referring to the depth of interaction between variables) was set to twice to reduce the problem of overfitting that may occur due to the relatively small size of data. Before estimating the model, the learning data were estimated by separating the data set into learning and test data sets. The accuracy difference of the model for the two data types was not significant, thus avoiding the overfitting problem [20].
Accordingly, the model was estimated using 2015–2018 data as training data. For sampling, the number of stratified folds was set to five, and training was performed at the level of 10 repetitions with 70% of the total data. Subsequently, the results obtained by predicting the number of visitors with the test data that provided only the day of the week and weather information (input variables) in 2019 year were compared with the actual number of visitors in 2019 year to derive the RMSE and values – predictability indicators of machine learning.
3 Results
3.1 Machine Learning Model Evaluation and Prediction Results
When evaluating the fit of a machine learning model for predicting visitor numbers, RMSE and metrics are utilized. RMSE directly measures the magnitude of prediction errors and can be interpreted in the units of the actual data, providing an intuitive assessment of errors. also evaluates the explanatory power of the model and is useful for comparing predictive performance against other models or benchmark models. By using both of these metrics together, you can comprehensively understand how accurately the AdaBoost model performs its predictions and how well these predictions explain the variability in the actual data.
Based on the performance evaluation using AdaBoost for training data, the values RMSE 4023.713 and (67.3%) demonstrated relatively high accuracy. When predicting the number of paid visitors in 2019 using the AdaBoost method, 7 September (Sat) 2019, was a closed day, so the total number of predicted days was 364. In comparing the predicted and actual number of visitors, 30 of the 364 days had a large data error, resulting in abnormal cases. Table 2 presents the differences in visitors for major dates. There were 1,291,305 paid visitors to the park in 2019 and 1,624,457 expected visitors predicted by AdaBoost, resulting in a 20.51% error rate.
Table 2 Abnormalities for prediction results
| Date | Day of the Week | Real Visitor | Prediction Visitor | Difference | Note |
| 3.01 | Friday | 4730 | 12,079 | ▼7349 | Dust |
| 3.02 | Saturday | 4 064 | 13,506 | ▼9442 | Dust |
| 3.03 | Sunday | 3160 | 13,506 | ▼10,346 | Dust |
| 4.11 | Thursday | 5834 | 3598 | ▼11,266 | Group |
| 4.25 | Thursday | 5373 | 1811 | ▼3562 | Group |
| 5.01 | Wednesday | 19,887 | 3740 | ▼16,147 | Work |
| 5.30 | Thursday | 14,773 | 4644 | ▼10,129 | Group |
| 6.06 | Thursday | 14,809 | 6211 | ▼8598 | Festival |
| 6.28 | Friday | 16,017 | 1887 | ▼14,130 | Group |
| 7.26 | Friday | 12,550 | 556 | ▼11,994 | Group |
| 9.22 | Sunday | 479 | 11,437 | ▼10,958 | Typhoon |
| 9.26 | Thursday | 8,647 | 2677 | ▼5970 | Group |
| 11.29 | Friday | 17,519 | 656 | ▼16,863 | Group |
Dates marked as “group” in the remarks column of Table 2 refer to days when many visitors arrived as groups rather than as individuals. For example, on Thursday 11 April, considering the weather, the predicted number of visitors was 3598, while the actual number was 5834, a difference of 2236. For AdaBoost, which forecasted 3442 people on this day, it is challenging to predict group visitors that exceed the error range. Furthermore, a large number of visitors were expected from 1 March 1 (Friday) to 3 March (Sunday), considering the weather and that it was a holiday period. However, there were many differences in actual visitors; the fine dust index was 113–129 (g/m) at that time, so the difference was likely due to this “very bad” level. Days in which the figure exceeded 100 (g/m) had a much lower number of visitors than expected.
Although 1 May (Wednesday) was not officially a public holiday because it was Labor Day, there was a significant variation in the number of visitors due to the many workers having a holiday. Furthermore, the difference in the number of visitors on 6 June (Thursday) was due to events such as the “Rose Garden Festival” and the “Lakeside Film Festival” at that time, thought to be the reason that more visitors than usual visited the Grand Park. Furthermore, on 22 September (Sunday), 11,437 visitors were expected because it was a weekend, but a typhoon reduced the actual number of visitors to 479. Although the weather variables include variables for wind speed, it is predicted that errors are caused here by the inability to distinguish between strong winds and typhoons because it is written numerically.
Table 3 presents the main dates of the effective data distribution with little difference between the actual and predicted numbers of visitors. Predictions are relatively accurate if there is no sizeable external variable between the number of visitors predicted by machine learning and the actual number of visitors. On Saturday 25 May, the error was only 163 despite more than 10,000 visitors. Furthermore, on 26 July (Friday), the predicted number of visitors was 556, but the actual number of visitors was 12,550, a significant deviation. However, the number of group visitors was 12,463, and the number of individual visitors was 87. The remarkably low predicted number of visitors was due to the weather; it was assumed that people would have difficulty doing outdoor activities because the average relative humidity was 95.3% on that day, which was the highest of the year. Figure 2 illustrates the distribution of the actual and predicted number of visitors in 2019. Although the overall distributions demonstrate a similar shape, the overall predicted number of visitors is slightly higher than the actual number, so sophisticated refinement work for overfitting is necessary [21].
Table 3 Normal case for prediction results
| Date | Day of the Week | Real Visitor | Prediction Visitor | Difference | Note |
| 1.02 | Wednesday | 175 | 241 | ▼66 | |
| 1.17 | Thursday | 544 | 499 | ▼45 | |
| 3.25 | Monday | 768 | 705 | ▼63 | |
| 5.25 | Saturday | 16,707 | 16,544 | ▼163 | |
| 5.29 | Wednesday | 4039 | 4086 | ▼47 | |
| 6.23 | Sunday | 8066 | 8313 | ▼247 | |
| 7.26 | Friday | 12,550 | 556 | ▼11,994 | Group |
| 8.01 | Thursday | 1862 | 1887 | ▼25 | |
| 9.16 | Monday | 1769 | 1713 | ▼56 | |
| 10.08 | Tuesday | 3931 | 4001 | ▼70 | |
| 11.12 | Tuesday | 1292 | 1320 | ▼28 | |
| 12.30 | Tuesday | 413 | 413 | 0 |
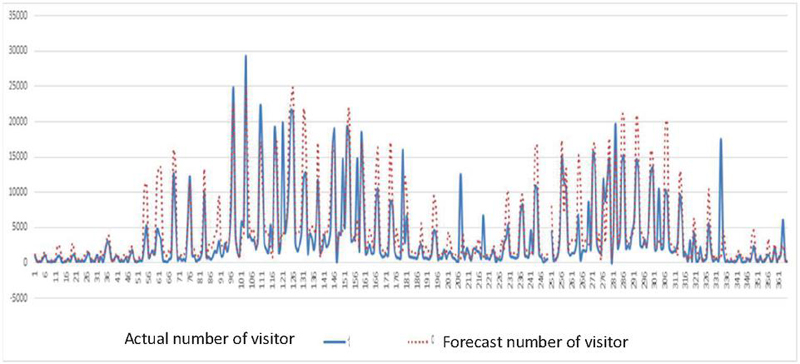
Figure 2 Predicted and actual numbers of visitors to Seoul Grand Park using AdaBoost (2019).
4 Discussion
This study verified the effectiveness of Seoul Grand Park in Korea by comparing the number of actual and predicted visitors in 2019 using a model trained with AdaBoost, a machine learning technique, to predict demand for theme parks. The analysis results reveal that abnormal cases with significant R deviations from the number of visitors per year were found on 30 days, while the rest were predicted relatively accurately with a similar distribution. Most days with abnormal cases had a large number of group visitors. From the perspective of a theme park operator, it is common to accept reservations in advance for group visitors so that numbers can be predicted, but predicting through machine learning is difficult. Learning about group audience prediction requires refinement with more data.
If the significant factors when fitting past data can be used to predict future numbers, the accuracy can be significantly improved [22]. However, it is possible to predict the actual number of visitors in actual operations by considering both the number of pre-booked group visitors and the number predicted by machine learning. Another reason for the abnormal cases was the weather variable; it is necessary to increase the sophistication of predictions by setting ranges for wind speed, average relative humidity, and fine dust concentration and assigning weights when certain thresholds are exceeded. For 22 September (Sunday), with a maximum wind speed of 6.4 m/s, the figure recognized by machine learning was slightly higher than that on other days. However, it is thought that outdoor activities were difficult for citizens due to the typhoon’s sphere of influence. Furthermore, accuracy will be increased for the average relative humidity if a section of a certain standard – such as fine dust concentration – is set and machine learning is used to generate more precise predictions in similar weather conditions.
Another external variable to consider is new events. Festivals of a specific season at a theme park and the emergence of new animal families attract many more visitors than the weather or day of the week variables, so variables for this are necessary. Moreover, underfitting occurred in this case [23]. One of the unusual cases was Labor Day on 1 May (Wednesday), which was not officially a public holiday, so the number of visitors was significantly higher than that predicted through machine learning. Therefore, from the operator’s perspective, this should be considered in advance when predicting visitors.
The days without extrinsic variables had high accuracy in machine learning with only the characteristics of the weather and the day of the week. However, because a machine only recognizes provided data values, it cannot recognize the detailed meaning behind various numerical values or external variables. An operator must consider these aspects and improve the accuracy through data refinement. Accordingly, it is expected that more visitors will be able to come in through planning events to be held according to the expected size of the annual influx of visitors and establishing marketing strategies. Furthermore, it is expected that it will reduce unnecessary costs in annual budget planning and help improve management efficiency.
5 Conclusion
This study proposes an efficient machine learning model based on five years of data encompassing the characteristics of weather and day of the week for Seoul Grand Park – a representative theme park in Korea – to establish an efficient management policy for theme parks to increase its utility as basic data. Accordingly, based on the AdaBoost model, which reflects the characteristics of the weather and the day of the week, visitor trends were learned and the accuracy was analyzed by comparing the numbers of recent actual and predicted visitors.
Using the AdaBoost model to predict visitor demand for a theme park can enhance operational efficiency in various aspects such as efficient resource allocation, marketing strategy formulation, risk management, and market analysis. This allows theme park operators to improve operational efficiency, enhance customer satisfaction, and make more accurate financial forecasts.
In contrast, it seems necessary to learn from the available data for follow-up research because the sophistication of analyzing more data increases due to the nature of machine learning. Furthermore, it is necessary to invest in building the most appropriate model by applying various models to determine the influx of visitors, similar to a theme park, and through case analysis. Designs for deep learning, the next stage of machine learning, should be considered.
Acknowledgments
Funding for this paper was provided by Namseoul University.
References
[1] Lukas, S. A.: Theme park. London: Reaktion Books Ltd., 2008.
[2] Aecom(2017). http://www.aecom.com/.
[3] Tasci, A. D. A., and Milman, A.: Exploring experiential consumption dimensions in the theme park context. Current Issues in Tourism, 22(7), 853–876, 2019.
[4] Jun, W., Yuyan, L., Lingyu, T., and Peng, G.: Modeling a combined forecast algorithm based on sequence patterns and near characteristics: An application for tourism demand forecasting. Chaos, Solitons & Fractals, 108, 136–147, 2018.
[5] Lim, C., and McAleer, M.: Time series forecasts of international travel demand for Australia. Tourism Management, 23(4), 389–396, 2002.
[6] Hewamalage, H., Bergmeir, C., and Bandara, K.: Recurrent neural networks for time series forecasting: Current status and future directions. International Journal of Forecasting, 37(1), 388–427. 2021.
[7] Chen, K., and Wang, C.: Support vector regression with genetic algorithms in forecasting tourism demand. Tourism Management, 28, 215–226, 2007.
[8] Heerschap, N., Ortega, S., Priem, A., and Offermans, M.: Innovation of tourism statistics through the use of new big data sources. In 12th Global Forum on Tourism Statistics, Prague, CZ. 2014.
[9] Von Kirby, P., Gerardo, B. D., and Medina, R. P.: Implementing enhanced AdaBoost algorithm for sales classification and prediction. International Journal of Trade, Economics and Finance, 8(6), 270–273, 2017.
[10] Bernardie, S., Desramaut, N., Male, J. P., Gourlay, M., and Grandjean, G.: Prediction of changes in landslide rates induced by rainfall. Landslides, 12, 481–494, 2015.
[11] https://www.data.go.kr.
[13] Freund, Y., and Schapire, R. E.: A decision-theoretic generalization of on-line learning and an application to boosting. Journal of Computer System Science, 55, 119–139, 1997.
[14] Schapire, R. E., and Singer, Y.: Improved boosting algorithms using confidence-rated predictions. Machine learning, 37(3), 297–336, 1999.
[15] Schapire, R. E.: Explaining AdaBoost. In Empirical inference, 37–52, 2013.
[16] Viola, P., and Jones, M.: Robust real-time object detection. International Journal of Computer Vision, 4, 34–47, 2001.
[17] Viola, P., and Jones, M.: Robust real-time object detection. International Journal of Computer Vision, 4, 34–47, 2001.
[18] Raul, R.: AdaBoost and the super bowl of classifiers: A tutorial introduction to adaptive boosting. Freie University, Berlin Technical Report, 1–6, 2009.
[19] Rathord, P., Jain, A., and Agrawal, C.: A comprehensive review on online news popularity prediction using machine learning approach. International Journal Online of Science, 5(1), 1–8, 2019.
[20] Dangeti, P.: Statistics for machine learning. Birmingham, UK: Packt Publishing Ltd., 2017.
[21] Bartlett, P., and Traskin, M.: Adaboost is consistent. Journal of Machine Learning Research, 8, 2347–2368, 2007.
[22] Freund, Y., and Schapire, R. E.: A decision-theoretic generalization of on-line learning and an application to boosting. Journal of Computer System Science, 55, 119–139, 1997.
[23] Gomez, H., and Kavzoglu, T.: Assessment of shallow landslide susceptibility using artificial neural networks in Jabonosa River Basin, Venezuela. Engineering Geology, 78(1), 11–27, 2005.
[24] Ray, S.: Quick Introduction to Boosting Algorithms in Machine Learning. Quick Guide to Boosting Algorithms in Machine Learning, https://www.analyticavidhya.com/blog/2015/11/quick-introduction-boosting-algorithms-machine-learning/ (Sep. 25, 2019), 2015.
[25] Haussler, D., and Warmuth, M. (2018). The probably approximately correct (PAC) and other learning models. The Mathematics of Generalization, 17–36.
[26] Hastie, T., Tibshirani, R., Friedman, J. H., and Friedman, J. H. (2009). The elements of statistical learning: data mining, inference, and prediction (Vol. 2, pp. 1–758). New York: springer.
Biographies

Jinkook Kim received his Master’s degree in Physical Education from Korea University in 2008 and his Ph.D. in Physical Education from Korea University in 2012. He is currently working as a research fellow at the Korea Institute of Sport Science in South Korea. His research areas include sports AI, sport convergence, sports industry, and sports marketing strategy formulation. He has also served as a reviewer for many prestigious journals.

Soohyun Kim received his Ph.D. in Philosophy in Sport and Leisure Studies from Yonsei University in 2007. Dr. Kim joined the Sport & Healthcare department at Namseoul University in 2008. His research interests include sport management and sport convergence.
Journal of Web Engineering, Vol. 23_6, 869–884.
doi: 10.13052/jwe1540-9589.2368
© 2024 River Publishers