Prediction and Performance Optimization of Hospital Web Application Access Modes Based on Big Data Analysis
Xiaoye Zhang and Sen Wang*
Information Center, Shanxi Bethune Hospital, Taiyuan Shanxi, 030032, China
E-mail: xiaobaga2024520@163.com
*Corresponding Author
Received 12 April 2025; Accepted 26 May 2025
Abstract
Data in hospital information systems contain errors, inconsistencies, and other issues that mask the true underlying patterns in the data, making the existing time series patterns blurry and leading to increased prediction errors in access patterns. To this end, research is being conducted on the prediction and performance optimization of hospital web application access patterns based on big data analysis. Firstly, semi-structured log data and structured information data from hospital web applications are collected and preprocessed. Then, a deep belief network (DBN) is used for feature extraction, and a deep learning model consisting of a stacked restricted Boltzmann machine (RBM) and a BP neural network is utilized to automatically extract multidimensional information such as user behavior features, temporal features, and page features, constructing a comprehensive feature system. Finally, based on the gated recurrent unit (GRU) neural network for access mode prediction, the control information selection mechanism of GRU is utilized to capture time series information and improve the accuracy of prediction. The experimental results show that the proposed prediction method has a practical application value with a mean square error of 0–50 for predicting traffic and a response rate within 5 seconds after application.
Keywords: Big data analysis, hospital web application, access mode prediction, performance optimization, gate controlled cycle unit.
1 Introduction
In the wave of digital healthcare transformation, hospital web applications are gradually becoming an important link between patients and medical services, and their strategic position and role are becoming increasingly significant. Hospital web applications, such as online registration systems, electronic medical record query platforms, and remote diagnosis and treatment services, carry high-frequency and complex access requirements. They have high concurrency and dynamic fluctuations, and the daily visit volume may increase several times or even tens of times due to the impact of outpatient time, seasonal disease outbreaks (such as influenza season), or sudden public health events (such as epidemics). Moreover, medical data involves patient privacy and requires strict compliance with regulations such as HIPAA and GDPR, which place extremely high demands on system security, data transmission encryption, and access control [2, 3]. At the same time, doctors, patients, and administrators need access through multiple terminals such as PCs and mobile devices, and the system needs to be compatible with different browsers, operating systems, and network environments. In this context, how to accurately predict the access patterns of hospital web applications and optimize their performance based on them has become key to ensuring service quality and user experience.
Many experts and scholars have conducted research on this topic. For example, Zhang et al. [4] proposed a cluster driven compact LSTM model that effectively groups applications through clusters and trains a compact meta-LSTM model for each cluster, enabling rapid adaptation to various applications. However, the accuracy of clustering methods directly affects the training effectiveness and prediction accuracy of meta-LSTM models. If the clustering is not accurate, this may result in the model being unable to effectively adapt to certain applications in the cluster, thereby affecting prediction performance. Razilov et al. [5] proposed the access interval prediction (AIP) technique. AIP technology draws on the idea of branch prediction, predicting the next memory access cycle by analyzing program flow patterns, thereby improving the hardware efficiency and software flexibility of embedded systems, while alleviating performance degradation caused by memory sharing. Nevertheless, the access interval predictor demands storage space to maintain historical access data and prediction states, potentially raising system costs. This issue is especially critical in embedded systems, where storage is typically constrained, requiring a trade-off between predictor efficiency and storage usage. Zhao et al. [6] developed a multi-layer driven framework and corresponding algorithms to resolve resource allocation issues in URLLC systems employing unauthorized (GF) access. This framework includes three layers: network load learning, network load prediction, and adaptive resource allocation. The initial layer processes the random access resource status of resource blocks and time slots, the subsequent layer predicts network load using the results from the first layer, and finally, in the third layer, the base station dynamically allocates resources based on the predicted results and user QoS requirements. This method improves resource utilization efficiency and effectively enhances QoS for different URLLC services by introducing K-repeated unauthorized (GF) access. However, due to the influence of multiple factors and rapid changes in network load, predictive models may not be able to maintain high accuracy in all situations. Prediction errors may lead to improper resource allocation, thereby affecting the performance and QoS of URLLC services.
To address the issues with the aforementioned methods, a method for predicting and optimizing the access patterns of hospital web applications based on big data analysis is proposed. By collecting and analyzing massive user access data, it is possible to deeply explore the patterns and trends behind user behavior, thereby achieving accurate prediction of access patterns. These predicted results can not only provide scientific basis for performance optimization strategies such as system resource allocation and load balancing, but also help hospitals better understand user needs and improve user experience.
2 Prediction of Access Modes and Performance Optimization Design for Hospital Web Applications
2.1 Hospital Web Application Access Data Collection and Preprocessing Based on Big Data Analysis
Before predicting the access mode and optimizing the performance of hospital web applications, it is necessary to collect a large amount of hospital web application access data [7]. These data sources are diverse, including users’ login time, visited pages, operation records, etc. To ensure the comprehensiveness of the data, multiple data collection methods are adopted. There are currently two main types of hospital web applications that access data: semi-structured log data generated by web applications and structured information data stored in various relational database tables [8]. Therefore, this article conducts the targeted collection of two types of data.
2.1.1 Collection scheme for log data
The access data of hospital web applications currently derives primarily from application-generated logs, necessitating explicit enablement of logging functionality prior to collection. Our data acquisition architecture [9] therefore employs a log-centric approach implemented via the Flume framework. Originally developed by Cloudera for massive-scale log aggregation and transportation, Flume has since been adopted as an Apache incubation project under the designation Flume NG. It has high scalability, high availability, and high reliability, and supports uploading logs to HDFS. Through configuration files, Flume can specify the roles of data sender and receiver, plan data transmission paths, and provide customized operation interfaces for data processing and filtering. The Flume framework consists of an agent component responsible for data collection and a collection component responsible for data aggregation, where each component integrates three major modules: source, channel, and sink. The source module is responsible for specifying and processing diverse data sources, supporting single or multiple source inputs. The channel module serves as a cache, temporarily storing data sent by the source, which can be stored in memory or in file form, and supports data distribution to one or more receiving channels. As the final data receiver, the sink module can save data to the local file system, write it to the distributed file system through HDFS API, or pass it to the next agent. By flexibly configuring these modules, the Flume framework can not only ensure high throughput and stability in the data collection process but also install proxy log collection agents on business system service host nodes, deploy data collection nodes, and effectively complete the task of collecting large amounts of data [10]. The workflow for collecting hospital web application logs is shown in Figure 1.
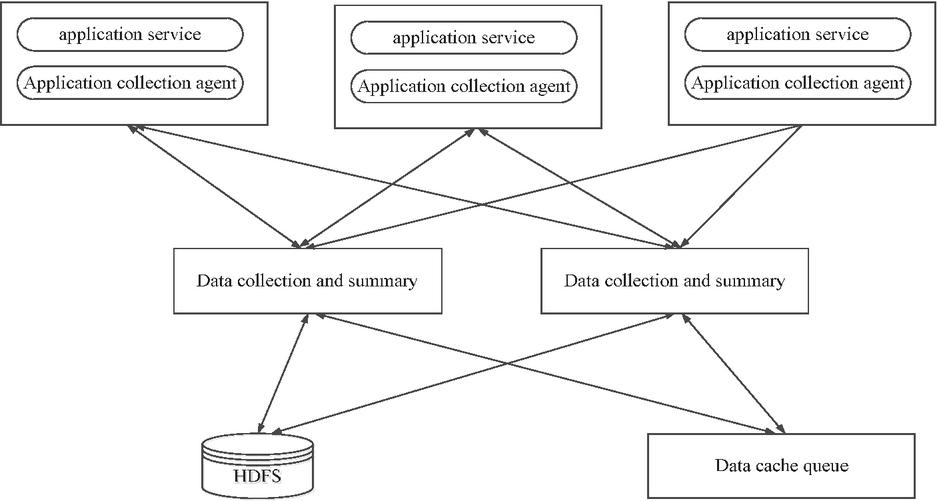
Figure 1 Data collection process for a hospital web application log.
2.1.2 Collection scheme for structured data
Structured data mainly refers to information data stored in various business database tables. For structured table data, automatic data pulling is mainly used to collect it, and then it is automatically imported into Hbase through the data collection module at regular intervals. By utilizing the dynamic column addition feature of HBase, the column descriptions of the original structured table are used as HBase columns and dynamically inserted [11]. Key value design is based on the combination of user ID, time, and task ID to form a row key. This collection module includes a business management layer, which includes functions such as database connection management, SQL tag saving, and data view browsing. The main steps of data collection are as follows. First, configure the information of various business databases connected to the hospital, including database accounts, passwords, and types. Then, according to the hospital’s business analysis requirements, analysts write relevant information for SQL analysis statements, including functional descriptions, SQL primitives, and other related information. After the user saves the information, the system verifies whether the SQL statement is error free and generates a data collection task. The data connection information and database type are submitted to the data collection module, which pulls the data to the HBase database based on the submitted information. Finally, the user can retrieve the data from HBase based on the data collection task information for further analysis [12]. The process of data collection architecture is shown in Figure 2.
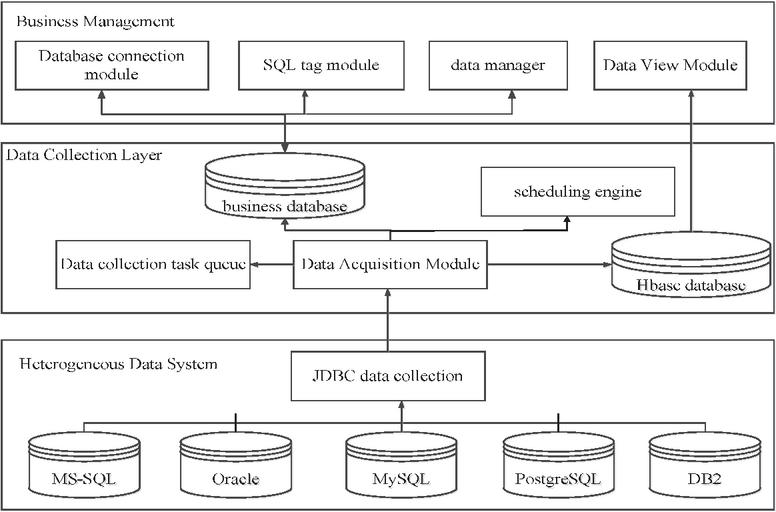
Figure 2 Structured data collection process.
The data collected based on the above process contains a large amount of patient information, medical records, examination reports, and other data from different departments, departments, or systems, which may have issues such as data errors and inconsistencies. The steps for data preprocessing are as follows:
(1) Data organization stage: Classify different log data based on the obtained data feature categories through regular expressions, including user access IP address, access time zone, request URL and HTTP protocol, HTTP status, file body content size, source page link, Mozilla rendering engine compatibility, user system information, browser version, etc.
(2) Data cleaning stage: Remove redundant and invalid information, such as invalid links, crawler information, and incorrect access information, only retaining data features that are useful for model construction, and reduce the number of invalid data rows vertically. Using behavior sequences for anomaly detection, calculate the joint probability density of request frequency and page dwell time :
| (1) |
If , it is judged to be a crawler. Based on this, the number of rows after cleaning is:
| (2) |
In the formula, represents the number of original data rows, and represents the number of invalid data rows.
(3) Data selection stage: Based on experimental requirements, select key data features such as retained user IP, access time, and request URL from data categories, and use heuristic rules to uniquely identify users using IP addresses, filtering out users who access specific campus websites. Heuristic rules refer to rules designed based on experience, domain knowledge, or simple logic used for making reasonable inferences in situations where data is incomplete or fuzzy. Specific rules may include the following: (i) IP address uniqueness rule: If the same IP address accesses a specific campus website multiple times within a short period of time (1 hour), it is considered as the same user. If the same IP address is accessed during different time periods but with similar access patterns (same device type, browser type), it is classified as the same user. (ii) Access time window rule: If the same IP address accesses multiple URLs within 5 minutes, it is considered to be the same session. If the interval between two visits exceeds 30 minutes, it is considered to be a new session. (iii) Access URL pattern rule: Rule description: If the URL accessed by the same IP address contains a specific hospital website path, it is considered to be the target user. If accessing public resources, it is considered a crawler or irrelevant access and can be filtered out.
(4) Data processing stage: Perform region conversion on IP addresses in valid session records to improve preprocessing efficiency and address conversion accuracy, and store the data in a unified format in the database. At the same time, the Z-score is used to standardize the collected data, and the formula is:
| (3) |
In the formula, and represent the mean and standard deviation of the original data, and represents the standardized value of the th data point. The processed data will be normalized to the interval of .
Through this series of preprocessing steps, accurate and effective data support is provided for subsequent model construction and analysis.
2.2 Feature Extraction of Access Data Based on a Deep Belief Network
After preprocessing, the collected raw data effectively solves problems such as data errors and inconsistencies. However, there are still some complex and disordered phenomena. Deep belief networks (DBNs) can automatically extract features. They consist of multiple restricted Boltzmann machines (RBMs) and a layer of BP neural networks stacked together, which can effectively extract multidimensional information such as user behavior features, temporal features, and page features from complex data, build a comprehensive functional system, make data patterns easier to understand, and provide strong support for subsequent access pattern prediction [13].
A deep belief network is composed of multiple restricted Boltzmann machines (RBM) stacked together [14, 15]. The RBM network is structured with two layers: the visible layer (V), responsible for data input, and the hidden layer (H), which captures feature representations. Each node in the network randomly adopts values of 0 or 1, and the overall structure forms a bipartite graph [16]. Refer to Figure 3 for a visual depiction of the RBM architecture.
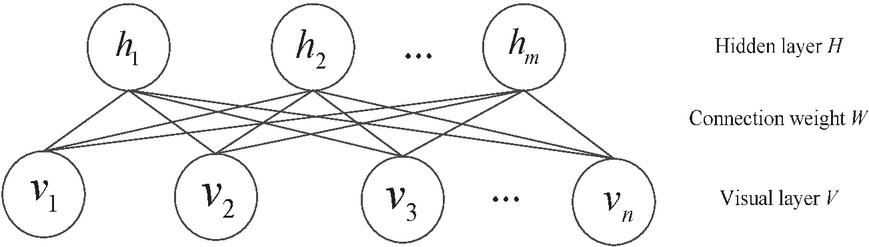
Figure 3 RBM network structure diagram.
As illustrated in Figure 3, the RBM network includes a visible layer vector ( nodes) and a hidden layer vector ( nodes). Notably, nodes within the same layer are not connected, whereas nodes across layers are fully linked. The weights of these inter-layer connections are denoted by [17]. Based on thermodynamic energy functions, RBM model training can achieve parameter learning by calculating the probability distributions of visible and hidden layers.
Define as the state value of the th node in the visible layer, the visible layer vector can be represented as , signifies the state value of the th neuron in the hidden layer, and the hidden layer vector is given by . The bias vectors for the visible and hidden layers are and , respectively, and is the connection weight between visible node and hidden node . The energy function for the visible layer and hidden layer is:
| (4) |
In the formula, represents the target parameter for learning the RBM network structure. When the values of parameters , , and are determined, calculate the joint probability distribution of using the following formula:
| (5) |
In the formula, represents the normalization factor, and . From this, the distribution of the visual layer vector can be calculated as the marginal probability distribution of :
| (6) |
From Equation (4), it can be seen that to calculate the edge probability distribution of visible layer , the first step is to calculate , which requires calculations and is quite complex. By exploiting the RBM network’s fully connected inter-layer and unconnected intra-layer structure, the state values of hidden layer nodes are conditionally independent given the visible layer nodes. Thus, the conditional probability distribution of the th hidden layer unit can be derived:
| (7) |
In the equation, represents an S-shaped activation function. Due to the symmetrical structure of the RBM, while determining the hidden layer node values, the visible layer nodes remain independent. This enables the calculation of the conditional probability distribution for the th visible layer unit:
| (8) |
Through the energy function calculation, the RBM model can be expressed as the product of conditional probability distributions for each node, facilitating the training process. The contrastive divergence (CD) algorithm is utilized to train the RBM, optimizing weights and biases by minimizing reconstruction errors. This enables the hidden layer to learn feature representations of the visible layer data [18]. Using formula (8), the state values of the visible and hidden layers are derived, and parameter optimization is achieved through the update formula, as follows:
| (9) | |
| (10) | |
| (11) |
Iterate the above steps to calculate the distribution of all data samples. Through multiple calculations, the full input data distribution is derived, and parameters are optimized to minimize the energy function. Multiple RBM networks are stacked to construct the DBN hidden layers, with each RBM output feeding into the next. Unlike single-hidden-layer networks, multiple layers allow sequential training, reducing the risk of local optima [19]. A BP neural network is often added at the final layer for parameter refinement, achieving the target prediction or classification task. Consequently, DBN models typically include several RBM layers and one BP layer. The structure of the deep belief network (DBN) is depicted in Figure 4.
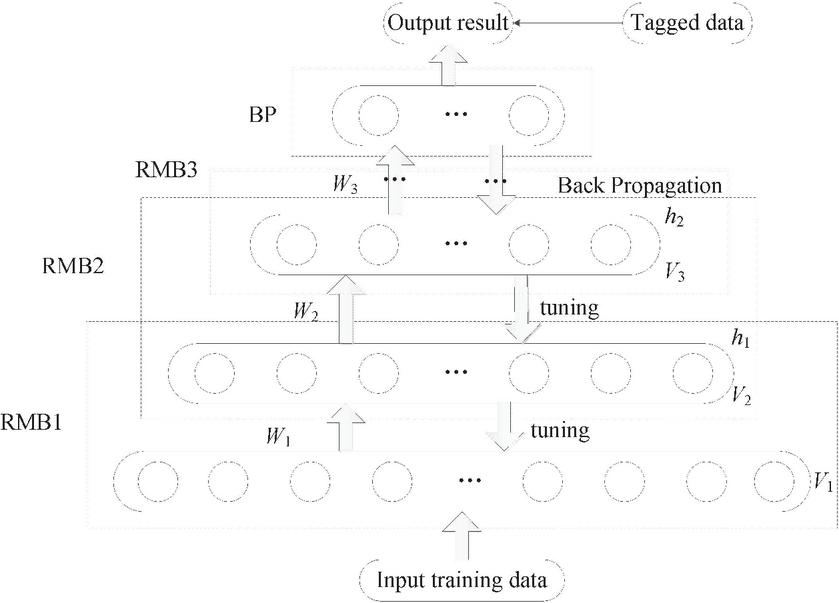
Figure 4 Deep belief network (DBN) structure diagram.
The DBN model training process mainly includes two main parts, one is to unsupervised train the RBM network layer by layer according to the above steps. Another approach is to use a BP neural network for supervised parameter tuning [20]. The specific process is as follows:
(1) Unsupervised training of RBM network layer by layer
Step 1: Train the first layer RBM network using unsupervised methods according to the above method. At this point, initialize the DBN model parameters including connection weights and bias values, and complete the feature extraction of the initial input sample data.
Step 2: The training process adopts a greedy layer by layer algorithm. The first step is to extract the lowest level features and use the output data features as input to continue training the second layer according to the method of the first step and continue using them as the output of the next layer until the training of the last RBM network is completed. Complete pre-training to obtain parameter values.
(2) Supervise parameter fine-tuning
Like other networks, the parameter values obtained through pre training need to be fine-tuned to achieve optimal values for each layer. The parameter fine-tuning adopts a supervised approach, adding BP network layers to the top layer of the trained multiple RBM model structure, and using a backpropagation algorithm to propagate errors layer by layer from the top layer to adjust the parameter values of each RBM network layer. The added BP neural network layer is not only for parameter tuning, but for classifying the data training results of the previous multiple RBM models.
Complete the feature extraction of hospital web application access data through the above process, as shown in Figure 5.
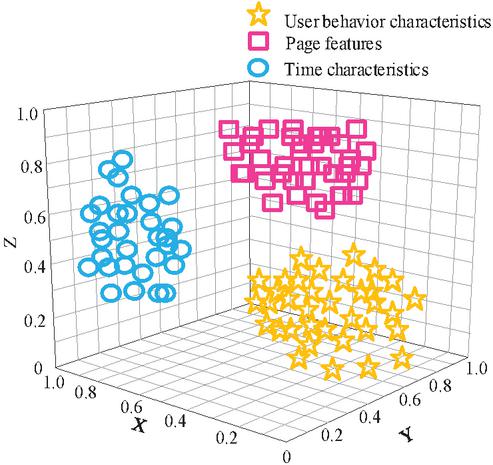
Figure 5 Feature extraction results.
According to the above figure, it can be seen that the deep belief network (DBN) can effectively extract multidimensional information such as user behavior characteristics, time characteristics, and page characteristics, providing basic information data for subsequent access pattern prediction.
2.3 Prediction of Access Modes for Hospital Web Applications Based on Gated Recurrent Unit Neural Networks
Accurately predicting the access patterns of hospital web applications is crucial for optimizing server resource allocation and improving application performance. After extracting features, use a gated recurrent unit (GRU) neural network for access pattern prediction. A deep belief network (DBN) is a deep learning architecture based on probabilistic graph models, whose core principle is to extract high-level features from complex data layer by layer by simulating the inherent distribution patterns of the data. A DBN is composed of multiple layers of restricted Boltzmann machines (RBMs) stacked together, with each layer capturing local patterns of data through unsupervised learning, and then passing the learned features to the next layer for higher-level abstraction [21, 22]. This hierarchical training method enables DBN to automatically mine multi-dimensional information such as user behavior characteristics, temporal patterns, and page access patterns from raw data. The structural design of DBN embodies the idea of hierarchical feature extraction from concrete to abstract. Its input layer is responsible for receiving raw data, such as access logs of hospital web applications. Subsequently, multi-layer RBM gradually combines low-level features into high-level features through greedy training layer by layer. The hidden layer output of each RBM layer serves as the input for the next layer, forming a deep feature representation. Finally, a backpropagation (BP) neural network is added at the top level to perform supervised fine-tuning of global parameters, making feature extraction more tailored to specific task requirements, such as traffic prediction or user classification. In the context of medical informatization, DBN has demonstrated significant application value. Firstly, it can automate the processing of high-dimensional sparse hospital web log data and efficiently extract user behavior features. Secondly, DBN excels at capturing time series patterns, such as daily fluctuations in registration volume or delayed features of inspection report queries, providing data-driven decision support for resource scheduling. In addition, a DBN can integrate heterogeneous data from multiple sources (such as logs, database records, and user behavior monitoring data), build a unified feature space, and support cross module analysis tasks. The combination of hierarchical feature extraction and global optimization makes DBN a powerful tool for modeling complex data.
Like the LSTM model, which features three gates, the GRU neural network incorporates two control gates: the reset gate and the update gate. This streamlined design reflects GRU’s evolution from LSTM, suggesting that its two-gate structure is a simplification of LSTM’s three-gate mechanism [23]. The input–output structure of the neural unit is depicted in Figure 6.
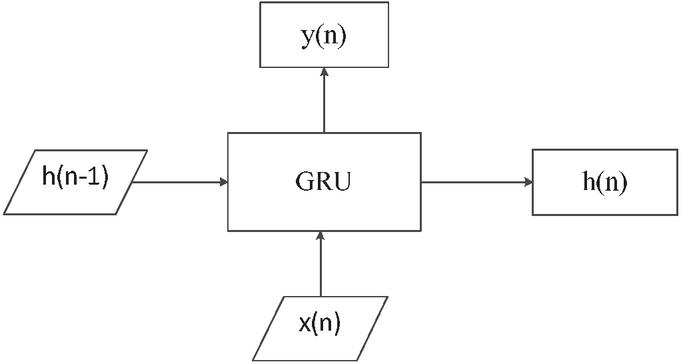
Figure 6 Input–output structure of the neural unit.
In Figure 6, symbolizes the information flow between neural units, stands for the input data, and indicates the output of the current neural unit. For the th neuron, represents its input, its output, and the information passed down from the previous neuron. The variable is used for indexing purposes. However, at every moment or in the final fully connected computation, is constantly updating itself, combining its inheritance and current alternative answers to update itself. represents the genetic information transmitted from one neural unit to the next. Inside the neural unit, the inherited information is processed and computed. These units are then connected in series, creating an intricate network where each unit is directly or indirectly interconnected. Within each neural unit, there is the same internal structure as shown in Figure 7. Among them, updating and resetting the two control gates are the most important structural components.
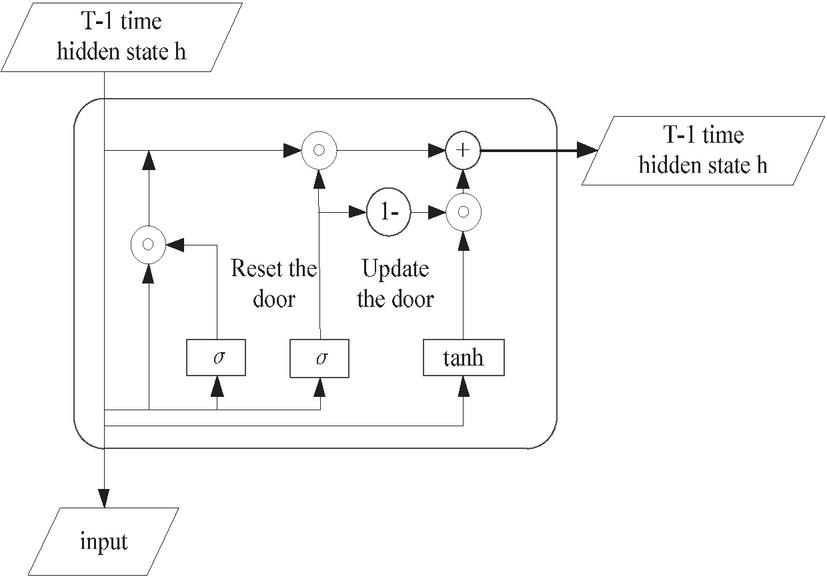
Figure 7 Internal control gate structure of a GRU.
According to the GRU internal control gate structure shown in Figure 7, we can predict the access mode of hospital web applications. The specific process is as follows:
Update gate: Represented by , the update gate in the GRU at time determines the proportion of information transferred to the next neural unit. As nears 1, approximates , implying that the received information is passed directly to the next unit without modification or loss [24]. In contrast, when approaches 0, differs from , suggesting that the received information is mostly discarded through computational processing and not propagated further. The update gate’s operation is described by:
| (12) |
In Equation (12), represents the Sigmoid function, and represents the update gate weight corresponding to when solving . represents the current input information.
Reset gate: Let represent the reset gate at the current time , determine the impact of on , when is approximately equal to 0, will not pass on information to , and when is approximately equal to 1, will pass on information to . The reset door is expressed as:
| (13) |
In the formula, represents the reset gate weight corresponding to when solving .
New memory: The update gate controls the proportion of prior time step information used to evaluate the current time step’s outcome. represents the comprehensive calculation result of the current input information and the transmission information of the previous hidden layer, which includes the new input information and the previous information [25]. The expression for the new memory process is:
| (14) |
Hidden layer: The GRU’s hidden state at the current time step is computed based on the previous time steps and , where governs the weighting between the two. The process of information transmission and calculation is expressed as:
| (15) |
Result output: After determining at the current time, the output work of this neural unit can be completed. After calculation, the final data can be obtained. The expression of the result output process is as follows:
| (16) |
In the prediction process, the extracted features are used as inputs, and the trained model outputs key information such as future traffic, peak traffic periods, and popular pages. These predicted results can provide scientific basis for performance optimization strategies such as system resource allocation and load balancing [26].
3 Experimental Design
3.1 Experimental Plan
To evaluate the real-world applicability of the hospital web application access mode prediction and performance optimization method based on big data analysis introduced in this paper, experimental tests were carried out. The experimental setup includes:
(1) Experimental platform and environment
A simulation platform and environment were configured to replicate actual hospital web application conditions, ensuring the reliability and practicality of the experimental outcomes. The configuration of the experimental environment includes high-performance hardware, adaptive software, professional development tools, and stable networks, as shown in Table 1.
Table 1 Experimental operation platform and environment
| Operating Platform | Operating System | Windows7 Ultimate |
| System memory | 64 GB | |
| Dual core main frequency | 2.5 GHz | |
| Processor | Intel Core i5-4200 | |
| Operating environment | Programming language | Python |
| Deep learning framework | TensorFlow 2.8.0 | |
| Cloud environment configuration | 8-core 16 thread CPU; 16 GB memory; 200 GB storage space. |
(2) Experimental subjects and experimental data
This experiment focuses on the web application of a large hospital as the research object. This application covers multiple core business modules of the hospital, including registration and appointment, examination and testing report query, online payment, doctor–patient communication, and other functions. It is used by a large number of patients and medical staff every day and has typical characteristics of hospital web applications, which can fully reflect the access patterns and performance issues in actual application scenarios. The collection period is from 1 March 2024 to 31 May 2024 (a total of 92 days), with an average daily data volume of approximately 4.2 GB (logs), 1.1 GB (databases), and 680 MB (behavioral data). The total number of records is approximately 1.27 billion (logs), 320 million (database operations), and 840 million (behavioral events).
The experimental data mainly comes from the server logs, database operation records, and user behavior monitoring system of the hospital’s web application. The server log records in detail the time, URL, IP address, and request parameters of each user’s request. The database operation records include various business operations performed by users in the application, such as appointment time, department, doctor information, and query records of examination and testing reports. The user behavior monitoring system collects user interaction behavior data on the page, such as clicks, scrolling, dwell time, etc. In order to obtain sufficiently rich and representative data, access data was collected for three consecutive months. This time span covers weekdays, weekends, and different seasons, which can fully reflect the access situation of hospital web applications in different time periods and business scenarios. Partial experimental data are shown in Table 2.
Table 2 Partial experimental data
| Time Stamp | User ID | Page Path | Stay Time/s | Device Type |
| 2023-05-05 08:30:00 | U21345 | /login | 90 | Mobile |
| 2023-05-05 08:32:00 | U54637 | /schedule | 120 | Desktop |
| 2023-05-05 09:00:00 | U54637 | /lab/results | 45 | Mobile |
| 2023-05-05 10:02:00 | U67390 | /patient_profile | 180 | Mobile |
| 2023-05-05 14:05:00 | U29456 | /hospital_guide | 30 | Desktop |
| …… | …… | …… | …… | …… |
Perform data preprocessing using Section 2.2 for the above data.
(3) Model prediction
Goal: Predict future traffic and peak periods. The steps are as follows:
Sequence modeling: Input window: past 24-hour traffic (time step 15 minutes); GRU layer: 128 units, dropout 0.2;output layer: predict future 1-hour traffic volume (regression task).
Model training: Loss function: Huber loss (adversarial outlier); optimizer: RMSprop (lr 0.001); Batch size: 256, Epoch 100.
(4) Prediction result analysis
Through the above process, the practical application effect of the method proposed in this article in hospital scenarios can be systematically verified, providing a reproducible solution for the intelligent operation and maintenance of medical information systems.
3.2 Experimental Indicators
We selected the methods in [4, 5], and [6], and the proposed method as experimental comparison methods to verify the effectiveness of different methods by comparing their accuracy in predicting hospital web application traffic, mean square error, and optimized web application access response rate.
(1) Traffic prediction accuracy: This indicator evaluates how accurately different methods predict hospital web application traffic. It reflects the degree of agreement between predicted and actual traffic, demonstrating the method’s capability to identify traffic trends and variations.
(2) Traffic prediction mean square error (MSE): The MSE is a standard measure of prediction error, representing the average squared difference between predicted and true values. Larger MSE values suggest higher overall deviation and inferior prediction performance, whereas smaller values indicate better accuracy. The formula is as follows:
| (17) |
In the formula, represents the number of samples in the original dataset, represents the actual traffic of the th sample, and represents the predicted value of the th sample.
(3) Optimized web application access response rate: This indicator reflects the speed at which hospital web applications respond to user access requests after being optimized using different methods. A fast response rate can enhance user experience and reduce waiting time for users.
3.3 Experimental Results
(1) Accuracy of traffic prediction
The predicted results of hospital web application traffic under the four methods are shown in Table 3.
Table 3 Prediction results of hospital web application traffic under different methods of application
| Hospital web application visits/time | |||||
| Prediction | True | Proposed | Reference | Reference | Reference |
| Duration/h | Value | Method | [4] Method | [5] Method | [6] Method |
| 2 | 150 | 150 | 120 | 100 | 103 |
| 4 | 125 | 120 | 150 | 102 | 140 |
| 6 | 550 | 550 | 500 | 480 | 470 |
| 8 | 1000 | 1000 | 890 | 850 | 801 |
| 10 | 1334 | 1321 | 1209 | 1098 | 1128 |
| 12 | 1568 | 1561 | 1400 | 1345 | 1256 |
| 14 | 1609 | 1609 | 1500 | 1432 | 1370 |
| 16 | 1769 | 1771 | 1654 | 1540 | 1400 |
| 18 | 1800 | 1800 | 1727 | 1600 | 1576 |
According to Table 3, the results of using the proposed method to predict the traffic of hospital web applications are closer to the true values, while the methods in [4, 5], and [6] differ significantly from the actual traffic of hospital web applications, indicating that the proposed method has better prediction performance and can accurately predict the access patterns of hospital web applications.
(2) Mean square error of traffic prediction
The mean square error test results of traffic prediction under the four methods are shown in Figure 8.
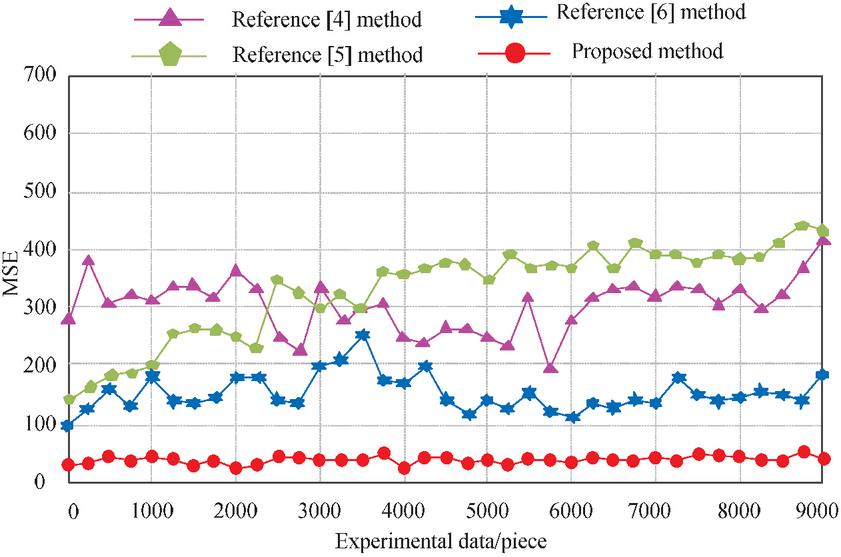
Figure 8 Mean square error of traffic prediction after applying the four methods.
According to Figure 8, the mean square error of traffic prediction after the application of the method in [4] is between 200 and 400, the mean square error of traffic prediction after the application of the method [5] is between 150 and 410, and the mean square error of traffic prediction after the application of the method in [6] is between 100 and 200. The mean square error of traffic prediction using the proposed method is between 0 and 50, consistently lower than the comparison method, indicating that the traffic prediction results of the proposed method are closer to the true values.
(3) Optimized web application access response rate
The comparison results of the access response rate of the optimized web application using the four methods are shown in Figure 9.
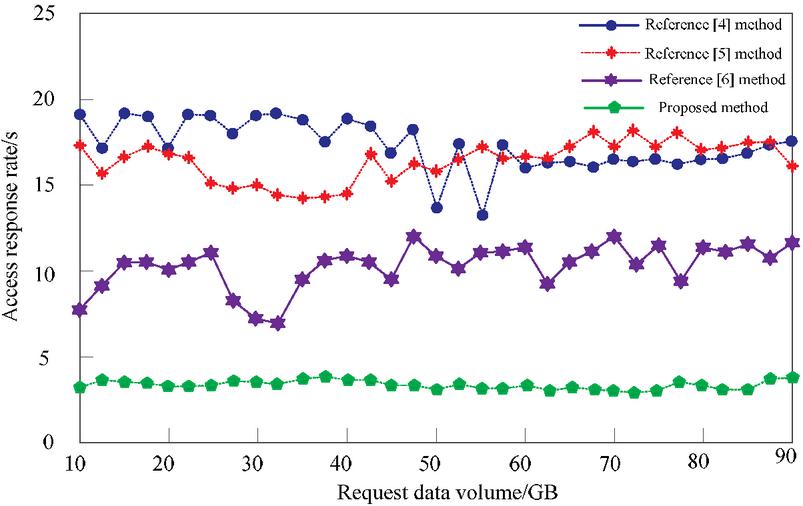
Figure 9 Optimized web application access response rate.
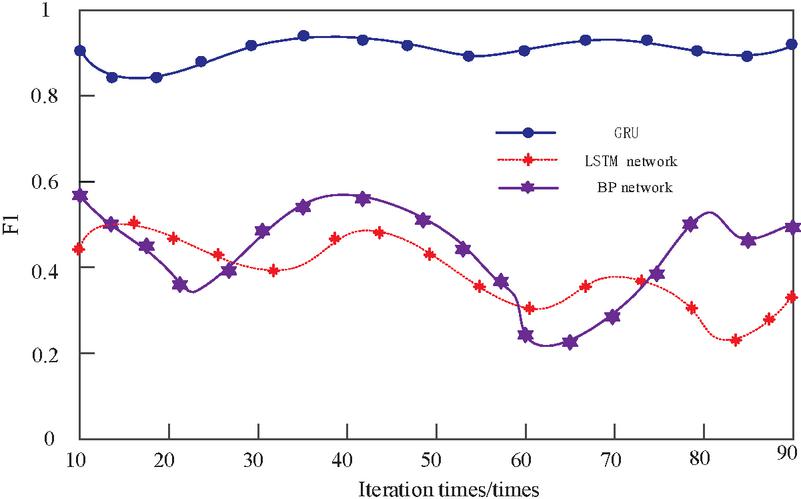
Figure 10 F1 value results.
From Figure 9, it can be seen that the proposed method predicts an optimized web application access response rate within 5 seconds, while the methods in [4, 5], and [6] predict optimized web application access response rates above 5 seconds. This indicates that the proposed method can accurately predict web application access patterns, and optimizing the application based on the prediction results can significantly improve user access rates and has practical application value.
(4) Predict the F1 value
To further verify the practicality of the core GRU technology in this article, the LSTM network and the BP network were selected as comparative methods for predicting F1 values. The results are shown in Figure 10.
From Figure 10, it can be seen that the F1 value using the proposed GRU technique is significantly higher than that of the comparison methods, reaching a maximum of 0.96, while the highest values for the comparison methods are only 0.51 and 0.58. This indicates that the GRU technique of the proposed method achieves a balance between high accuracy and high recall in prediction tasks. This means that the model can not only accurately identify real peak access periods and patterns but also minimize false positives to the greatest extent possible.
4 Conclusion
Through in-depth research on the access mode of hospital web applications, this paper proposes a prediction and performance optimization design method that combines big data analysis and machine learning technology. Firstly, by utilizing the Flume framework and automatic data retrieval solution, log data and structured data were effectively integrated, and the accuracy and availability of the data were ensured through data preprocessing steps. Subsequently, a deep belief network (DBN) was used for feature extraction, constructing a comprehensive feature system that provides a solid foundation for predicting access patterns. In the prediction stage, a gated recurrent unit (GRU) neural network was introduced to accurately predict access patterns by capturing time series information. Experimental results showed that the mean square error of access prediction using this method was between 0 and 50, consistently lower than the comparison method; The response rate of web application access is within 5 seconds. The F1 value is significantly higher than the comparison method, reaching a maximum of 0.96, indicating high application performance. Not only does it improve the operational efficiency of hospital web applications, but it also provides useful references for the development of medical informatization.
References
[1] Wu Bing. Research on WEB-based Hospital Management Information System[J]. Information Technology and Informatization, 2021(3):134–136.
[2] Zuo Haiwei, Liang Gang, Wang Lin, et al. Design and implementation of community hospital information system based on WEB technology[J]. Electronic technology and software engineering, 2021(21):174–176.
[3] Hu Hongyu. Application of cloud WAF in hospital critical Web services and API protection[J]. Network Security Technology & Application, 2024(9):137–139.
[4] Zhang P, Srivastava A, Wang T Y, et al. C-MemMAP: clustering-driven compact, adaptable, and generalizable meta-LSTM models for memory access prediction[J]. International Journal of Data Science and Analytics, 2022(1):13.
[5] Razilov V, Wittig R, Matú, Emil, et al. Access Interval Prediction by Partial Matching for Tightly Coupled Memory Systems[J]. International Journal of Parallel Programming, 2024, 52(1):1–17.
[6] Zhao Z, Du Q, Karagiannidis G K. Improved Grant-Free Access for URLLC via Multi-Tier-Driven Computing: Network-Load Learning, Prediction, and Resource Allocation[J]. IEEE Journal on Selected Areas in Communications, 2023, 41(3):607–622.
[7] Huang Lizhu, Jing Lin, Jiang Yanji, et al. Design and implementation of hospital scientific research file management system based on Web technology[J]. Medicine, 2023(1):26–29.
[8] Lv S, Yi F, He P, et al. QoS Prediction of Web Services Based on a Two-Level Heterogeneous Graph Attention Network[J]. IEEE Access, 2022(10):10.
[9] Cui Xiaotian, Zheng Yu, Min Qiang. Optimal Design of Hospital Human Resource Management Information System based on WEB and APP Technology[J]. Modern Hospital Management, 2021, 19(1):59–63.
[10] Canay Z, Kocabak M. An innovative data collection method to eliminate the preprocessing phase in web usage mining[J]. Engineering Science and Technology, an International Journal, 2023, 40.
[11] Zhu C, Liu Z, Zou B, et al. An HBase-Based Optimization Model for Distributed Medical Data Storage and Retrieval[J]. Electronics (2079-9292), 2023, 12(4).
[12] Nasrullah, Ahmad N, Sharma N, et al. A Study of Performance Evaluation and Comparison of NOSQL Databases Choosing for Big Data: HBase and Cassandra Using YCSB[J]. IOSR journal of computer engineering, 2023(3):25.
[13] Deepa S, Umamageswari A, Neelakandan S, et al. Deep Belief Network-Based User and Entity Behavior Analytics (UEBA) for Web Applications[J]. International Journal of Cooperative Information Systems, 2024, 33(2).
[14] Li X, Zhang Y, Li Y, et al. Study of E-business applications based on big data analysis in modern hospital health management[J]. Information Systems and e-Business Management, 2021, 19(2):621–640.
[15] Nivaashini M, Suganya E, Sountharrajan S, et al. FEDDBN-IDS: federated deep belief network-based wireless network intrusion detection system[J]. EURASIP Journal on Information Security, 2024, 4(1):5.
[16] Diao Yu, Xue Hong. Research on Electronic Resource User Churn Prediction:Taking Off-campus Access System of Electronic Resource as Example[J]. New Century Library, 2023(5):55–62.
[17] Koohi H, Kobti Z, Nazari Z, et al. Enhancing Recommender System performance through the fusion of Fuzzy C-Means, Restricted Boltzmann Machine, and Extreme Learning Machine[J]. Multimedia Tools & Applications, 2024, 83(23).
[18] Qiao C, Yang L, Shi H K Y. Deep belief networks with self-adaptive sparsity[J]. Applied Intelligence: The International Journal of Artificial Intelligence, Neural Networks, and Complex Problem-Solving Technologies, 2022, 52(1):237–253.
[19] Noonpakdee W. The Analysis of Big Data Architecture for Healthcare Service: Case Study of a Public Hospital[J]. International Journal of Management, Knowledge and Learning, 2022, 11:1–8.
[20] Shan Dibin, Du Xuehui, Wang Wenjuan, et al. Access control relationship prediction method based on GNN dual source learning[J]. Chinese Journal of Network and Information Security, 2022, 8(5):40–55.
[21] Viji D, Revathy S. A hybrid approach of Poisson distribution LDA with deep Siamese Bi-LSTM and GRU model for semantic similarity prediction for text data[J]. Multimedia Tools and Applications, 2023, 82(3):1–28.
[22] Cheng Zhenjing, Wang Lu, Cheng Yaodong, et al. File Access Popularity Prediction for Hierarchical Storage for High-Energy Physics[J]. Computer Engineering, 2021, 47(2):126–132.
[23] Liu Sujun, Yang Guoying, Ding Jiayu, et al. Traffic prediction method of Web server access based on the improved Prophet model[J]. Wireless Internet Science and Technology, 2024, 21(24):108–110.
[24] Zhao Hui. WEB User Access Behavior Prediction for Fusion of Knowledge Map Association Retrieval[J]. Computer Simulation, 2023, 40(10):496–500.
[25] Liu Jixiang. Prediction Technology of Different Kinds of Electronic Resources in Digital Library[J]. Techniques of Automation and Applications, 2023, 42(11):110–113.
[26] Yan Y, Zhao H, Qu H. A Browser Fingerprint Authentication Scheme Based on the Browser Cache Side-Channel Technology[J]. Electronics, 2024, 13(14):27–28.
Biographies

Xiaoye Zhang graduated from Taiyuan University of Technology of Electronic Information Engineering in 2006. She currently works at the Information Center of Shanxi Bethune Hospital. Her research interests are medical informatics and big data.

Sen Wang graduated from the Shanxi Agricultural University of Computer Science and Technology in 2011. He currently works at the Information Center of Shanxi Bethune Hospital. His research interests are medical informatics and medical integration engines.
Journal of Web Engineering, Vol. 24_5, 827–850.
doi: 10.13052/jwe1540-9589.2456
© 2025 River Publishers