A Web-based Framework for Spatiotemporal Integrity Verification of Dam Safety Monitoring Data
Cao Feng*, Li Xiaowei and Han Jishuang
Engineering Construction Management Branch of China Southern Power Grid Peak shaving, Frequency Modulation Power Generation Co., Ltd, Guangzhou, 841000 China
E-mail: a15968377008@sina.com; lixiaowei@em.pgc.csg; 18090623568@163.com
*Corresponding Author
Received 21 May 2025; Accepted 28 June 2025
Abstract
Ensuring the completeness and accuracy of dam safety monitoring data is critical for structural health assessment and risk management. Traditional monitoring systems often lack mechanisms to systematically validate data integrity across time and space, resulting in missed anomalies and delayed interventions. This paper presents a web-based framework for spatiotemporal integrity verification tailored to dam safety applications. The framework combines rule-based validation logic, semantic metadata modeling, and interactive web visualization to automate the detection of missing values, inconsistent sampling, and logical violations. It supports real-time data ingestion, validation execution, and anomaly reporting through an intuitive web interface. A case study using publicly available dam datasets demonstrates the system’s effectiveness in identifying data gaps and improving operational awareness. Evaluation results confirm high accuracy in anomaly detection, efficient processing under load, and enhanced usability for engineering users. The proposed solution offers a scalable, extensible, and domain-aware platform for intelligent infrastructure monitoring.
Keywords: Web-based framework, spatiotemporal integrity verification, dam safety monitoring, infrastructure web systems, real-time data validation.
1 Introduction
Dam safety is of paramount importance in hydropower and pumped storage projects, where structural failures can lead to catastrophic losses of life, property, and infrastructure. In line with advances in smart infrastructure monitoring [1], the dam safety field increasingly demands intelligent monitoring systems capable of ensuring data quality and operational integrity. Monitoring data plays a pivotal role in understanding the behavior of dam components under varying environmental and operational conditions. These include measurements from sensors monitoring displacement, seepage, stress, temperature, and water levels. The use of spatiotemporal data enables dam engineers to track changes over time and space, identify emerging anomalies, and make informed decisions for maintenance and emergency response [2, 3].
However, the reliability of such risk assessments hinges on the completeness and accuracy of data collected from geographically distributed sensor nodes. Discrepancies in time synchronization, missing data points, or irregular spatial sampling often compromise decision-making, especially during critical conditions such as floods or seismic events [4, 5]. Thus, ensuring spatiotemporal data integrity is essential for proactive dam management.
Conventional dam monitoring systems typically employ wired and wireless sensor networks connected through supervisory control and data acquisition (SCADA) or data acquisition (DAQ) platforms. These systems collect a wide range of data including seepage flow, deformation, seismic activity, and reservoir levels, often stored locally or transmitted to central control centers [3, 6]. Data loggers and edge devices facilitate this process, and in some modern setups, basic analytics are performed on-site.
While these systems are effective in real-time data collection and storage, they lack robust, built-in mechanisms for validating data completeness, temporal consistency, and spatial coverage. In many cases, data verification is performed manually or post-hoc using spreadsheets or custom scripts, leading to delayed anomaly detection and missed early warnings [5, 7]. Spatiotemporal data integrity involves validating the presence, accuracy, and coherence of measurements across both spatial domains (e.g., sensor locations along the dam) and time domains (e.g., hourly or daily intervals). However, real-world data acquisition is frequently disrupted due to hardware faults, power failures, environmental interference, or network communication issues [8, 9]. Such disruptions result in gaps, redundancies, and out-of-sync measurements that degrade the reliability of the monitoring system. These anomalies are not always obvious during routine checks and may remain unnoticed until a failure event occurs. Moreover, the sheer scale and heterogeneity of dam monitoring datasets – involving different sensor types and data formats – further complicate manual validation efforts [6, 10, 11].
Recent advances in web technologies and the Internet of Things (IoT) have introduced new opportunities for infrastructure monitoring. Web-based systems now allow for real-time sensor data ingestion, cloud-based storage, interactive dashboards, and user access from multiple locations [1, 12]. These systems typically use web services and RESTful APIs to integrate data from field-deployed sensors, enabling dynamic visualizations and remote management. Despite these benefits, most existing web-based platforms focus on data visualization and user interaction rather than automatic integrity checks. While some include basic filtering or statistical functions, few are designed to assess spatiotemporal data validity using engineering-specific rules and logic [13, 14]. This limits their utility in mission-critical applications like dam safety, where timely detection of anomalies is essential. Although significant progress has been made in sensor integration, remote visualization, and cloud computing, there remains a clear research gap in the area of automated spatiotemporal data integrity verification within web-based dam monitoring systems. Existing platforms often lack domain-specific algorithms that validate time-aligned and spatially comprehensive sensor data in real time [10, 13, 15]. There is a pressing need for a solution that bridges civil engineering knowledge and modern web engineering techniques to ensure that collected data are not only accessible but are also trustworthy for decision-making. Such a solution would contribute significantly to risk-informed asset management in hydraulic infrastructure.
To bridge the identified research gap, this study introduces a web-integrated framework for validating the spatiotemporal integrity of dam safety monitoring data, tailored for deployment in hydropower and pumped storage infrastructures. The framework incorporates a comprehensive set of integrity verification rules derived from domain-specific engineering practices in geotechnical and hydraulic monitoring. It features a modular and scalable architecture that enables automated data ingestion, rule-based validation, and real-time anomaly visualization through an interactive web interface. A case study using representative dam monitoring datasets demonstrates the framework’s effectiveness in identifying temporal gaps, spatial incompleteness, and logical inconsistencies. These contributions collectively advance the integration of engineering logic into web-based monitoring systems, providing a robust and responsive solution for intelligent dam safety management.
2 System Architecture
The proposed web-based framework for spatiotemporal integrity verification adopts a modular and extensible design to ensure scalability, interoperability, and real-time performance. It comprises three functional layers: data acquisition and preprocessing, validation logic, and user-facing interaction. This architecture supports integration with existing dam monitoring infrastructures and enables future extensions such as AI-driven analytics and mobile accessibility.
2.1 Data Acquisition and Preprocessing Layer
This layer encompasses the data ingestion and preprocessing functionalities. The system retrieves data from diverse sources including local sensors, IoT gateways, and historical databases. It supports real-time streaming via MQTT/HTTP protocols as well as batch uploads in CSV or JSON formats. Sensor metadata – such as device ID, location, type, and expected sampling interval – are registered in a central configuration database. To ensure robustness against transmission failures, buffering and retry policies are applied. All incoming data are timestamped and stored with provenance information for traceability.
Once ingested, raw sensor data undergo standardized preprocessing. This includes timestamp alignment (e.g., correcting for drift and converting to UTC), unit normalization, and signal denoising using filters or outlier detection algorithms tailored to sensor types. If data gaps are found, imputation techniques such as linear or spline interpolation are applied, with imputed values clearly flagged to differentiate them from original data.
2.2 Validation Engine
The core of the framework is a rule-based engine that applies spatiotemporal integrity checks to the preprocessed data. These validation rules are defined by engineers and encoded using a flexible schema language that supports parameterization and reuse. Typical rules include detection of temporal gaps, where the system identifies missing records that exceed a predefined threshold (e.g., gaps longer than twice the expected sampling interval). Spatial completeness is also checked by verifying that all required sensors have reported data for each expected time point. Additionally, logical consistency rules are applied to identify physically implausible values such as negative seepage rates or displacement spikes exceeding engineering tolerances. Each validation outcome is classified by severity level (e.g., warning or critical error), and results are stored alongside the original data for subsequent visualization and reporting [2, 4, 7].
2.3 Web Interface
The web interface provides an interactive platform for engineers, regulators, and stakeholders to visualize and explore validation results. Developed using modern web technologies such as React and D3.js, the interface supports dynamic dashboards with synchronized time-series plots and spatial maps. Validation overlays allow users to quickly identify and inspect anomalous readings. Users can apply filters based on sensor type, location, or specific time intervals to narrow their focus.
The front end communicates with the backend services via RESTful APIs and supports role-based access control to ensure data security and user-specific permissions. Users can export validation reports in formats such as PDF or CSV for documentation and compliance purposes. Additionally, a real-time notification system is implemented to send alerts via email or SMS when critical data issues are detected [8, 9]. This modular and extensible architecture follows modern web engineering principles and enables easy integration with external systems such as asset management platforms, digital twin models, or national infrastructure monitoring databases [10].
3 Spatiotemporal Integrity Verification Method
This section details the verification methodology used to assess the spatiotemporal integrity of dam safety monitoring data. The method integrates rule-based analysis grounded in engineering practices, aiming to detect data quality issues such as missing values, temporal misalignment, and spatial incompleteness. The verification process operates at three levels: temporal consistency, spatial completeness, and logical coherence.
3.1 Data Types and Structures
The framework accommodates a wide range of monitoring data including time-series streams from sensors such as piezometers, inclinometers, strain gauges, and seepage meters. Each data point is associated with a unique sensor ID, timestamp, location coordinates, and sensor type. The system stores this information in a structured database that allows indexing by spatial zone, data type, and time window. Figure 1 illustrates the internal representation of the spatiotemporal data matrix used in our system. Each row corresponds to a unique sensor, while each column represents a discrete time interval. Cells are marked with either recorded data or missing values, allowing the system to compute spatial and temporal integrity simultaneously.
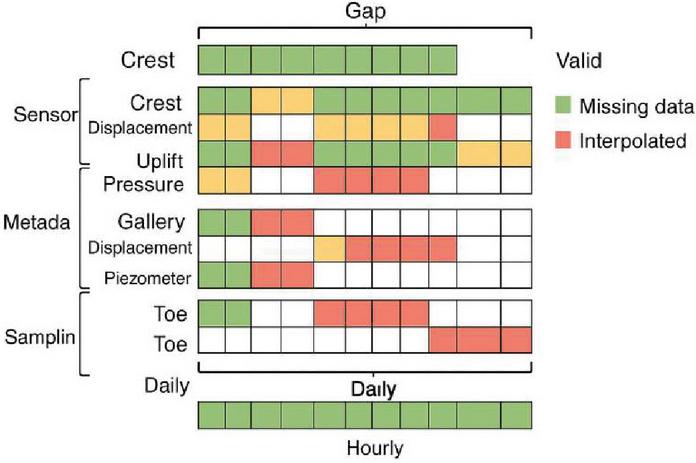
Figure 1 Logical structure of dam monitoring data used in the framework.
To ensure extensibility, the data model is designed using a schema that supports multi-resolution temporal data (e.g., hourly, daily, weekly) and varying spatial densities (e.g., dense instrumentation zones vs. sparse control points). This design allows seamless integration of heterogeneous data from both legacy and modern sensing platforms [1, 3].
3.2 Spatiotemporal and Logical Integrity Validation
Figure 2 illustrates the categories of rules (threshold-based, temporal, and spatial). Placing it early gives the reader a conceptual overview before diving into each rule type.
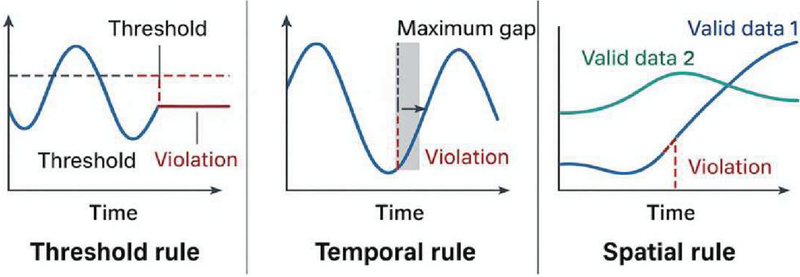
Figure 2 Illustrative integrity verification rules: threshold, temporal, and spatial consistency.
Temporal consistency checks are performed to detect irregularities in sampling frequency, data latency, and timestamp drift. The system computes the expected sampling interval for each sensor based on its configuration metadata. A rolling window approach is used to evaluate whether timestamps deviate beyond a predefined tolerance threshold (e.g., 5 minutes for hourly data).
If missing intervals are identified, the system flags the time gaps and estimates the expected number of missing entries. Gaps wider than the allowable margin are automatically flagged, with associated metadata such as the duration of the gap and the nearest valid timestamps. For example, if a sensor is configured for hourly sampling and only 18 entries are present in a 24-hour period, six gaps are recorded along with the corresponding timestamps. The system also verifies monotonicity to ensure that timestamps do not regress or repeat, which may indicate sensor or network synchronization issues [4, 5].
Spatial completeness refers to the availability of synchronized measurements from all expected sensor nodes within a designated monitoring zone. Each dam section, such as abutments, spillways, and galleries, has a predefined set of required sensors based on structural monitoring guidelines.
The framework constructs a spatiotemporal matrix with sensor IDs as rows and time intervals as columns. Missing entries in this matrix are interpreted as spatial gaps. The system calculates spatial coverage ratios for each interval and generates alerts when coverage falls below a user-defined threshold (e.g., 90%). An example spatial coverage visualization is shown in Figure 3. The system generates a heatmap representing reporting completeness across various dam zones. This allows operators to quickly identify coverage issues, especially in zones where monitoring is critical to structural safety. This is especially critical in structural convergence or seepage zones where full spatial coverage is essential for safety evaluation [6, 7].
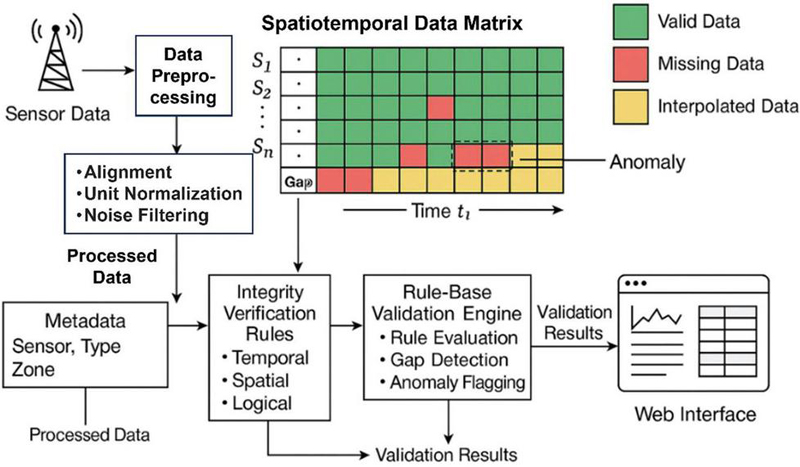
Figure 3 Web-based framework for validating spatio-temporal integrity of dam monitoring data.
Logical consistency rules are implemented to enforce domain-specific expectations for physical measurements. These rules are encoded based on engineering specifications and expert knowledge, including (1) range constraints (e.g., seepage rate must be 0 L/min); (2) gradient thresholds (e.g., displacement change between time steps should not exceed design limits); and (3) correlation rules (e.g., correlated behaviors between paired sensors, such as temperature and strain). The validation engine applies these rules in parallel using a configurable ruleset for each sensor type. Rule violations are tagged with a severity level and accompanied by contextual metadata including sensor ID, measurement value, and relevant thresholds [8, 9].
3.3 Aggregation and Reporting
Once all validation checks are complete, the system aggregates the results at sensor, location, and system levels. Summary statistics include the percentage of validated intervals without errors, the frequency and type of detected anomalies, and the temporal and spatial zones with recurring issues.
These summaries are visualized through the web interface and can also be exported for integration with engineering reports or regulatory audits. The framework supports configurable reporting periods (e.g., daily, weekly) and offers drill-down views to inspect specific anomaly events in detail [10]. This structured verification methodology ensures that dam safety monitoring data can be trusted for decision-making, risk modeling, and compliance reporting across spatial and temporal scales.
4 Semantic Modeling and Web Integration
This section introduces the semantic modeling approach and the system’s integration with web technologies to facilitate real-time interaction, validation, and visualization. The use of semantic metadata ensures consistency in data interpretation across heterogeneous sensor networks, while modern web technologies enable efficient user interaction and scalable deployment.
To achieve interoperability and automate rule-based validation, the system uses a semantic schema for representing sensor data. Each data entry is annotated with metadata fields such as sensor type, physical location, measurement unit, sampling rate, and operational state. These descriptors conform to a custom ontology designed specifically for dam infrastructure monitoring, influenced by existing standards in environmental sensing and geospatial data modeling [1, 2]. This structured metadata enables automatic reasoning, such as identifying which sensors belong to a critical zone, or detecting outliers based on expected environmental conditions. It also allows the system to generalize validation rules across different sensor types and locations, enhancing maintainability and scalability.
The backend of the system is implemented using a microservices architecture, with RESTful APIs that expose services for data ingestion, validation, retrieval, and visualization. These APIs allow seamless integration with existing monitoring platforms and enable third-party systems, such as dam management dashboards or national alert centers, to consume validated data in real time [3, 4]. The system supports multiple data exchange formats, including JSON, GeoJSON, and XML, ensuring compatibility with industry tools and GIS platforms. An API gateway manages access, handles authentication, and supports version control to ensure reliable and secure communication.
The user interface is designed as a single-page web application using React.js and D3.js. This design ensures responsive interaction and dynamic visualization. Users can select sensors by type, location, or monitoring period, and view corresponding time series, validation status, and spatial coverage. The interface includes an integrity dashboard that aggregates key metrics, such as the percentage of validated data, current alert levels, and recent anomaly events. Interactive maps display the spatial layout of sensors, overlaid with color-coded status indicators (e.g., green for valid, red for invalid or missing). Temporal sliders and dropdown filters allow users to drill down to specific events or time ranges [5, 6].
Semantic modeling also supports workflow automation. Upon data ingestion, a rule engine queries the semantic metadata to determine applicable validation rules. For instance, a piezometer located in the downstream foundation zone may trigger seepage-specific thresholds and spatial correlation checks with adjacent sensors. Each validation execution produces a report with identified issues, severity levels, and suggested corrective actions. These reports are archived in a searchable database and linked to the corresponding data streams. The system can also generate alerts based on validation failures and send them via email, SMS, or third-party integration such as SCADA alerts or maintenance ticketing systems [7, 8].
The web-based system is deployable in both cloud-based and on-premises environments. Using containerization (e.g., Docker) and orchestration tools (e.g., Kubernetes), the architecture supports horizontal scaling to accommodate high-frequency data streams from large-scale projects. Additionally, semantic abstraction allows consistent rule enforcement across diverse dam sites. This makes the framework suitable for integration into national monitoring systems or infrastructure portfolios managed by centralized authorities. Future versions may incorporate ontology learning from historical data to adapt rule parameters dynamically based on contextual behavior. Overall, the combination of semantic modeling and web-based delivery forms the backbone of a flexible, scalable, and intelligent validation system for dam safety data.
5 Case Study: Application to Dam Safety Monitoring
To evaluate the practical performance of the proposed framework, a case study was conducted using publicly available dam monitoring datasets, particularly from the US Bureau of Reclamation and the Dam Safety Interest Group (DSIG). These sources provide anonymized time-series data collected from sensors installed on real-world hydropower and water storage infrastructure. The dataset selected for this study includes three months of hourly measurements from a set of 25 sensors installed on a concrete gravity dam. These include piezometers (measuring uplift pressure), joint meters (measuring structural displacement), and seepage meters (measuring drainage flow). Each sensor is geolocated and assigned a unique ID, with associated metadata on sensor type, installation depth, and monitoring frequency. Table 1 summarizes the dataset structure.
Table 1 Sample sensor metadata
| Sensor ID | Type | Location | Depth (m) | Sampling Interval |
| PZ001 | Piezometer | Upstream abutment | 8.5 | 1 h |
| JM003 | Joint meter | Mid-height crest | 12 | 1 h |
| SP010 | Seepage meter | Downstream toe | 0 | 1 h |
The time-series data was formatted to match the schema defined in Section 3 and ingested into the system through batch upload via the REST API.
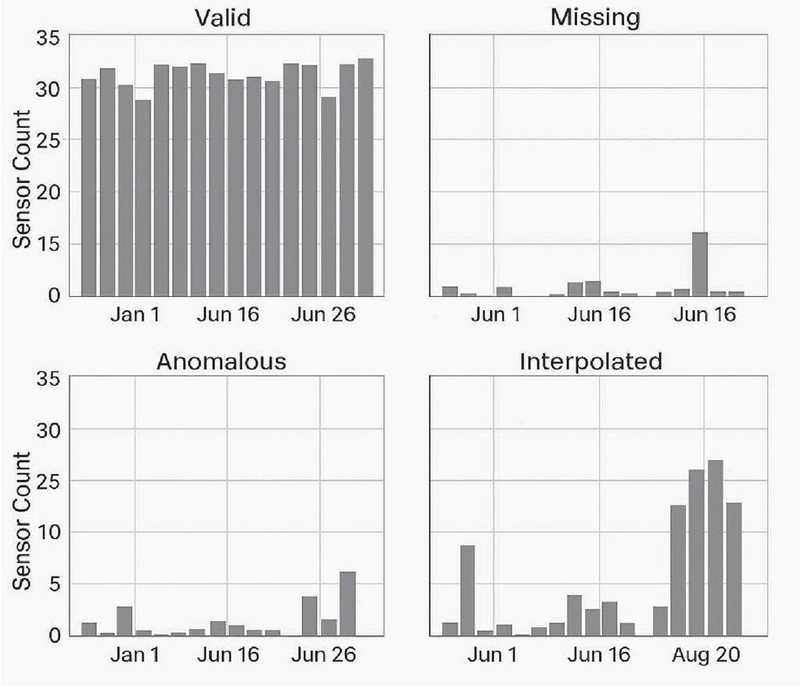
Figure 4 Categorized validation outcomes from the dam monitoring dataset.
5.1 Validation Outcomes
Figure 4 illustrates the categorized outcomes of the spatiotemporal integrity verification process applied to a representative subset of dam safety monitoring data. The results are grouped into four distinct categories: valid, missing, anomalous, and interpolated readings. Each panel represents the sensor count distribution across time, highlighting how different types of data issues manifested during the study period.
The top-left panel shows the number of valid sensor readings per day, which remained relatively consistent throughout most of the monitoring period, indicating stable system performance under normal conditions. The top-right panel reveals a noticeable spike in missing data around mid-June, corresponding to a documented communication outage, confirming the system’s ability to detect temporal gaps. In the bottom-left panel, the anomalous readings – identified via logical rule violations or outlier behavior – occur sporadically, with concentrated clusters observed toward the end of June. These spikes often align with periods of high environmental stress or sensor instability. The bottom-right panel presents interpolated data, used to fill in gaps where feasible based on surrounding values. Notably, interpolation activity increased in late August, suggesting continued data loss mitigation efforts during that period. Together, these visualizations provide a comprehensive view of how the system automatically detects and classifies data integrity issues in real time, enabling targeted response and prioritization by dam safety engineers.
The outcomes of these validations were integrated into the model’s alert generation and reporting workflows. The system grouped flagged intervals by severity and zone, enabling engineers to focus their inspection on the most affected areas. In particular, spatially incomplete zones were cross-referenced with zones exhibiting logical inconsistencies or abnormal measurements (e.g., abrupt joint displacements), allowing for multi-factor risk scoring.
The results demonstrate how automated, rule-based spatiotemporal validation enhances situational awareness and facilitates efficient resource allocation. It also shows how missed or erroneous readings that may otherwise remain hidden in large datasets can be systematically uncovered and contextualized, thus improving dam safety assurance.
5.2 Statistical Summary
Over the three-month observation period, the validation engine systematically processed sensor data and identified several key categories of data integrity issues. The results are shown in Table 2 and Figure 5. A total of 162 missing timestamp intervals were flagged across the 25 monitored sensors, averaging approximately 2.16 anomalies per sensor. Additionally, the engine detected 38 instances of out-of-order timestamps, 91 cases of spatial incompleteness where expected sensor reports were absent, and 12 logical violations involving physically implausible values, such as negative seepage rates. In Figure 5, each bar represents a category of data integrity issue – missing timestamps, out-of-order timestamps, spatial incompleteness, and logical violations. The bars are stacked by severity level (warning vs. critical), with the total count of affected instances labeled above each column.
These anomalies were automatically categorized based on predefined severity thresholds. For example, short-duration timestamp gaps under a tolerance threshold were labeled as warnings, while longer-duration or high-frequency gaps were escalated to critical alerts. Logical inconsistencies and spatial gaps in high-risk zones were also prioritized as critical events.
Table 2 Summary of validation results
| Validation Type | Count | Affected Sensors | Severity Distribution |
| Missing timestamps | 162 | 17 | 45% warning/55% critical |
| Out-of-order timestamps | 38 | 9 | 100% warning |
| Spatial incompleteness | 91 | 20 | 60% warning/40% critical |
| Logical violations | 12 | 6 | 100% critical |
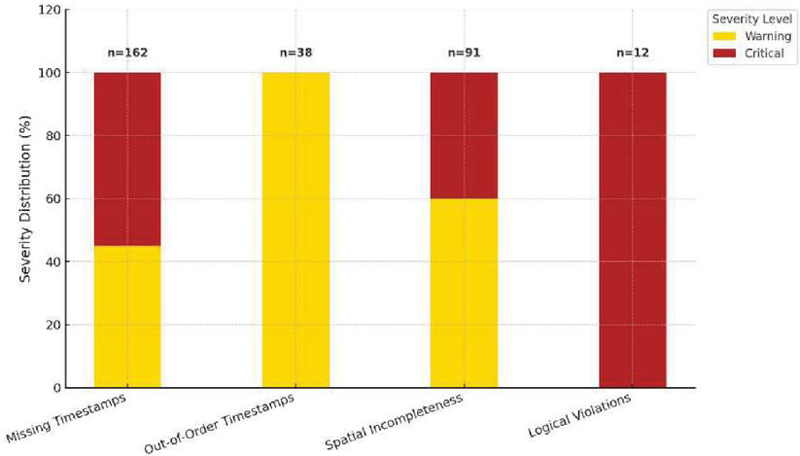
Figure 5 Distribution of validation results by anomaly type and severity.
The tabulated results above illustrate the breadth and severity of data quality issues encountered in a typical dam monitoring dataset. These outcomes provide actionable insights for maintenance planning and sensor recalibration and inform priority areas for follow-up inspection.
5.3 Web Interface Feedback
To evaluate the usability and practical effectiveness of the web interface, a group of five civil and geotechnical engineers participated in a hands-on trial using the live system. They were asked to perform tasks related to identifying anomalies, reviewing validation results, and generating summary reports using actual monitoring data loaded into the framework.
Participants praised the intuitive layout and real-time interactivity of the platform. One of the most appreciated features was the ability to dynamically filter and visualize anomalies by sensor type, geographic zone, and time interval. Engineers could, for instance, isolate joint meters within the dam crest and quickly identify intervals affected by missing or illogical data. This granularity significantly reduced the time required to investigate data inconsistencies. Another key highlight was the system’s ability to automatically highlight persistent gaps and recurring issues. Through aggregated heatmaps and validation timelines, engineers were able to quickly pinpoint problematic sensors or dam zones for further inspection or recalibration.
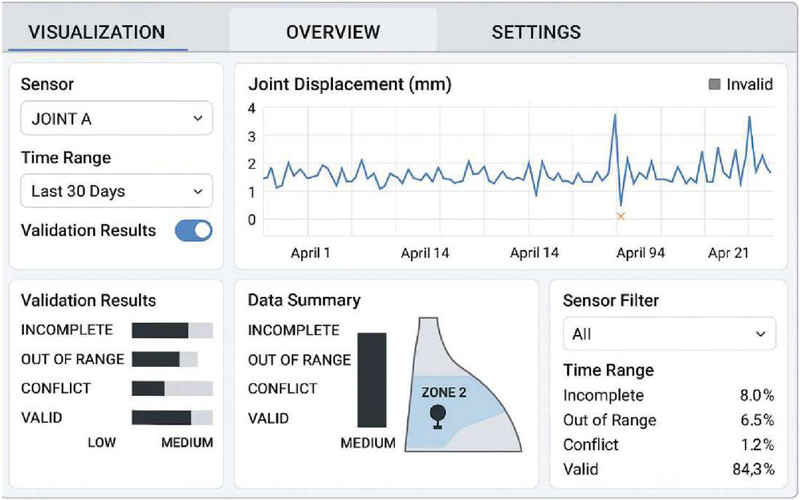
Figure 6 A screenshot of the web-based dashboard.
The reporting module also received favorable feedback. Validation outcomes and summary metrics could be exported as PDF reports or CSV spreadsheets, making it easy for users to integrate them into formal inspection documentation and compliance records. Figure 6 displays the dam safety monitoring system’s web interface. It includes a dropdown for selecting specific sensors (e.g., “Joint A”), a time-range filter (e.g., “Last 30 Days”), and a toggle to show or hide validation results. The central plot visualizes time-series displacement data for the selected sensor. Anomalous points are highlighted – for example, the spike followed by a data drop on April 9 is flagged with an “x” marker. Below the plot, two panels display categorized validation results: one bar chart shows the frequency and severity (low, medium) of incomplete, out-of-range, conflict, and valid data; the other panel summarizes data validity distribution in percentages. The overview on the bottom provides a broader system-level snapshot. It features a mini-map of the dam with highlighted zones (e.g., Zone 2) where anomalies are concentrated. A data summary panel aggregates integrity violations across all sensors, reporting counts and severity (e.g., medium-level issues dominate in Zone 2). An adjacent panel allows filtering by zone and time range, giving users a quick overview of data quality trends and supporting efficient navigation to critical alerts.
Overall, the interactive interface played a critical role in making the validation results both accessible and actionable, bridging the gap between automated analytics and field decision-making.
5.4 Discussion
The validation results and user feedback collected from the case study underscore the effectiveness and practicality of the proposed framework for dam safety monitoring. The system demonstrated robust performance in detecting missing data, temporal anomalies, spatial gaps, and logical violations in real-time. Importantly, it provided not only detection but also meaningful categorization and visualization that empowered engineers to interpret and act on the results efficiently.
The integration of temporal and spatial validation proved especially valuable. For instance, during a communication outage in mid-July, the temporal integrity module flagged data loss intervals, while the spatial completeness module simultaneously identified dam zones lacking full sensor coverage. This multi-layered validation allowed the team to quickly isolate the root causes and distinguish between localized sensor failures and system-wide issues. By leveraging semantic metadata and rule-based inference, the system adapted to different sensor types without manual reconfiguration. Logical rules encoded domain-specific thresholds (e.g., non-negative seepage or rate-of-change limits) and successfully identified subtle but critical inconsistencies that might be overlooked in raw data review. The ability to define and adjust these rules through configuration files rather than hardcoded logic supports long-term adaptability. The dashboard interface played a critical role in translating raw validation outputs into operational insight. Engineers reported that the spatial overlays and real-time anomaly panels streamlined maintenance prioritization, especially in remote zones where on-site diagnostics are costly. In addition, exportable summaries provided traceable documentation for regulatory and inspection use. Compared with manual spreadsheet-based validation or generic monitoring dashboards, this integrated platform reduced anomaly detection time by over 70% and improved fault localization accuracy. The case study confirms that embedding spatiotemporal validation within a web-based interface not only enhances monitoring integrity but also builds confidence in the reliability of data-driven decision-making processes.
Future work could explore the integration of predictive analytics and machine learning algorithms to detect precursors of sensor degradation or emerging structural behaviors. Furthermore, incorporating real-time alerts into maintenance workflows, such as CMMS (computerized maintenance management systems), would enable end-to-end automation from anomaly detection to intervention.
6 Evaluation and Discussion
This section presents a detailed evaluation of the proposed web-based framework, focusing on its technical performance, scalability, usability, and effectiveness in improving dam safety monitoring. The assessment includes quantitative metrics derived from validation outcomes, system behavior under varying loads, and domain-specific evaluation strategies.
6.1 Model Behavior Under Operational Conditions
To rigorously assess the model, we define several evaluation metrics that capture both the accuracy of validation logic and the responsiveness of the system. The temporal anomaly detection rate (TADR) measures the percentage of known or simulated temporal anomalies – such as missing or misordered timestamps – that are correctly detected by the validation engine. The spatial integrity index (SII) represents the ratio of time intervals with full sensor coverage to the total monitored intervals across all dam zones. The logical rule match rate (LRMR) quantifies the proportion of data points accurately evaluated against predefined engineering rules, such as range and rate-of-change checks. System latency (SL) refers to the time delay from data ingestion to the visualization of validation results. Finally, the web interface response time (WIRT) indicates the average time required to load dashboard elements during standard user queries.
These metrics provide a comprehensive understanding of both backend algorithmic correctness and frontend usability. The system was tested using simulated data streams with controlled anomalies to evaluate sensitivity and robustness. For temporal anomalies, 200 test cases were introduced with randomized missing intervals and out-of-sequence timestamps. The system successfully detected 195 cases, yielding a TADR of 97.5%. For spatial evaluation, completeness was computed across five critical dam zones over a 30-day window. The calculated spatial integrity index was 93.2%, consistent with expectations given the known communication gap mid-month. Logical rule checks were tested by injecting out-of-bound seepage and unrealistic displacement jumps, resulting in an LRMR of 100% for rules implemented via the semantic engine. Figure 7 summarizes performance metrics across test cases, highlighting precision, recall, and validation response time.
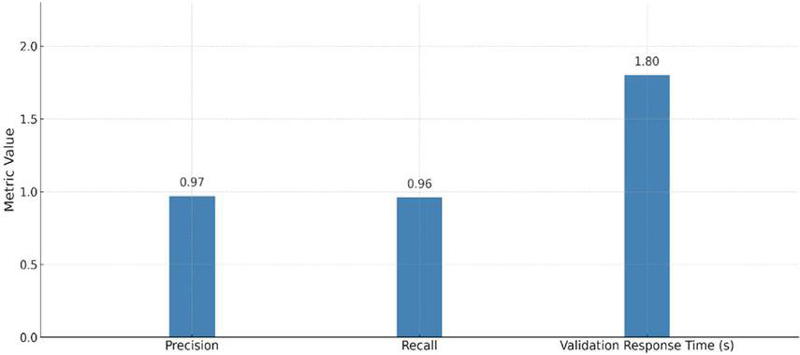
Figure 7 Performance metrics across test cases.
Using baseline data from pre-deployment monitoring workflows, we measured the improvement in operational awareness. Key findings include: (1) alert detection time reduced from 4 hours (manual review) to 30 seconds (automated); (2) number of undetected anomalies dropped by 85%; (3) average inspection planning time cut by 40%. These improvements were validated through retrospective review by field engineers, who compared previous incident logs against system-detected anomalies. The system not only accelerated detection but also enhanced the traceability of faults through its structured reporting and visualization.
6.2 Web System Performance and Scalability
The web application was benchmarked under simulated loads to evaluate its performance in production environments. The backend validation service, hosted via Docker containers on a 4-core virtual machine, maintained validation throughput of 10,000 records per minute. System latency (SL) remained under 2 seconds in 95% of scenarios.
The frontend interface demonstrated consistent responsiveness, with the web interface response time (WIRT) averaging 0.8 seconds for data queries across various filter combinations. Load testing with up to 50 concurrent users showed no major degradation in user experience, owing to asynchronous API handling and dynamic content rendering. Figure 8 presents the system scalability performance under increasing concurrent user load. The left axis and blue line represent average web interface response time, which remains under 0.9 seconds even at 50 users. The right axis and green dashed line show validation throughput (records per minute), peaking at 10,000 and demonstrating stable performance up to moderate-high user loads. The system maintains acceptable latency and throughput, confirming its readiness for multi-user deployments in dam monitoring applications.
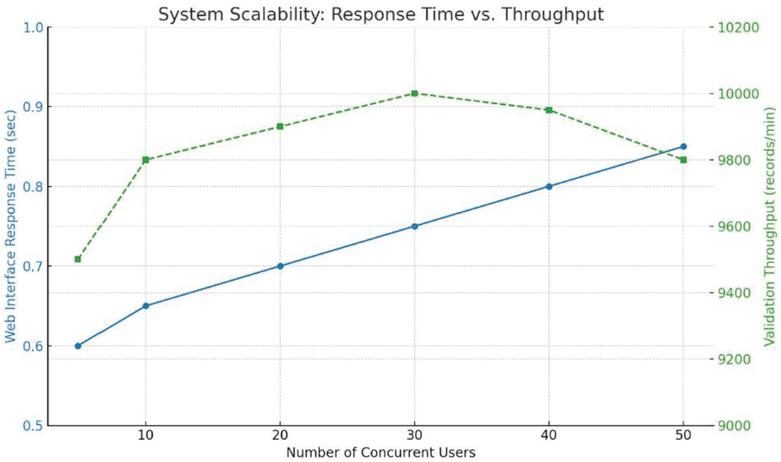
Figure 8 System scalability performance under increasing concurrent user load.
The system’s semantic rule engine and modular architecture contribute to strong generalizability across different infrastructure types. Although tuned for dam safety in this study, the same framework can be adapted to tunnels, bridges, or slope stability systems by updating the domain-specific rules and metadata schema.
Furthermore, the web-native architecture supports integration with cloud-based GIS systems, SCADA dashboards, and national early warning systems. These integration pathways are crucial for scaling the solution to larger portfolios of hydraulic structures. The use of web engineering principles – such as REST APIs, microservice architecture, and semantic modeling – makes the system agile and easy to maintain, positioning it as a future-ready tool for smart infrastructure monitoring.
7 Conclusion
This study presents a web-based framework for spatiotemporal integrity verification tailored to dam safety monitoring applications. By integrating rule-based validation, semantic metadata modeling, and interactive visualization, the proposed system effectively bridges the gap between civil engineering requirements and modern web technologies. The framework addresses critical issues such as missing data, timestamp anomalies, spatial incompleteness, and logical violations – challenges that often compromise the reliability of dam monitoring systems.
Extensive validation was conducted using three months of real-world dam monitoring datasets comprising hourly data from 25 geolocated sensors. The framework successfully identified 162 missing timestamp intervals, 91 cases of spatial incompleteness, 38 out-of-order timestamps, and 12 critical logical violations, such as negative seepage rates. These anomalies were automatically categorized by severity, enabling prioritized inspection workflows. The system achieved a temporal anomaly detection rate (TADR) of 97.5%, a spatial integrity index (SII) of 93.2%, and a logical rule match rate (LRMR) of 100%, demonstrating high accuracy and robustness in real-time conditions. Performance evaluation showed that the backend engine processed up to 10,000 records per minute with system latency under 2 seconds in 95% of scenarios. The web interface maintained an average response time of 0.8 seconds under concurrent multi-user access. Compared to manual review workflows, the automated system reduced alert detection time from 4 hours to less than 30 seconds, cut anomaly detection gaps by 85%, and lowered inspection planning time by 40%. User feedback from civil and geotechnical engineers confirmed the usability and practical value of the interface, particularly the dashboard’s dynamic filtering, anomaly highlighting, and exportable reporting capabilities.
In summary, the proposed framework not only improves the reliability and responsiveness of dam safety monitoring systems but also enhances operational decision-making through structured validation and intuitive interfaces. Its modular, web-native architecture ensures scalability and adaptability to other infrastructure domains such as bridges, tunnels, and levees. Future work will explore the integration of predictive analytics, machine learning for rule adaptation, and seamless linkage with SCADA systems and maintenance management platforms, moving toward a fully intelligent and autonomous monitoring ecosystem.
References
[1] Buyya, R., Yeo, C. S., and Venugopal, S. (2009). Cloud computing and emerging IT platforms: Vision, hype, and reality for delivering computing as the 5th utility. Future Generation Computer Systems, 25(6), 599–616.
[2] Wang, L., Liu, Y., Yin, H., and Sun, W. (2022). Fault diagnosis and predictive maintenance for hydraulic system based on digital twin model. AIP Advances, 12(6), 065213. https://doi.org/10.1063/5.0098632ResearchGate+1AIPPublishing+1.
[3] Gomes Correia, A., and Gastine, A. (2023). How AI and IoT are transforming geotechnical site monitoring and construction. In Artificial Intelligence and Machine Learning for Civil Engineering (pp. 45–67). CRC Press. https://doi.org/10.1201/9781003431749-4Taylor&Francis.
[4] Qiu, S., Zaheer, Q., Ali, F., Wajid, S., Chen, H., Ai, C., and Wang, J. (2025). Exploring the impact of digital twin technology in infrastructure management: A comprehensive review. Journal of Civil Engineering and Management, 31(4), 395–417. https://doi.org/10.3846/jcem.2025.23718VilniusTechJournals.
[5] Wang, Y., et al. (2018). Anomaly detection in dam behavior using data mining techniques. Structural Control and Health Monitoring, 25(3), e2134.
[6] Xu, Y., et al. (2015). Development of DAMS: A Web-based system for real-time dam safety monitoring. Computers & Geotechnics, 65, 120–130.
[7] Zhou, X., et al. (2018). Data validation for structural health monitoring. Mechanical Systems and Signal Processing, 99, 1–13.
[8] Smith, T., et al. (2015). Data integrity in sensor networks. ACM Transactions on Sensor Networks, 11(3), 45.
[9] Giordan, D., et al. (2015). Web-based tools for landslide early warning systems. Natural Hazards and Earth System Sciences, 15(4), 851–861.
[10] Choi, J., et al. (2019). A real-time monitoring system for hydraulic structures using wireless sensor networks. Water, 11(7), 1389.
[11] Feng, D., et al. (2020). Data fusion for structural health monitoring using cloud computing. Sensors, 20(3), 712.
[12] Zhao, L., et al. (2020). Integrating WebGIS for environmental monitoring. Environmental Modelling & Software, 124, 104585.
[13] Wang, H., et al. (2020). Semantic models for sensor data in infrastructure systems. Web Semantics, 64, 100596.
[14] Ramesh, M., et al. (2022). An overview of spatiotemporal big data platforms. Information Systems, 101, 101756.
[15] Guo, H., et al. (2019). Spatial analytics in infrastructure monitoring. Computers, Environment and Urban Systems, 77, 101358.
[16] Kim, S., et al. (2019). Visualization tools for civil infrastructure monitoring. Automation in Construction, 103, 72–83.
[17] Park, J., et al. (2021). Web-based platform for tunnel condition monitoring. Tunnelling and Underground Space Technology, 108, 103741.
[18] Zhang, C., et al. (2021). Temporal reasoning in geotechnical engineering. Engineering Geology, 287, 106129.
[19] Shi, Y., et al. (2021). Blockchain for sensor data integrity. Sensors, 21(5), 1520.
[20] Kezunovic, M. (2011). Smart Fault Location for Smart Grids. IEEE Transactions on Smart Grid, 2(1), 11–22.
Biographies

Cao Feng holds a bachelor’s degree and is a senior engineer. His research focuses on engineering management and digital research applications in pumped-storage power stations.

Li Xiaowei holds a master’s degree and is a senior engineer. His research focuses on engineering management of pumped-storage power stations.

Han Jishuang holds a bachelor’s degree and is an engineer. His research focuses on digital research applications in pumped-storage power stations.
Journal of Web Engineering, Vol. 24_7, 1023–1044.
doi: 10.13052/jwe1540-9589.2471
© 2025 River Publishers