Lightweight Test-time Adaptation for Robust Out-of-distribution Face Recognition in Web Services
Dongyoon Seo1, 2, Taebeom Lee1, 2, Jeongyoon Yoon1, Chiho Park2, Sangpil Kim1, Miyoung Kim1 and Byoungsoo Koh3,*
1Department of Artificial Intelligence, Korea University, Seoul, 02841, Republic of Korea
2Complexion Co., Ltd., Seoul, 02841, Republic of Korea
3Korea Creative Content Agency, Jeollanam-do, 58217, Republic of Korea
E-mail: dyseo@korea.ac.kr; rahites@korea.ac.kr; dabujin980617@gmail.com; skqkrclgh@korea.ac.kr; spk7@korea.ac.kr; aldud14712@gmail.com; bskoh@kocca.kr
*Corresponding Author
Received 30 May 2025; Accepted 29 June 2025
Abstract
Face recognition systems have the potential to support diverse services in Web 3.0 applications, yet two critical challenges remain underexplored. First, existing benchmark datasets are demographically biased and underrepresent elderly East Asian users, limiting fair and inclusive deployment. Second, sensor noise, lighting shifts, and motion blur introduce out-of-distribution (OOD) corruptions that cause severe accuracy degradation and undermine reliability in decentralized environments. To address these issues, we introduce the Korean Senior Face Benchmark, consisting of 700 images of 70 Korean senior celebrities, enabling realistic assessment for an underrepresented demographic. We quantitatively demonstrate that recent state-of-the-art models suffer significant performance drops under realistic corruption conditions, highlighting the need for enhanced robustness. Finally, we show that a lightweight test-time adaptation (TTA) strategy can recover OOD performance without retraining, making it well-suited for edge devices and distributed infrastructures while preserving user privacy. Experiments show accuracy gains of up to 41.5% under the most severe corruptions, along with improvements in intra-class compactness and inter-class separability in the embedding space. The proposed benchmark and adaptation pipeline lay a practical foundation for building distributed, fair, and privacy-aware face-recognition services in Web 3.0 applications.
Keywords: Web 3.0, face recognition, face verification, out-of-distribution, test-time adaptation.
1 Introduction
As various Web 3.0 applications emerge – such as spatial computing, decentralized platforms, social media, and non-fungible token (NFT) marketplaces – the importance of technologies [1, 2] that can authenticate users securely and efficiently within these environments is increasing. Among these technologies, deep learning-based face recognition stands out for its potential as a core component in Web 3.0 interactions, owing to its convenience of contactless and high recognition accuracy [3, 4]. It can be effectively utilized in user authentication, smart city access control, and personalized services.
However, there are still two significant challenges in integrating and operating face recognition systems within real-world Web 3.0 applications. First, existing face recognition approaches suffer from a mismatch between the large-scale datasets used for training and the benchmark datasets used for evaluation, which limits the ability to assess target performance in real-world deployment scenarios. To address this, we analyzed several commonly used face recognition benchmarks and confirmed a noticeable underrepresentation of East Asian and elderly individuals [5, 6]. This demographic imbalance hinders accurate performance evaluation for these user groups and may lead to unfair or suboptimal outcomes in practical applications [7]. Second, face recognition systems can suffer severe performance degradation when confronted with out-of-distribution (OOD) image corruptions or various real-world environmental changes that were not encountered during training. In web environments, the diversity and unpredictability of users’ devices, network conditions, and surroundings intensify these challenges. Consequently, poor performance under OOD conditions poses a significant threat to the reliability and stable service delivery of web applications [8].
These issues must be addressed for face recognition technology to fully realize its potential and function as a reliable AI component within Web 3.0 environments. We complement the lack of representation of elderly East Asian populations in existing benchmarks; we constructed our own benchmark dataset comprising facial images of senior Korean celebrities. This benchmark enables rigorous evaluation of model robustness under realistic image corruption scenarios and allows more precise performance analysis for elderly East Asian users. We applied corruption-based OOD conditions to both our benchmark and existing benchmarks to observe and quantitatively analyze the performance degradation that may occur in real-world deployment scenarios. Next, to mitigate the performance degradation caused by image corruption in OOD environments, we applied and evaluated a test-time adaptation (TTA) method (Tent [9]) tailored specifically for embedding-based face recognition models. This lightweight TTA approach updates only the batch normalization statistics without altering model weights, enhancing efficiency in real-time inference scenarios and considering deployment feasibility in decentralized or edge computing environments typical of web applications.
The main contributions of this study are as follows:
1. To improve the inclusiveness of face recognition performance evaluation in deployment scenarios, we constructed a Korean senior face benchmark, a new dataset composed of face images of senior Korean celebrities who represent the underrepresented distribution of elderly East Asian populations not adequately covered by existing benchmarks.
2. We quantitatively analyze the performance degradation of existing face recognition models under various environmental corruptions and OOD conditions, thereby examining critical robustness issues that may be encountered in real-world deployments such as Web 3.0 environments.
3. We experimentally demonstrate that applying a TTA method can effectively restore degraded performance under corruption-induced OOD conditions.
2 Related Work
2.1 Face Recognition Technology in Web Environments
Deep learning-based face recognition methods have made significant progress, improving from initial softmax-based loss function [10] to approaches by various loss functions [11, 12, 13, 14] for metric learning. FaceNet [12], one of the pioneering studies, proposed an effective method to represent facial features in the embedding space. Subsequent margin-based loss functions [15, 16, 17, 18] further enhanced the discriminative power of embeddings and substantially improved recognition performance. In particular, Deng et al. [19] introduced an angular margin to the loss function, establishing itself as a strong baseline widely adopted in current face recognition research. More recent studies, including TransFace [20], which leverages Vision Transformer (ViT) [21] architectures, and TopoFR [22], which incorporates topological information, have further advanced the representational capacity and robustness of face recognition models.
These advanced face recognition models offer several advantages for Web 3.0 applications. Specifically, deep learning-based face recognition enables efficient identity comparison, supporting scalability in large-scale user environments [23]. Similarity-based computations in the feature embedding space are also well-suited for decentralized infrastructures [24] and edge devices [25]. Moreover, such approaches provide benefits for designing identity management systems that take user privacy into account [26].
Deep learning-based face recognition systems are increasingly integrated into critical applications such as unmanned access control in security, healthcare and welfare facilities [27]. These systems provide essential functions for user identity verification and authentication. In addition, they can serve as core components for decentralized identity management [28] or personalized service provision [29] in Web 3.0.
2.2 Face Recognition Benchmarks and Demographic Representation
The performance of existing face recognition models is commonly evaluated using a variety of benchmark datasets, such as LFW [30], IJB-C [31], CALFW [32], CPLFW [33], AgeDB-30 [34], and CFP-FP [35]. These datasets differ in terms of collection environments, sample sizes, difficulty levels, and the degree to which age-related characteristics are reflected. However, most of them are heavily skewed toward younger Western populations, lacking sufficient representation of elderly East Asian individuals, including the Korean senior population [36]. Previous studies, such as those by Karkkainen et al. [5] and Wang et al. [6], have analyzed the impact of demographic bias on face recognition performance and highlighted the severity of the issue. Such dataset bias poses a significant obstacle to providing fair and trustworthy services to diverse user groups. Ensuring the reliability of face recognition technology is particularly important in various services [27, 37] targeting the elderly population. To achieve this, performance evaluation must be conducted using datasets that adequately represent this demographic group.
To address this challenge, our study constructs a new benchmark dataset consisting of facial images of Korean senior celebrities, aiming to optimize for target-domain performance in practical deployment scenarios.
2.3 The OOD Challenge in Face Recognition
In real-world scenarios, face recognition systems frequently encounter situations that differ from the training data distribution. These out-of-distribution (OOD) issues can arise from various factors such as lighting variations, degraded camera hardware, unstable network conditions, and unpredictable physical environments. These conditions are more frequently encountered in Web 3.0 settings, leading to significant performance degradation [38]. Therefore, ensuring the reliability of face recognition in web-based applications is a critical concern.
Hendrycks et al. [39] defined dozens of image corruption types, such as noise, blur, and weather effects, and introduced a benchmarking framework for evaluating model robustness under these corruptions. Building on this, Kang et al. [40] conducted benchmark studies specific to the face recognition domain, assessing model robustness against corruption-based OOD scenarios.
Performance degradation due to OOD conditions can also have serious consequences in web services, including diminished user experience, increased security vulnerabilities, and potential service interruptions [41]. To quantify the impact of OOD challenges, our study follows the corruption definitions proposed by [39, 40], selecting representative corruption categories and simulating realistic scenarios that may arise in distributed and edge computing environments.
2.4 Test-time Adaptation for Face Recognition
Test-time adaptation (TTA) is a technique that enables models to adapt to domain shifts in the input data during inference, without requiring additional training. TTA adjusts the model at inference time, relying on the statistics or responses of the test data, without any additional training stage. Representative approaches include normalization-based methods [42], entropy minimization techniques [9], and pseudo-labeling strategies [43].
In web-based systems, retraining models is often impractical due to constraints such as limited computational resources [44] and user data privacy concerns [45]. TTA offers a lightweight alternative to enhance model robustness under such constraints, without the need for additional data or full retraining.
To date, most TTA research has focused on general image classification tasks, and its application to face-related tasks remains limited. In this study, we apply TTA to embedding-based face recognition models and demonstrate that it can improve embedding quality and discriminability under OOD conditions. This enables effective robustness recovery without requiring extra data or computational cost, suggesting that TTA is a practical solution for the deployment and operation of face recognition systems in Web 3.0 environments.
3 Methods
This section first describes the construction process of a new benchmark dataset featuring elderly individuals of Korean nationality, aimed at addressing the underrepresentation of East Asian seniors in existing face recognition datasets. Although our ultimate goal is to comprehensively cover the East Asian senior population, practical constraints such as language barriers, privacy concerns, and data accessibility issues led us to initially focus on building a dataset of well-known Korean senior identities. Next, we simulate out-of-distribution (OOD) scenarios by applying image corruption techniques and analyze how recognition performance degrades under these conditions. Finally, we explore the use of TTA methods to recover recognition performance under such out-of-distribution conditions.
3.1 Korean Senior Face Benchmark
Most existing face recognition datasets have been constructed through web-based convenience sampling, leading to substantial racial imbalance [46]. In particular, white identities are heavily overrepresented, whereas non-white populations, including Asians, are significantly underrepresented, and the elderly within these groups are even less represented. Such data bias lead to performance disparities in face recognition models. Indeed, prior studies [36, 5, 6] have reported that the same model often performs significantly worse on identities of Asian or African descent. Furthermore, performance analysis in different age groups confirmed that face recognition accuracy significantly deteriorates for individuals aged 60 and older, consistent with previous findings [5]. To address these issues and provide a foundation for evaluating model performance under OOD scenarios, this study constructed a benchmark dataset consisting of elderly identities of Korean nationality.
As an initial step, we collected facial images of Korean senior celebrities from online sources. These identities were selected as a practical proxy to address the underrepresentation of East Asian seniors in existing benchmarks. Image collection was conducted independently by two researchers, and the final sample set was confirmed through mutual review based on duplicate removal criteria and quality assessment. We first compiled a list of Korean celebrities, such as actors and singers, who were aged 70 or older as of 2025, including both living and deceased individuals with verifiable recent activity in the entertainment industry. For each selected identity, we searched for facial images online and limited the sources to publicly available content, including official event photos, television appearances, and news articles. In addition, we precisely estimated the individual’s age at the time of image capture by using their birthdate and the image’s creation date (e.g., article publication date, event date, or broadcast date). Collecting images of elderly celebrities is challenging due to the limited number of available identities and accessible image sources, as well as noticeable variation in the number of retrievable images across individuals. To prevent data imbalance caused by an excessive concentration of images for certain well-known figures, we intentionally limited the number of samples per identity to ensure dataset quality. As a result, 10 images were collected per identity, with efforts made to ensure diversity in lighting conditions, facial expressions, poses, and camera angles. All images were organized into directories named after each subject’s English name, with file names formatted according to the AgeDB-30 benchmark convention. This design enables intuitive identification of key metadata directly from file names. The collected dataset includes a wide range of conditions such as facial expressions, lighting variations, poses, and resolutions, with all faces aligned using a face-detection model [47] following the procedure adopted in prior studies [10]. Because the images were sourced from publicly available photographs of celebrities, most subjects appear with at least light makeup. Figure 1 presents qualitative examples of the collected images, illustrating that the data was collected to ensure a balanced distribution between various identities.
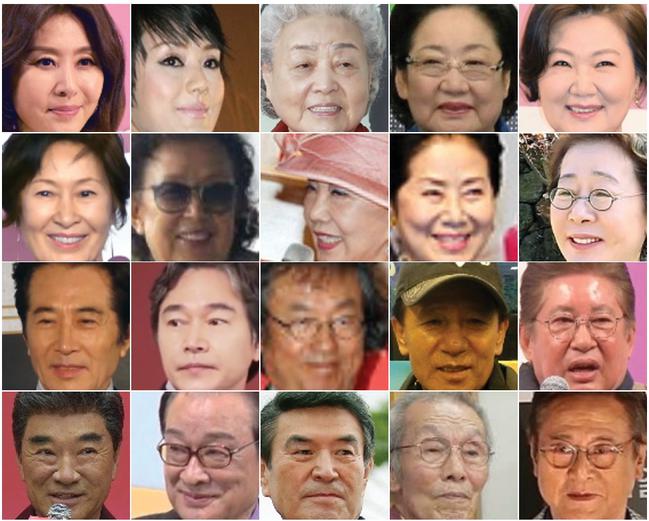
Figure 1 Sample images from the Korean senior face benchmark, illustrating 20 identities. The top two rows present female seniors, while the bottom two rows present male seniors. The dataset captures a wide range of variations in facial expression, lighting, pose, makeup, and camera angle across individuals.
During the dataset construction process, efforts were made to maintain a balanced distribution between male and female subjects while also covering a wide range of age groups. Overall, identities in their 70s represent the largest proportion of the dataset, with the gender distribution within this group being relatively balanced. The 60s and 80s age groups contribute similarly to the dataset, with a slightly higher proportion of women in their 60s and a higher proportion of men in their 80s. In contrast, identities in their 50s and 90s comprise only a small fraction of the dataset. In particular, collecting samples of women in their 90s proved challenging due to the limited number of publicly active individuals and the small surviving population in this age range. Among the 70 individuals in the dataset, 34 are male, accounting for 48.6%, and 36 are female, accounting for 51.4%. This reflects an overall balanced gender composition. Figure 2(a) illustrates the age-wise gender distribution, while Figure 2(b) presents the overall gender ratio using a pie chart.
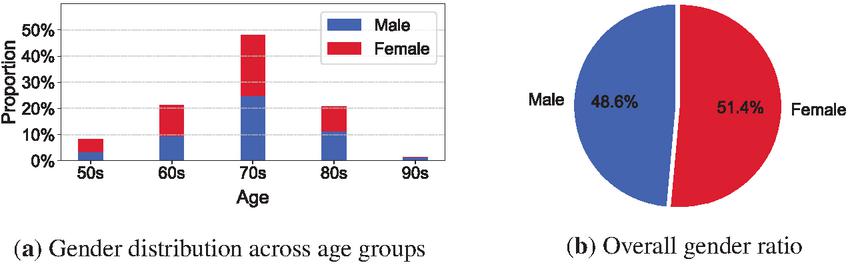
Figure 2 Demographic composition of the Korean senior face benchmark. Figure (a) shows age-wise gender distribution, and (b) presents the overall male–female ratio.
Existing benchmarks are often designed around standardized protocols that account for factors such as facial orientation, age differences, and the difficulty of pair construction. However, such designs often fail to sufficiently capture the diverse conditions that naturally occur in images of elderly individuals. The Korean senior face benchmark addresses these limitations and enables the evaluation of model generalization performance in more realistic scenarios. To this end, the ten images collected for each identity were organized with future evaluations based on the LFW and IJB protocol in mind. For evaluation based on the LFW protocol, the dataset was first divided into genuine and imposter directories. Two images were placed in each directory to enable the model to determine whether the image pair belongs to the same identity (genuine) or to different identities (imposter). For evaluation based on the IJB protocol, five images were designated as gallery samples and the remaining five images as probe samples, allowing for diverse pairwise matching suitable for both verification and identification tasks. Korean senior face benchmark is employed in the experiments presented in Section 4.3, alongside existing face recognition benchmarks, to analyze the performance distributions of various models.
3.2 Out of Distribution in Faces
Although modern face recognition models achieve high average accuracy across many benchmark datasets, these results are largely based on evaluations conducted under controlled conditions with clean images, where lighting, pose, and image quality are stable. In real-world applications, however, various factors such as sensor noise, motion blur, lighting changes, and occlusion often result in image degradation, which can significantly reduce the performance of face recognition systems. In the general image recognition domain, it is well established that corruptions such as Gaussian noise, blur, and occlusion degrade the performance of deep neural networks. We apply these corruptions to face recognition benchmarks to quantitatively analyze performance changes under OOD conditions. To this end, we adopted 20 types of image corruptions and five severity levels, as defined by [39, 40], and applied them to both publicly available benchmarks and the Korean senior face benchmark proposed in this study.
These corruptions are grouped into five high-level categories according to their source of distortion, each comprising several specific corruption types, as shown in Table 1. Each corruption type is applied across five severity levels, enabling a multi-level assessment of model robustness and generalization performance. We focus on a corruption-based OOD scenarios, specifically the synthetic perturbation shift, as the primary setting for our experiments. Although this setting does not fully capture the domain diversity found in real-world environments, it provides a meaningful and controlled framework for comparing the robustness of face recognition models.
Table 1 Categorization of 20 image corruption types considered in Kang et al. (2024). The corruptions are grouped into five categories – sensor, movement, occlusion, lighting & weather, and data & processing – each comprising multiple subtypes. among them, only ten corruption types, highlighted in bold, were actually used in our robustness evaluation experiments: defocus blur, pixelate, zoom blur, facial distortion, frost, spatter, contrast, saturate, gaussian noise, and speckle noise
| Category | Corruption Details |
| Sensor | Defocus blur, color shift, pixelate |
| Movement | Motion blur, zoom blur, facial distortion |
| Occlusion | Random occlusion, frost, spatter |
| Lighting & weather | Brightness, contrast, saturate, fog, snow |
| Data & processing | Gaussian noise, impulse noise, shot noise, speckle noise, salt pepper noise, JPEG compression |
Image corruption is introduced by applying a distortion function on the original image, and can be mathematically defined as follows:
| (1) |
In Equation (1), denotes the original clean image, and denotes its corrupted counterpart, with and representing the clean and corrupted image space, respectively. The function varies depending on the type of corruption, and the corresponding formulations for the five categories of corruption are presented below.
Defocus blur, which results from sensor degradation or focus errors, is modeled using a convolution-based distortion function as follows:
| (2) |
In Equation (2), denotes the 2D convolution operator, is a disk-shaped kernel with radius , and represents the probability distribution from which the kernel is sampled. This formulation approximates the optical blur effect commonly observed in real-world camera systems.
Facial distortion and similar corruptions arise from spatial displacement caused by subject motion or camera shake. These effects can be modeled as follows:
| (3) |
The function in Equation (3) denotes the pixel coordinates in the image, and is a nonlinear distortion function that represents the motion-induced displacement at each location.
Occlusion-based corruptions occur when parts of the face are blocked by external objects and are implemented by masking specific regions. For example, a corruption type such as spatter can be modeled as follows:
| (4) |
As shown in Equation (4), denotes the element-wise product. The binary mask assigns 0 to occluded regions and 1 to visible ones.
Brightness and contrast shifts induced by environmental factors are simulated via linear transformations of pixel values. For example, contrast adjustment can be modeled as follows:
| (5) |
In Equation (5), is a scaling factor for contrast, and is an offset for brightness. Both parameters are set according to the severity of corruption.
Digital noise-based corruption is implemented by adding a stochastic noise term to the image. Additive Gaussian noise, a representative example, models digital signal degradation as follows:
| (6) |
Here, is sampled from a normal distribution with zero mean and variance , and is the key parameter that controlling the noise intensity. Each image corruption categories were applied to all five existing benchmarks as well as the Korean senior face benchmark proposed in this study.
Figure 3 provides a visual illustration of how ten types of image corruptions are applied to face recognition images. Each column corresponds to a specific corruption type, and each row represents one of five severity levels in increasing order from top to bottom. All samples were extracted from publicly available benchmarks, enabling intuitive comparison of visual appearance and distortion characteristics before and after corruption.
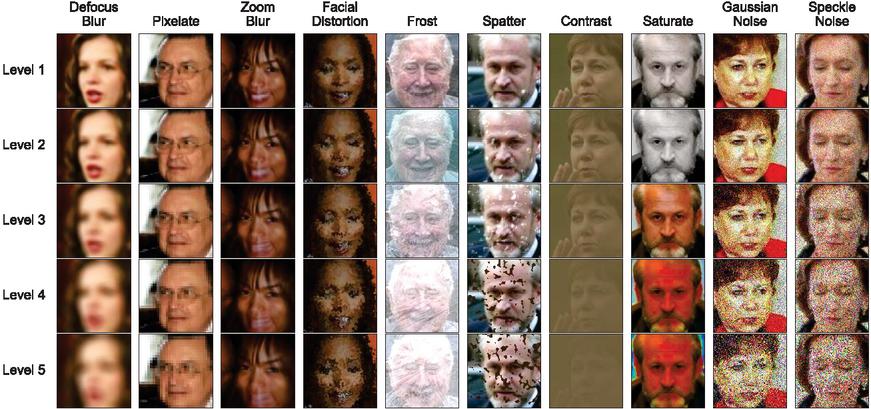
Figure 3 Visual examples of 10 corruption types applied at severity levels 1–5. Each column shows one corruption across increasing severity.
Most corruptions show minimal visual differences from the original image at level 1. However, at level 5, facial structures are severely distorted, making recognition extremely difficult. For example, sensor-based corruptions such as defocus blur and pixelation result in the loss of facial contours at high severity levels. In contrast, motion blur and zoom blur, which are classified as movement-related corruptions, cause progressive degradation but tend to preserve the overall facial shape. Occlusion-based corruptions such as frost and spatter increasingly obscure critical facial regions as severity increases, significantly hindering identification. Additionally, contrast and snow from the lighting and weather category substantially affect visual quality, while shot noise and speckle noise introduce non-uniform patterns across the entire face at high levels of severity, interfering with visual discrimination.
These visual examples illustrate how the nature of corruption and the level of difficulty encountered by face recognition models vary depending on the corruption type. Section 4.4 provides a quantitative comparison of performance degradation across different corruption conditions.
3.3 Test-time Adaptation in Face Recognition
Recent advances in TTA have focused on enabling trained models to adapt sequentially to shifts in the input domain, such as inter-dataset distribution shifts, without the need for additional training. However, most existing methods rely on loss functions defined over classifier outputs, which limits their applicability to face recognition systems where classifier heads are typically removed during inference.
This study highlights this structural difference and reinterprets the role of TTA in face recognition as a means of acquiring more robust feature representations. Specifically, the proposed approach seeks to adapt to domain shifts by encouraging the network to generate more discriminative embeddings at test time.
3.3.1 Entropy-based online adaptation
We adapt the entropy-based test-time adaptation method known as Tent [9] to the context of face recognition. Given the absence of a classifier head, the embedding vector is transformed via a softmax function into a pseudo-probability distribution, and test-time adaptation is performed by minimizing the entropy of this distribution. Accordingly, we define the following loss function:
| (7) |
Here, denotes the embedding of input image , is the batch size, and is the dimensionality of the embedding space. The softmax-transformed vector is interpreted as a probability distribution that reflects the relative activation strength across embedding dimensions. This formulation enables entropy minimization in the absence of classifier outputs, effectively serving as a surrogate objective to promote more concentrated and robust feature representations.
3.3.2 Adaptation mechanism via batch normalization
This adaptation method minimizes the entropy loss by updating only the statistics and affine parameters (scale and shift) of BN layers, while keeping all other model parameters frozen. BN layers normalize inputs using the batch mean and variance to reduce internal covariate shift, and this process can be formally expressed as follows:
| (8) |
Here, denotes the input to the BN layer, and and represent the mean and variance computed from the current batch . The term is a small constant added for numerical stability to prevent division by zero, and denotes the normalized output. This normalization is applied independently to each feature dimension. Moreover, the batch statistics in BN are not computed solely from a single batch but are updated cumulatively using a momentum coefficient, as expressed in the following equations:
| (9) |
Here, and denote the mean and standard deviation computed from the current batch, while and refer to the running statistics accumulated prior to the current test input. The coefficient is a momentum hyperparameter, typically set to values such as 0.9 or 0.99, and controls the update rate at which new statistics are integrated into the running estimates. This mechanism enables the model to adapt incrementally to distributional shifts in the test data, thereby supporting the generation of more robust embeddings under domain shift conditions.
3.3.3 Online setting and parameter sensitivity
Unlike previous works [48, 49] that often assume a source-free domain adaptation (SFDA) setting, where the entire test set is available in advance, this study adopts a fully online adaptation scenario in which test batches arrive sequentially. This setup simulates real-world face recognition systems, where domain conditions may shift continuously during deployment. Furthermore, the proposed adaptation method is sensitive to both batch size and the number of optimization steps for entropy minimization, and different combinations of these hyperparameters may result in a trade-off between adaptation performance and computational efficiency. To address this, we empirically evaluated various batch size and step count configurations to identify an optimal setting for face recognition.
4 Experiments
4.1 Implementation Details
This study investigates the performance degradation of face recognition models under out-of-distribution (OOD) conditions and explores the effectiveness of test-time adaptation (TTA) methods in mitigating such degradation. In particular, to evaluate face recognition performance on elderly individuals, who are often underrepresented in existing benchmarks, we constructed a benchmark dataset featuring Korean senior identities and designed our experiments around it. All conducted experiments were performed in accordance with the LFW protocol.
4.1.1 Korean senior benchmark dataset
We collected a total of 700 facial images from 70 Korean senior celebrities, with ten images per individual. All images were curated through a filtering process, followed by face detection and alignment to normalize pose and scale. Using the aligned images, we constructed 3000 genuine pairs (same identity) and 3000 imposter pairs (different identities) for verification experiments. We employed RetinaFace [47] model for face detection and landmark-based alignment, which ensured consistency in facial positioning and orientation. This benchmark serves as a new standard for evaluating face recognition performance on elderly individuals.
4.1.2 Benchmarks and out-of-distribution setup
To assess the robustness of face recognition models, we employed six benchmark datasets: five publicly available benchmarks – LFW [30], CALFW [32], CPLFW [33], AgeDB-30 [34], and CFP-FP [35] – and a newly constructed Korean senior face benchmark. For the OOD experiments, we followed the protocol proposed by [39], and constructed corrupted versions of benchmark datasets by applying various image degradations. Corruption severity was categorized into five levels, and levels 1, 3, and 5 were selected for analysis to enable more readable comparisons. Among these benchmarks, we further analyze the effect of image corruption on face recognition by comparing embedding distances and standard deviations across corruption categories, focusing on CPLFW [33], the most challenging among the existing benchmarks.
4.1.3 Face recognition models
Our experiments involved three families of face recognition models: ArcFace [19], AdaFace [50], and TopoFR [22], each pre-trained on either the MS1MV2 or MS1MV3 dataset. Both MS1MV2 and MS1MV3 are based on the MS-Celeb-1 [51] dataset, where MS1MV2 is an initially refined version of MS-Celeb-1, and MS1MV3 is a further refined version of MS1MV2. The ArcFace models include ResNet50 [52] and ResNet100, both trained on the MS1MV3 dataset. For AdaFace, we employed Improved ResNet50 [53] and Improved ResNet101 models trained on MS1MV2. The TopoFR models include ResNet50 and ResNet100, all trained on the MS1MV2 dataset. All models were trained on face verification tasks and evaluated in inference mode with backbone parameters kept frozen during our experiments.
4.1.4 Test-time adaptation method
To enhance model performance under OOD conditions, we applied the Tent [9] method. During inference, Tent minimizes the entropy of the softmax outputs by updating the BN statistics, specifically the running mean and variance, as well as the affine parameters ( and ), while keeping all other model parameters fixed. We experimentally validated that application of Tent alone can enhance model performance under OOD conditions. While the primary experiments were conducted on our Korean senior face benchmark, we additionally used the CALFW and AgeDB-30 benchmarks to analyze the effects of batch size (48, 256) and the number of optimization steps (1, 5, and 10) during adaptation.
4.1.5 Experimental environment
All experiments were conducted in a computational environment equipped with two NVIDIA A100 GPUs and one NVIDIA RTX 3090 Ti GPU. The two hardware configurations were selectively used to accommodate varying batch size requirements during test-time adaptation. The experiments were conducted in the Python 3.10.16 environment using PyTorch 2.4.1 with CUDA 12.4. Image corruptions were generated using the imagecorruptions [54] library version 1.1.2 in a Python3 environment, including motion blur, Gaussian noise, JPEG compression, and occlusion. For face detection and alignment, we used the RetinaFace [47] model implemented through the insightface library version 0.7.3, which provides landmark-based normalization to ensure consistent facial alignment.
4.2 Evaluation Metric
We evaluated the model performance using a set of metrics specifically suited to the characteristics of the face verification task. These metrics are used not only to measure accuracy, but also to analyze representational stability under OOD conditions, as well as changes in the embedding space induced by TTA.
4.2.1 Pair-level ground truth definition
All evaluations are performed on one-to-one face pairs, where image pairs of the same identity are defined as genuine pairs, and those of different identities as imposter pairs. Each face pair is classified as either true or false depending on whether the model makes a correct prediction. The results are then categorized into four types: true positive (TP), false positive (FP), true negative (TN), and false negative (FN).
4.2.2 Accuracy
Accuracy is computed following the evaluation protocol of the LFW benchmark [30], a widely used standard for face verification. It is calculated as the average over 10-fold cross-validation and is defined as the proportion of correctly classified pairs among all evaluation pairs:
| (10) |
Here, the numerator denotes the number of correctly classified pairs (i.e., the sum of TP and TN), and the denominator indicates the total number of evaluated pairs. Accuracy serves as a summary metric of overall verification performance and is used for comparison with public benchmark results.
4.2.3 Precision and recall
Precision and recall respectively reflect the reliability and coverage of a model’s positive predictions. Precision refers to the proportion of correctly predicted genuine pairs among all pairs predicted as genuine, whereas recall refers to the proportion of correctly predicted genuine pairs among all ground-truth genuine pairs. They are defined as:
| (11) |
We utilized the precision-recall (PR) curve to quantitatively evaluate the difficulty of each benchmark dataset. Although the same model achieves high precision and recall on LFW, its precision–recall (PR) curve tends to shift downward when evaluated on our custom Korean senior face benchmark. This result demonstrates that our benchmark poses a more challenging evaluation setting than LFW. A detailed quantitative analysis is provided in Section 4.3.
4.2.4 Embedding-level evaluation with cosine distance
Face recognition models project input images into high-dimensional embedding vectors. The similarity between two embeddings is measured using cosine similarity, which quantifies the angular closeness between vectors and is defined as follows:
| (12) |
Here, denotes the inner product between the two vectors, and represents the L2 norm of a vector. Cosine similarity takes values in the range [], with higher values indicating greater directional similarity between vectors. For actual verification decisions, we use the cosine distance, which is derived from the cosine similarity:
| (13) |
While the cosine distance can theoretically range from 0 to 2, in face recognition applications embedding vectors are typically L2-normalized, causing the distance values to fall within the range [0, 1] in practice. Smaller distances indicate a higher probability that the two images correspond to the same identity.
We computed the mean and standard deviation of cosine distances for genuine and imposter pairs separately within each fold of the 10-fold validation, in order to analyze the distributional differences between intra-class and inter-class distances. This analysis provides a quantitative basis for interpreting the separability of the embedding space learned through metric learning.
We also conducted the same analysis after applying TTA to evaluate its impact on the structure of the embedding space. In particular, a reduction in the mean and standard deviation of distances among genuine pairs suggests that TTA produces more compact embedding representations and enhances the consistency of verification decisions, thereby improving the model’s overall reliability. Such quantitative analysis serves as an important basis for evaluating model robustness under OOD conditions, with the corresponding results presented in Section 4.5.
4.3 Evaluation on the Korean Senior Face Benchmark
We evaluated the performance of the ArcFace [19] model as a baseline on the Korean senior face benchmark, which was introduced in Section 3.1. In addition, we conducted the same experiments not only on ArcFace, but also on AdaFace [50] and TopoFR [22], which differ from ArcFace in their loss functions and training architecture. All experiments followed the standard LFW protocol, which is widely used in the face recognition community, and model performance was quantitatively evaluated in terms of face verification accuracy. We measured accuracy across six datasets, including our Korean senior face benchmark, using the six representative face recognition models with varying backbone architectures and training datasets. Table 2 summarizes the experimental results, enabling a comparative analysis of model performance across different benchmark conditions.
Table 2 Verification accuracy (%) of each model on six benchmarks including our Korean senior face benchmark. Each entry in the method column specifies the training dataset and backbone architecture
| Model | Method | Korean Senior | LFW | AgeDB-30 | CALFW | CPLFW | CFP-FP |
| ArcFace[19] | MS1MV3, R50 | 99.08 | 99.73 | 98.25 | 96.02 | 92.05 | 97.94 |
| MS1MV3, R100 | 99.12 | 99.80 | 98.22 | 95.97 | 92.55 | 98.50 | |
| AdaFace[50] | MS1MV2, R50 | 99.12 | 99.85 | 97.85 | 96.07 | 92.85 | 98.09 |
| MS1MV2, R100 | 99.22 | 99.80 | 98.05 | 96.12 | 93.53 | 98.67 | |
| TopoFR[22] | MS1MV2, R50 | 99.03 | 99.82 | 97.67 | 95.95 | 91.95 | 97.10 |
| MS1MV2, R100 | 99.18 | 99.80 | 98.12 | 96.10 | 92.93 | 98.23 |
As shown in Table 2, all models achieved high verification accuracy, exceeding 99%, on the Korean senior face benchmark. In particular, AdaFace and TopoFR models trained on MS1MV2 and based on the ResNet-100 backbone achieved the best performance, with verification accuracies of 99.22% and 99.18%, respectively. Interestingly, the observed accuracy on our benchmark falls between those of LFW and AgeDB-30, suggesting that the Korean senior face benchmark presents a moderate level of difficulty—challenging enough to differentiate model capacity, yet less demanding than aging-focused benchmarks such as AgeDB-30.
Notably, the proposed benchmark was specifically designed to focus on an underrepresented demographic, namely elderly East Asian individuals, thereby distinguishing it from existing public benchmarks. Whereas existing datasets typically span a broad range of age groups but include relatively few elderly identities and limited East Asian representation, our benchmark provides a more suitable setting for evaluating facial appearance changes associated with aging and ethnicity-specific characteristics. Accordingly, the proposed dataset may serve as an important benchmark not only for improving model performance on elderly populations, but also for addressing the racial and age-related imbalances found in existing face recognition benchmarks.
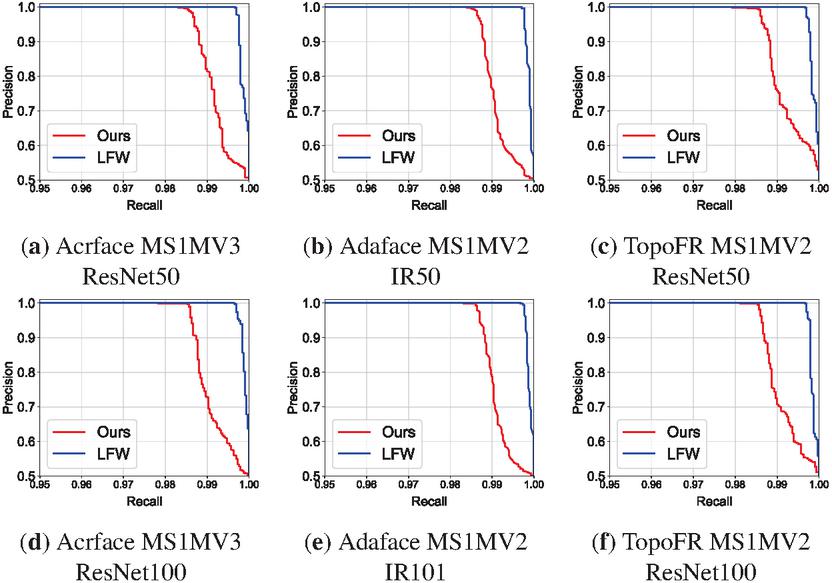
Figure 4 Precision–recall (PR) curves comparing the performance of six face recognition models on our Korean senior celebrity benchmark (red) and the LFW benchmark (blue). Subfigures (a), (d) correspond to ArcFace models, (b), (e) to AdaFace models, and (c), (f) to TopoFR models, each trained on MS1MV2 and MS1MV3 training data. Model names such as IR50 follow the original notations used by the respective model authors.
Figure 4 presents a comparison of PR curves for six face recognition models, evaluated on our Korean senior face benchmark and the LFW dataset. Across all models, the PR curves on the LFW dataset consistently appear higher toward the top right compared to those on our benchmark, indicating higher precision at comparable recall levels. This suggests that our dataset induces lower precision under equivalent recall conditions, reflecting a relatively more challenging evaluation environment. Such analysis has also been adopted in previous works, including RetinaFace [47], WIDER FACE [55] and S3FD [56], where PR curves were employed as effective tools for comparing benchmark difficulty.
In addition, when comparing curve behaviors across models, those with stronger backbones such as ResNet-100 and IR-101 tend to exhibit a more gradual decline in precision, even in high-recall regions (e.g., above 0.99). The PR curves of the TopoFR models (c), (f) and the AdaFace models (b), (e) also exhibit gradual improvements as the backbone changes from ResNet-50 to ResNet-100 (or from IR-50 to IR-101 [53]), indicating that larger model capacity improves robustness against complex variations such as those introduced by aging.
4.4 Benchmark Performance under Image Corruption Scenarios
Image corruptions caused by various environmental factors can degrade the performance of real-world face recognition systems, particularly under conditions not encountered during training [57]. This section presents a quantitative analysis of how such corruptions affect model performance and compares the robustness across different benchmark datasets. Through this analysis, we aim to assess the generalization capability of the proposed Korean senior face benchmark under realistic OOD scenarios. To ensure consistency across benchmarks, all experiments were conducted with the same model, TopoFR built on ResNet-100 and trained on MS1MV2.
In this experiment, we selected ten corruption types from the original set of 20, choosing two representative corruptions from each of the five major categories: sensor, movement, occlusion, lighting & weather, and data & processing, to ensure both representativeness and categorical balance. This selection strategy was designed to reflect the diversity of corruption types while maintaining interpretability and reproducibility, and it also serves as the foundation for the TTA experiments introduced in the following section.
4.4.1 Benchmark accuracy under corruption
Table 3 summarizes the results of applying ten selected corruptions, chosen from five major categories, at five severity levels, measuring their impact on the performance of six face recognition benchmarks. Overall, all benchmarks exhibited a decline in accuracy as corruption severity increased, with a distinct trend showing that the drop between levels 4 and 5 was substantially greater than that between levels 1 and 3. For instance, in the Korean senior face benchmark, the average accuracy decreased by an additional 16.12% in the levels 4–5 range compared with the average performance across levels 1–3, which corresponds to approximately 75% of the 21.4% performance drop between level 1 and level 5. Similarly, for LFW, the bulk of the 15.63% drop from level 1 to level 5 occurs within the level 3–5 range, indicating that model performance is particularly sensitive to severe distortions.
Table 3 Verification accuracy (%) of six face recognition benchmarks under ten selected image corruptions, each applied at five severity levels. The same TopoFR model (ResNet-100, MS1MV2) was used for all evaluations to assess the relative robustness of each benchmark under corruption-induced degradation
| Benchmark | Level | Defocus Blur | Pixelate | Zoom blur | Facial distortion | Frost | Spatter | Contrast | Saturate | Gaussian noise | Speckle noise |
| Korean Senior Celebrity | 1 | 97.33 | 98.80 | 98.65 | 92.68 | 97.45 | 98.95 | 98.33 | 99.00 | 98.23 | 98.20 |
| 2 | 94.43 | 98.77 | 98.20 | 88.22 | 93.27 | 98.07 | 97.47 | 99.05 | 96.77 | 97.62 | |
| 3 | 82.18 | 97.45 | 96.67 | 81.28 | 88.72 | 96.50 | 93.85 | 98.93 | 90.70 | 87.93 | |
| 4 | 70.05 | 95.22 | 95.28 | 75.85 | 87.08 | 94.33 | 65.15 | 96.90 | 71.95 | 75.57 | |
| 5 | 64.23 | 91.65 | 92.67 | 69.48 | 84.35 | 86.07 | 52.82 | 96.08 | 64.70 | 66.40 | |
| LFW | 1 | 99.58 | 99.82 | 99.73 | 98.88 | 99.38 | 99.83 | 99.83 | 99.83 | 99.53 | 99.67 |
| 2 | 99.17 | 99.76 | 99.67 | 98.00 | 97.52 | 99.75 | 99.73 | 99.80 | 99.15 | 99.33 | |
| 3 | 94.05 | 99.65 | 99.28 | 94.75 | 93.88 | 99.53 | 99.63 | 99.82 | 99.33 | 94.40 | |
| 4 | 82.93 | 98.74 | 99.10 | 81.75 | 92.48 | 99.27 | 97.62 | 99.27 | 80.45 | 86.33 | |
| 5 | 72.97 | 89.30 | 98.23 | 73.07 | 88.98 | 97.27 | 66.60 | 96.16 | 76.55 | 80.65 | |
| CALFW | 1 | 95.15 | 96.05 | 95.85 | 92.77 | 95.50 | 96.25 | 96.05 | 96.17 | 95.60 | 95.83 |
| 2 | 93.35 | 95.88 | 95.55 | 88.80 | 93.53 | 96.00 | 95.90 | 95.67 | 94.87 | 95.47 | |
| 3 | 79.73 | 95.62 | 94.63 | 82.45 | 90.30 | 95.52 | 95.62 | 95.72 | 91.70 | 90.77 | |
| 4 | 67.73 | 92.28 | 93.45 | 76.20 | 89.53 | 94.97 | 92.77 | 93.00 | 71.80 | 80.98 | |
| 5 | 60.35 | 91.17 | 91.13 | 69.43 | 86.33 | 91.45 | 64.88 | 95.15 | 61.28 | 67.82 | |
| CPLFW | 1 | 90.47 | 93.02 | 92.28 | 89.23 | 90.20 | 93.17 | 92.88 | 92.90 | 90.92 | 91.20 |
| 2 | 88.07 | 93.02 | 91.22 | 86.60 | 86.07 | 91.87 | 92.47 | 92.62 | 89.23 | 90.42 | |
| 3 | 75.58 | 91.98 | 89.47 | 81.75 | 82.03 | 90.03 | 90.20 | 93.00 | 82.12 | 82.83 | |
| 4 | 63.93 | 89.87 | 88.20 | 76.88 | 80.20 | 87.50 | 80.92 | 91.43 | 65.77 | 73.43 | |
| 5 | 56.38 | 86.80 | 85.45 | 71.02 | 74.78 | 81.42 | 56.25 | 90.95 | 58.67 | 63.58 | |
| AgeDB-30 | 1 | 96.20 | 97.92 | 97.33 | 91.73 | 96.25 | 98.22 | 97.92 | 98.28 | 97.10 | 96.47 |
| 2 | 92.53 | 98.05 | 96.63 | 85.55 | 92.98 | 97.60 | 97.60 | 98.18 | 95.48 | 95.58 | |
| 3 | 74.67 | 96.97 | 94.48 | 72.10 | 89.08 | 95.88 | 96.85 | 98.07 | 88.98 | 89.32 | |
| 4 | 60.23 | 93.78 | 92.75 | 64.57 | 87.15 | 94.93 | 90.38 | 97.15 | 70.65 | 79.45 | |
| 5 | 54.45 | 88.93 | 88.63 | 58.95 | 82.43 | 88.88 | 65.68 | 96.28 | 61.35 | 66.22 | |
| CFP-FP | 1 | 95.41 | 98.07 | 97.34 | 92.81 | 95.51 | 98.36 | 97.99 | 98.19 | 96.63 | 96.53 |
| 2 | 91.11 | 98.07 | 96.17 | 88.22 | 90.51 | 97.30 | 97.67 | 97.90 | 94.10 | 95.10 | |
| 3 | 73.11 | 97.45 | 94.44 | 83.67 | 84.71 | 95.37 | 96.24 | 98.09 | 88.59 | 89.49 | |
| 4 | 62.84 | 93.40 | 91.94 | 75.85 | 84.66 | 92.21 | 88.13 | 96.90 | 73.50 | 82.37 | |
| 5 | 58.31 | 89.30 | 88.84 | 69.48 | 81.49 | 85.71 | 63.37 | 96.16 | 64.91 | 69.84 |
When comparing performance degradation across benchmarks, LFW exhibited the most stable performance, with a maximum drop of 15.7%, whereas AgeDB-30 showed the largest degradation with a 22.3% drop. The proposed Korean senior celebrity benchmark experienced a 21.4% decrease, displaying a robustness level comparable to CPLFW and CFP-FP. This suggests that despite being composed primarily of elderly individuals, the benchmark maintains relatively consistent performance even under common corruption conditions.
Among the corruption types, physical and lighting-based distortions such as Gaussian noise, defocus blur, and contrast had the most severe impact on performance, whereas digital artifacts like saturate and pixelate resulted in relatively smaller degradation. Notably, contrast corruption caused more than a 20% drop in accuracy on the CPLFW benchmark at level 5, highlighting the considerable variation in performance degradation across different types of corruption.
4.4.2 Embedding shift under corruption
Table 4 summarizes the effects of 10 types of image corruption on embedding distance and standard deviation between face pairs in the CPLFW dataset. In face recognition, smaller embedding distances for genuine pairs and larger distances for imposter pairs indicate higher discriminative ability, while the standard deviation reflects the consistency and stability of the feature representation distribution. This analysis is based on the CPLFW benchmark, which showed the greatest extent of performance degradation across different corruption severity levels, making it a representative case for observing performance changes under OOD conditions. In the original CPLFW setting, the average embedding distance was 0.560 for genuine pairs and 0.995 for imposter pairs, with standard deviations of 0.200 and 0.069, respectively. This experiment was conducted using the TopoFR model with a ResNet-100 backbone trained on the MS1MV2 dataset.
Table 4 Embedding distance and standard deviation for genuine and imposter pairs on the CPLFW dataset under ten selected image corruption types, each applied at three severity levels (1, 3, 5). The evaluation was conducted using the TopoFR model with a ResNet-100 backbone trained on MS1MV2. Two corruption types were selected from each of five major categories, and the table summarizes the extent of representational shift under each corruption condition. Std Dev stands for standard deviation
| Metric | Level | Pair | Defocus Blur | Pixelate | Zoom Blur | Facial Distortion | Frost | Spatter | Contrast | Saturate | Gaussian Noise | Speckle Noise |
| Distance | 1 | Genuine | 0.632 | 0.627 | 0.636 | 0.588 | 0.654 | 0.562 | 0.583 | 0.567 | 0.572 | 0.701 |
| Imposter | 0.989 | 0.989 | 0.989 | 0.985 | 0.992 | 0.996 | 0.994 | 0.995 | 0.995 | 0.967 | ||
| 3 | Genuine | 0.698 | 0.698 | 0.730 | 0.634 | 0.776 | 0.671 | 0.643 | 0.577 | 0.620 | 0.731 | |
| Imposter | 0.916 | 0.925 | 0.897 | 0.961 | 0.966 | 0.985 | 0.988 | 0.995 | 0.992 | 0.908 | ||
| 5 | Genuine | 0.495 | 0.626 | 0.573 | 0.680 | 0.800 | 0.748 | 0.637 | 0.651 | 0.705 | 0.687 | |
| Imposter | 0.555 | 0.734 | 0.616 | 0.942 | 0.941 | 0.941 | 0.685 | 0.988 | 0.965 | 0.803 | ||
| Std Dev | 1 | Genuine | 0.181 | 0.181 | 0.184 | 0.193 | 0.177 | 0.197 | 0.193 | 0.197 | 0.194 | 0.141 |
| Imposter | 0.071 | 0.069 | 0.072 | 0.071 | 0.070 | 0.068 | 0.069 | 0.068 | 0.068 | 0.071 | ||
| 3 | Genuine | 0.132 | 0.138 | 0.148 | 0.182 | 0.140 | 0.167 | 0.184 | 0.191 | 0.184 | 0.116 | |
| Imposter | 0.101 | 0.098 | 0.098 | 0.074 | 0.083 | 0.070 | 0.073 | 0.069 | 0.070 | 0.085 | ||
| 5 | Genuine | 0.116 | 0.136 | 0.141 | 0.169 | 0.127 | 0.134 | 0.196 | 0.173 | 0.156 | 0.112 | |
| Imposter | 0.127 | 0.146 | 0.133 | 0.079 | 0.097 | 0.089 | 0.203 | 0.070 | 0.078 | 0.107 |
Under corrupted conditions, the average distance between genuine pairs generally increases to above 0.6, while the standard deviation consistently decreases to the range 0.11–0.19. Notably, under frost corruption at level 5, the average distance of genuine pairs increases to 0.800 and the standard deviation decreases to 0.127, representing one of the most severe cases of embedding space distortion. This indicates that corruption causes features of the same identity to drift farther apart in the embedding space, while simultaneously inducing a tighter overall distribution.
In contrast, for imposter pairs, the average distance generally remains above 0.9 across most corruption conditions, suggesting that these corruptions have relatively limited impact on the representational separation between different identities. The standard deviation also stays within the range of approximately 0.07 to 0.09, and the distributional compression observed in genuine pairs is not clearly present. However, as corruption severity increases, certain exceptions to this pattern emerge. For instance, under level 5 corruption, defocus blur and zoom blur reduce the average distance of imposter pairs to 0.555 and 0.616, respectively, indicating an abnormal convergence of embeddings across different identities. This implies that, under severe corruption, the model may struggle to distinguish between identities, resulting in overly similar embeddings and a heightened risk of representational confusion. Thus, although imposter pairs tend to maintain relatively stable distributions under mild corruption, higher severity levels can distort inter-class distances and increase the likelihood of false positives.
An analysis of how different types of image corruption affect embedding distances and distributional stability revealed distinct distortion patterns for each corruption category. In the sensor category, pixelate maintained relatively stable distances and reduced variance, while defocus blur decreased the distance of imposter pairs to 0.616, thereby increasing the risk of false positives. Corruptions in the movement category, such as zoom blur and facial distortion, exhibited gradual changes in both distance and standard deviation as severity increased, suggesting a progressive distortion pattern that entails both stability and potential risk. Occlusion-based corruptions, namely frost and spatter, led to significant dispersion, increasing genuine pair distances to 0.800 and 0.748, respectively, and implying a higher likelihood of false negatives. Within the lighting & weather category, contrast resulted in the highest retained variance, whereas saturate demonstrated stable convergence in both distance and variance. Lastly, in the data & processing category, Gaussian noise and speckle noise caused sharp reductions in distances for both genuine and imposter pairs, identifying them as the most margin-vulnerable corruption types in the embedding space.
4.5 Results on Test-time Adaptation
4.5.1 Effectiveness of test-time adaptation on the Korean senior face benchmark
Table 5 presents the quantitative analysis of how much the proposed TTA method can improve face recognition performance under image corruption conditions when applied to the Korean senior face benchmark. The experiments were conducted using the TopoFR model (ResNet-100 backbone trained on MS1MV2) and compared the results with and without applying TTA on the same OOD dataset.
Table 5 Verification accuracy (%) of the Korean senior face benchmark under 10 selected image corruption types. Each corruption was applied at three severity levels, and results were evaluated with and without the proposed TTA method. TTA experiments were conducted using the TopoFR model, which employs a ResNet-100 backbone trained on MS1MV2, under varying optimization steps (1 and 3) and batch sizes (16, 32, and 48). Entries in bold indicate cases where applying TTA led to a clear improvement over the baseline
| Corruption Level | Optimization Step | Batch Size | Defocus Blur | Pixelate | Zoom Blur | Facial Distortion | Frost | Spatter | Contrast | Saturate | Gaussian Noise | Speckle Noise |
| 1 | original | 97.116 | 98.433 | 98.6 | 93.2 | 97.516 | 99.083 | 98.433 | 99.05 | 98.05 | 97.866 | |
| 1 | 16 | 95.95 | 98.616 | 98.466 | 92.383 | 97.25 | 98.916 | 98.866 | 99.0 | 97.916 | 97.816 | |
| 32 | 96.1 | 98.616 | 98.583 | 92.433 | 97.433 | 98.933 | 98.916 | 98.966 | 97.966 | 97.816 | ||
| 48 | 96.25 | 98.666 | 98.583 | 92.616 | 97.566 | 98.933 | 98.933 | 98.983 | 98.0 | 97.95 | ||
| 3 | 16 | 94.416 | 98.166 | 97.816 | 90.783 | 96.05 | 98.383 | 98.216 | 98.6 | 97.016 | 96.866 | |
| 32 | 94.366 | 98.25 | 97.783 | 90.75 | 96.266 | 98.533 | 98.283 | 98.616 | 97.05 | 97.133 | ||
| 48 | 94.283 | 98.133 | 97.866 | 91.166 | 96.166 | 98.45 | 98.25 | 98.533 | 97.116 | 97.033 | ||
| 3 | original | 78.616 | 97.533 | 96.55 | 82.233 | 87.033 | 95.983 | 92.016 | 99.016 | 88.433 | 85.183 | |
| 1 | 16 | 71.95 | 97.45 | 96.53 | 80.883 | 87.166 | 95.133 | 97.466 | 98.783 | 91.866 | 90.916 | |
| 32 | 72.633 | 97.516 | 96.6 | 81.7 | 87.516 | 95.383 | 97.666 | 98.85 | 92.1 | 91.266 | ||
| 48 | 72.616 | 97.583 | 96.633 | 81.616 | 87.6 | 95.383 | 97.766 | 98.9 | 92.233 | 91.3 | ||
| 3 | 16 | 69.783 | 96.266 | 94.566 | 78.716 | 85.05 | 93.85 | 96.483 | 98.3 | 89.816 | 88.933 | |
| 32 | 69.966 | 96.35 | 94.8 | 79.166 | 85.166 | 94.0 | 96.6 | 98.416 | 89.95 | 89.133 | ||
| 48 | 69.016 | 96.283 | 94.683 | 79.65 | 85.6 | 94.083 | 96.65 | 98.416 | 90.2 | 89.166 | ||
| 5 | original | 65.616 | 89.75 | 92.383 | 70.166 | 82.75 | 84.1 | 55.35 | 96.166 | 60.65 | 62.566 | |
| 1 | 16 | 64.233 | 89.066 | 89.966 | 71.633 | 83.133 | 81.016 | 77.583 | 95.683 | 72.966 | 78.733 | |
| 32 | 64.083 | 89.183 | 90.183 | 71.533 | 83.683 | 81.683 | 77.85 | 95.883 | 73.333 | 79.416 | ||
| 48 | 63.85 | 89.25 | 90.366 | 71.183 | 83.85 | 81.883 | 78.316 | 96.066 | 73.766 | 79.583 | ||
| 3 | 16 | 62.766 | 86.683 | 87.216 | 70.2 | 81.383 | 79.766 | 76.1 | 94.366 | 71.533 | 76.75 | |
| 32 | 62.516 | 87.05 | 86.8 | 69.933 | 81.583 | 80.3 | 75.933 | 94.333 | 71.883 | 77.666 | ||
| 48 | 62.25 | 87.033 | 87.183 | 70.3 | 81.783 | 80.65 | 77.016 | 94.583 | 72.033 | 77.766 |
In this experiment, batch sizes of 16, 32, and 48 were applied, and the performance improvement generally increased as the batch size grew across various corruption conditions. Moreover, at each corruption level, the configuration with an optimization step of 1 consistently yielded the most noticeable improvements in accuracy. This suggests that the statistical stability provided by larger mini-batches may more effectively guide the alignment of the embedding space.
Among the 10 evaluated corruption types, all but defocus blur, pixelate, and spatter showed noticeable improvements in accuracy compared to the baseline. In particular, significant gains were observed under Gaussian noise, contrast, and zoom blur. For example, under Gaussian noise at level 5, the baseline performance was 60.65%, which improved to 73.77% after applying TTA (step = 1, batch size = 48), representing an improvement of about 21.6%. Similarly, for contrast corruption at the same severity level, accuracy increased from 55.35% to 78.32%, yielding a gain of roughly 41.5%. In contrast, corruption types such as spatter, saturate, and defocus blur exhibited only limited improvement or even slight degradation under certain settings. These results suggest that TTA does not universally benefit all corruption types but rather exhibits variation in performance outcomes depending on the nature of feature distortion induced by each corruption.
Additionally, when focusing on corruption types where the effect of TTA was particularly prominent under the highest severity level, it is notable that both Gaussian noise and contrast fall into the category of distortions characterized by continuous pixel-level noise or illumination alterations. Such corruptions are likely to induce density contraction or directional distortion in the feature embedding space, and TTA appears to effectively mitigate these deformations by realigning the feature representations.
Meanwhile, the effect of the optimization step size also proved to be significant. Under the same batch size conditions, the configuration with a step size of 1 consistently outperformed that with a step size of 3, suggesting that excessive adaptation may actually destabilize the embedding space. Further experiments exploring the impact of larger optimization steps will be discussed in the following analysis.
These findings quantitatively demonstrate that applying TTA in the face recognition task can lead to substantial performance improvements, particularly showing that even a simple configuration (step = 1, batch size 16) can achieve stable and reliable accuracy gains under corruption conditions. This suggests the practical potential of TTA as a lightweight and effective strategy in real-world environments, and the next section will further analyze the performance variations under different TTA configurations.
4.5.2 Effect of optimization step size on TTA performance
Table 6 presents a quantitative analysis of how variations in the number of optimization steps during TTA affect face recognition accuracy under OOD conditions, using the CALFW benchmark with level 1 image corruptions applied. All experiments were conducted under a fixed batch size of 48, using the TopoFR model with a ResNet-50 backbone trained on the Glint360K dataset. The goal of this experiment is to isolate the optimization step as a single variable and closely examine its influence on TTA performance.
Table 6 Verification accuracy (%) on the CALFW benchmark under 10 selected image corruption types (level 1), evaluated with varying optimization step sizes during TTA. The batch size was fixed at 48, and the experiments were conducted using the TopoFR model (ResNet-50 backbone trained on Glint360K). Entries in bold indicate cases where TTA led to clear improvements over the baseline (original) within each corruption category
| Optimization Step | Defocus Blur | Pixelate | Zoom Blur | Facial Distortion | Frost | Spatter | Contrast | Saturate | Gaussian Noise | Speckle Noise |
| original | 95.566 | 96.133 | 96.100 | 93.233 | 95.733 | 96.200 | 96.016 | 96.166 | 95.950 | 95.966 |
| 1 | 95.133 | 96.200 | 96.016 | 93.416 | 95.633 | 96.350 | 96.233 | 96.366 | 96.083 | 96.050 |
| 5 | 94.833 | 96.083 | 95.933 | 92.883 | 95.366 | 96.200 | 95.983 | 96.250 | 95.700 | 95.850 |
| 10 | 94.333 | 95.950 | 95.816 | 92.200 | 94.016 | 96.100 | 95.216 | 96.116 | 94.400 | 95.533 |
The experimental results show that, across all corruption types, the configuration with a single optimization step (step = 1) consistently yielded the highest performance, while increasing the number of steps led to a gradual decline in accuracy. For instance, under the defocus blur corruption, step = 1 achieved an accuracy of 95.13%, whereas step = 5 and step = 10 resulted in lower scores of 94.83% and 94.33%, respectively. This trend was consistently observed across other corruption types such as pixelate, zoom blur, and frost. These findings suggest that excessive adaptation can destabilize the embedding space and ultimately degrade generalization performance.
In other words, a single lightweight update (step = 1) is sufficient to induce stable performance improvements, indicating that this simple configuration can serve as an effective guideline for applying TTA in a way that maintains accuracy gains while avoiding overfitting.
4.5.3 Effect of batch size on TTA performance
Table 7 presents a quantitative analysis of how variations in batch size affect face recognition accuracy during TTA under OOD conditions, with level 1, 3, and 5 image corruptions applied to the AgeDB benchmark. All experiments were conducted with the optimization step fixed at 1, using the TopoFR model based on a ResNet-50 backbone trained on the MS1MV2 dataset. The experiments were designed to compare two batch size settings (48 and 256), analyzing both the baseline (original) performance and the performance after TTA adaptation.
Table 7 Verification accuracy (%) on the AgeDB benchmark under 10 selected image corruption types (levels 1, 3, and 5), evaluated with different batch sizes (48 and 256) during TTA. The experiments were conducted using the TopoFR model with a ResNet-50 backbone trained on MS1MV2, with the optimization step fixed at 1. Original performance without TTA is also included for comparison. Entries in bold indicate cases where TTA resulted in improved performance over the baseline for each corruption category under different batch size settings
| Level | Batch Size | Defocus Blur | Pixelate | Zoom Blur | Facial Distortion | Frost | Spatter | Contrast | Saturate | Gaussian Noise | Speckle Noise |
| 1 | original | 95.556 | 97.716 | 97.350 | 90.616 | 96.266 | 97.833 | 96.983 | 98.000 | 96.750 | 96.466 |
| 48 | 93.333 | 96.766 | 96.633 | 87.850 | 94.266 | 97.066 | 96.966 | 97.216 | 95.466 | 95.533 | |
| 256 | 94.500 | 97.283 | 97.230 | 89.516 | 95.500 | 97.716 | 97.383 | 97.783 | 96.400 | 96.316 | |
| 3 | original | 70.000 | 96.183 | 94.516 | 71.466 | 86.783 | 93.783 | 91.150 | 97.783 | 85.966 | 85.666 |
| 48 | 67.583 | 95.000 | 93.050 | 74.400 | 84.983 | 92.250 | 95.866 | 97.016 | 88.000 | 88.533 | |
| 256 | 69.500 | 95.900 | 94.283 | 76.783 | 86.866 | 93.666 | 96.716 | 97.533 | 89.800 | 90.900 | |
| 5 | original | 54.933 | 83.916 | 89.416 | 59.016 | 81.400 | 83.766 | 56.716 | 95.516 | 60.550 | 65.650 |
| 48 | 56.116 | 84.516 | 87.316 | 64.866 | 79.833 | 80.916 | 76.850 | 94.683 | 70.250 | 76.850 | |
| 256 | 57.750 | 86.516 | 89.366 | 66.483 | 81.600 | 83.316 | 78.933 | 95.916 | 72.700 | 79.466 |
The experimental results show that, across most corruption conditions, using a batch size of 256 either improved or maintained performance compared to a batch size of 48, with the performance gap becoming more pronounced as the corruption severity level increased. For example, under the Gaussian noise corruption at level 5, the baseline accuracy was 60.55%, whereas applying TTA with a batch size of 48 and 256 improved the accuracy to 70.25% and 72.70%, corresponding to gains of 16.0% and 20.1%, respectively.
These findings indicate that a larger batch size allows for more stable estimation of mini-batch statistics, thereby facilitating more effective realignment of the embedding space during TTA. Furthermore, under severe corruption conditions such as level 5, where statistical distortion is intensified, increasing the batch size was found to be a practical strategy to maximize the effectiveness of TTA.
4.5.4 Effect of TTA on embedding distances and stability
Table 8 summarizes the changes in embedding mean distances and standard deviations before and after applying TTA under level 5 corruption on the Korean senior face benchmark. All experiments were conducted using the TopoFR model with a ResNet-100 backbone trained on the MS1MV2 dataset, under fixed conditions of batch size 48 and optimization step 1. The significance of changes in embedding distance and standard deviation lies not in whether the values simply increase or decrease, but in how effectively they help distinguish between genuine and imposter pairs.
Table 8 Embedding mean distances and standard deviations for genuine and imposter pairs on the Korean senior face benchmark under level 5 corruption, before and after applying TTA. The results summarize the mean distance and standard deviation for each corruption type. All evaluations were conducted using the TopoFR model with a ResNet-100 backbone trained on MS1MV2
| Category | Metric | Defocus Blur | Pixelate | Zoom Blur | Facial Distortion | Frost | Spatter | Contrast | Saturate | Gaussian Noise | Speckle Noise |
| Genuine (Before TTA) | Distance | 0.449 | 0.585 | 0.480 | 0.596 | 0.693 | 0.670 | 0.110 | 0.505 | 0.394 | 0.502 |
| Std Dev | 0.127 | 0.126 | 0.127 | 0.098 | 0.138 | 0.113 | 0.085 | 0.127 | 0.131 | 0.149 | |
| Genuine (After TTA) | Distance | 0.754 | 0.563 | 0.482 | 0.802 | 0.725 | 0.762 | 0.751 | 0.516 | 0.788 | 0.744 |
| Std Dev | 0.121 | 0.119 | 0.126 | 0.092 | 0.126 | 0.107 | 0.110 | 0.127 | 0.107 | 0.112 | |
| Imposter (Before TTA) | Distance | 0.543 | 0.867 | 0.802 | 0.701 | 0.906 | 0.869 | 0.122 | 0.903 | 0.452 | 0.594 |
| Std Dev | 0.127 | 0.099 | 0.102 | 0.106 | 0.099 | 0.091 | 0.086 | 0.093 | 0.134 | 0.154 | |
| Imposter (After TTA) | Distance | 0.826 | 0.796 | 0.765 | 0.896 | 0.920 | 0.925 | 0.897 | 0.889 | 0.903 | 0.898 |
| Std Dev | 0.095 | 0.093 | 0.097 | 0.077 | 0.081 | 0.078 | 0.082 | 0.085 | 0.080 | 0.081 |
Analyzing the genuine pairs, we observe that the mean embedding distances notably increased for certain corruption types after applying TTA. In particular, corruptions such as facial distortion, contrast, and Gaussian noise showed significant increases compared to the pre-TTA condition. For example, the mean distance for facial distortion increased from 0.596 to 0.802, and for contrast, from 0.110 to 0.751. This trend suggests that TTA helps alleviate the compression or distortion of feature representations caused by corruption and contributes to a more structured reorganization of the embedding space. In other words, it can be interpreted that TTA prevents excessive clustering of the same identity features and expands the representation space in a meaningful direction, thereby enhancing discriminability and stability.
Meanwhile, the standard deviation of genuine pairs generally decreased or remained at a similar level after applying TTA. For instance, in the case of pixelate corruption, the standard deviation slightly decreased from 0.126 to 0.119. This indicates that even after TTA, the representations of the same identity did not scatter excessively, maintaining a certain degree of stability in the embedding space.
In the case of imposter pairs, the mean embedding distances tended to either remain stable or increase across most corruption types following TTA. For example, under Gaussian noise corruption, the mean distance between imposter pairs substantially increased from 0.452 to 0.903. This suggests that the feature space between different individuals became more distinctly separated, which can positively contribute to reducing the risk of false positive errors.
In addition, the standard deviation of imposter pairs also tended to decrease overall after applying TTA. For instance, in the case of spatter corruption, the standard deviation decreased from 0.091 to 0.078. This suggests that the representations of different individuals became more consistently aligned, contributing to increased stability of the embedding space.
In particular, the contrast corruption provides a highly illustrative case. Before applying TTA, the mean distances for genuine and imposter pairs were 0.110 and 0.122, respectively, indicating that the feature representations were almost indistinguishable. This suggests that under level 5 corruption severity, the contrast transformation severely degraded the facial feature representations. However, after applying TTA, the embedding distances between genuine and imposter pairs became clearly separated, contributing to the effective reconstruction of the corrupted representation space and the restoration of discriminability. These results demonstrate that the TTA method has the potential to recover the stability and separability of feature representations even under severe corruption conditions.
In summary, this analysis empirically demonstrates that the TTA method can effectively reorganize the embedding space under corrupted OOD conditions by maintaining a balanced concentration and diversity of genuine feature representations while enhancing the separability of imposter representations. This supports the notion that TTA not only improves recognition accuracy but also contributes to the stabilization and strengthening of the underlying feature representation structure itself.
5 Conclusion
This study tackles two critical challenges that impede the robust deployment of face-recognition systems in Web 3.0 environments. The first is the demographic bias of existing benchmarks, whose limited representation of elderly East-Asian users hampers fair and personalized service delivery. The second is the sharp performance drop that models suffer under out-of-distribution (OOD) conditions caused by real-world image corruptions, a threat that becomes more serious in the decentralized settings of Web 3.0.
To address these challenges, we (1) built the Korean Senior Face Benchmark, composed of facial images of senior Korean celebrities, thereby complementing the demographic skew of earlier datasets and enabling realistic evaluation for elderly East-Asian users; (2) quantitatively confirmed that state-of-the-art models experience severe degradation under realistic corruptions, underscoring the need for greater robustness; and (3) we demonstrated the practicality of lightweight test-time adaptation (TTA) for embedding-based face recognition, showing that updating only batch-normalization statistics can effectively restore OOD performance without altering model weights. Because this lightweight scheme requires no centralized retraining, it can be embedded directly in edge devices and distributed infrastructures, thereby offering clear privacy benefits.
Nevertheless, our work has limitations. The benchmark currently covers only Korean seniors, which may restrict the generality of our findings. In addition, the corruption types we evaluated do not exhaust the spectrum of OOD scenarios that may occur in real Web 3.0 deployments, so the observed TTA gains might be condition-specific. Future work will (i) extend the benchmark to include elderly subjects from other East-Asian countries such as Japan and China to improve demographic coverage; (ii) systematically compare and optimize multiple TTA methods that can operate on resource-constrained edge devices; and (iii) design privacy-preserving adaptation mechanisms that share only minimal statistics, enabling truly decentralized identity management for Web 3.0.
Acknowledgement
This research was supported by the National Research Foundation of Korea(NRF) grant funded by the Korea government(MSIT)(RS-2025-00521602, 19%), Institute of Information & communications Technology Planning & Evaluation (IITP) & ITRC(Information Technology Research Center) grant funded by the Korea government(MSIT) (No.RS-2019-II190079, Artificial Intelligence Graduate School Program(Korea University), 1%; IITP-2025-RS-2024-00436857, 10%), the Technology development Program(RS-2025-02413513,10%;RS-2024-00511120,10%) funded by the Ministry of SMEs and Startups(MSS, Korea), Korea Technology and Information Promotion Agency for SMEs (TIPA) grant funded by the Ministry of SMEs and Startups (RS-2022-TI016471; RS-2024-00468462), the National IT Industry Promotion Agency (NIPA) grant funded by the Ministry of Science and ICT (SW High-Growth Club Preliminary High-Growth Support Project, Project Name: Market expansion for physical education of Muslim female students through super-gap AI software), and Artificial intelligence industrial convergence cluster development project funded by the Ministry of Science and ICT(MSIT, Korea)&Gwangju Metropolitan City.
Ethics
This work does not involve any human-subject research or collection of personal data. All facial images used in this study were obtained from publicly available sources featuring well-known public figures. However, due to potential copyright issues related to news articles and media content, the constructed dataset cannot be publicly released.
References
[1] Zhang, Y., Y. Mirei, S. Masahiro, and K. Shoji. 2020. Attribute-Based Access Control for Smart Cities: A Smart Contract-Driven Framework. IEEE Internet of Things Journal. 8(8): 6372–6384. doi: \nolinkurl10.1109/JIOT.2020.3033434.
[2] Nita, S. L., and M. I. Mihailescu. 2024. A Novel Authentication Scheme Based on Verifiable Credentials Using Digital Identity in the Context of Web 3.0. Electronics. 13(6): 1137. doi: \nolinkurl10.3390/electronics13061137.
[3] Yu, T., M. P. Kowalski, L. T. Shackelford, D. C. Brooks and J. M. Ennis. 2024. Using Web3 technologies to represent personalized consumer taste preferences in whiskies. Food Quality and Preference. 118:105–201. doi: \nolinkurl10.1016/j.foodqual.2024.105201.
[4] Asif, M., Z. Aziz, M. B. Ahmad, A. Khalid, H. A. Waris and A. Gilani. 2022. Blockchain-Based Authentication and Trust Management Mechanism for Smart Cities. Sensors. 22(7): 2604. doi: 10.3390/s22072604
[5] Karkkainen, K., and J. Jungseock. 2021. FairFace: Face attribute dataset for balanced race, gender, and age for bias measurement and mitigation. In Proceedings of the IEEE/CVF Winter Conference on Applications of Computer Vision (WACV). p. 1547–1557.
[6] Wang, M., W. Deng, J. Hu, X Tao, and Y. Huang. 2020. Racial faces in the wild: Reducing racial bias by information maximization adaptation network. In: Proceedings of the IEEE/CVF International Conference on Computer Vision (ICCV). p. 692–702.
[7] Dobbala, M. K., and M. S. S. Lingolu. 2024. Enhancing usability for everyone through web accessibility compliance. J Comput Sci Software Dev. 3: 1–13. doi: \nolinkurl10.17303/jcssd.2024.3.105.
[8] Gorodishchev, A. V., A. N. Gorodishcheva, D. O. Baigozhina, and G. P. Kovalev. 2023 Web 3.0 Credibility: Principles for Ranking Media Sources. In Proceeding of the 2023 Communication Strategies in Digital Society Seminar (ComSDS). p. 184–188.
[9] Wang, D., E. Shelhamer, S. Liu, B. Olshausen, and T. Darrell. 2021. Tent: Fully test-time adaptation by entropy minimization. Poster session presented at: The Ninth International Conference on Learning Representations (ICLR)
[10] Taigman, Y., M. Yang, MA. Ranzato, and L. Wolf. 2014. DeepFace: Closing the gap to human-level performance in face verification. In Proceedings of the IEEE Conference on Computer Vision and Pattern Recognition (CVPR). p. 1701–1708.
[11] Sun, Y., Y. Chen, X. Wang, and X. Tang. 2014. Deep learning face representation by joint identification-verification. In Proceedings of international Conference on Neural Information Processing Systems (NIPS). p. 1988–1996.
[12] Schroff, F., D. Kalenichenko, and J. Philbin. 2015 FaceNet: A unified embedding for face recognition and clustering. In Proceedings of the IEEE Conference on Computer Vision and Pattern Recognition (CVPR). p. 815–823.
[13] Sohn, K. 2016. Improved deep metric learning with multi-class n-pair loss objective. In Proceedings of the 30th International Conference on Neural Information Processing Systems (NIPS) p. 1857–1867.
[14] Wen, Y., K. Zhang, Z. Li, and Y. Qiao. 2016. A discriminative feature learning approach for deep face recognition. In Computer Vision – ECCV 2016 : 14th European Conference (ECCV). p. 499–515.
[15] Liu, W., Y. Wen, Z. Yu, and M. Yang. 2016. Large-margin softmax loss for convolutional neural networks. In Proceedings of the 33rd International Conference on Machine Learning (ICML). p. 507–516.
[16] Wang, F., W. Liu, H. Liu, and J. Cheng. 2018 Additive margin softmax for face verification. IEEE Signal Process Letters. 25(7): 926–-930. doi: \nolinkurl10.1109/lsp.2018.2822810.
[17] Liu. W., Y. Wen, Z. Yu, M Li, B. Raj, and L. Song. 2017. SphereFace: Deep hypersphere embedding for face recognition. In Proceedings of the IEEE Conference on Computer Vision and Pattern Recognition (CVPR). p. 6738–6746.
[18] Wang, H., Y. Wang, Z. Zhou, X. Ji, D. Gong, J. Zhou, Z. Li, and W. Liu. 2018. CosFace: Large margin cosine loss for deep face recognition. In Proceedings of the IEEE Conference on Computer Vision and Pattern Recognition (CVPR) p. 5265–5274.
[19] Deng, J., J. Guo, N. Xue, and S. Zafeiriou. 2020. ArcFace: Additive angular margin loss for deep face recognition. In Proceedings of the IEEE/CVF Conference on Computer Vision and Pattern Recognition (CVPR). p. 4685–4694.
[20] Dan, J., Y. Liu, H. Xie, J. Deng, H. Xie, X. Xie, and B. Sun. 2024. Transface: Calibrating transformer training for face recognition from a data-centric perspective. In Proceedings of the IEEE/CVF International Conference on Computer Vision (ICCV) p. 20585–20596.
[21] Dosovitskiy, A., L. Beyer, A. Kolesnikov, D. Weissenborn, X. Zhai, T. Unterthiner, et al. 2020. An image is worth 16×16 words: Transformers for image recognition at scale. In Proceedings of the Eighth International Conference on Learning Representations (ICLR). p. 11960–11973.
[22] Dan, J., Y. Liu, J. Deng, H. Xie, S. Li, B. Sun, et al. 2024. TopoFR: A closer look at topology alignment on face recognition. In Advances in Neural Information Processing Systems (NeurIPS). 34: 37213–37240.
[23] Kemelmacher-Shlizerman, I., S. Seitz, D. Miller, and E. Brossard. 2016. MegaFace: A million faces for recognition at scale. arXiv preprint arXiv:1505.02108.
[24] Sharma, S., A. Saini, and S. Chaudhury. 2024. Multimodal biometric user authentication using improved decentralized fuzzy vault scheme based on Blockchain network. Journal of Information Security and Applications (JISA). 82:103740. doi: \nolinkurl10.1016/j.jisa.2024.103740.
[25] Saypadith, S., and S. Aramvith. 2018. Real-Time Multiple Face Recognition using Deep Learning on Embedded GPU System. In Proceedings of the 2018 Asia-Pacific Signal and Information Processing Association Annual Summit and Conference (APSIPA ASC). p. 1318–1324.
[26] Bai, J., X. Zhang, X. Song, H. Shao, Q. Wang, S. Cui, and G. Russello. 2023. CryptoMask: Privacy-preserving face recognition. In Proceedings of the International Conference on Information and Communications Security (ICICS). p. 333–350.
[27] Bradwell, H. L., K. J. Edwards, R. Baines, T. Page, A. Chatterjee, and R. B. Jones. 2023. Facial recognition lock technology for social care settings: A qualitative evaluation of implementation of facial recognition locks at two residential care sites. Frontiers in Digital Health. 5:1066327. doi: \nolinkurl10.3389/fdgth.2023.1066327.
[28] Hsieh, W.-B. 2025. BF-ACS—Intelligent and Immutable Face Recognition Access Control System. IET Information Security. 2025(1):6755170. doi: 10.1049/ise2.2025.0012.
[29] Garg, A., D. Dixit, A. Khanna, and S. Doss. 2020. UI Personalization using Face Recognition and Machine Learning. In Proceedings of the International Conference on Innovative Computing & Communications (ICICC).
[30] Huang, G. B., M. Mattar, T. Berg, and E. Learned-Miller. 2008. Labeled Faces in the Wild: A database for studying face recognition in unconstrained environments. Paper session presented at: Workshop on Faces in ‘Real-Life’ Images: Detection, Alignment, and Recognition;
[31] Maze, B., Adams, J. A. Duncan J, N. Kalka, T. Miller, C. Otto, et al. 2018. IARPA Janus Benchmark-C: Face dataset and protocol. In: Proceedings of the 2018 International Conference on Biometrics (ICB); p. 158–165.
[32] Zheng T, W. Deng, and J. Hu. 2017. Cross-age LFW: A database for studying cross-age face recognition in unconstrained environments. arXiv preprint arXiv:1708.08197.
[33] Zheng, T., and W. Deng. 2018. Cross-pose LFW: A database for studying cross-pose face recognition in unconstrained environments. :Beijing University of Posts and Telecommunications. 5(7); 5.
[34] Moschoglou, S., A. Papaioannou, C. Sagonas, J. Deng, I. Kotsia, S. Zafeiriou. 2017. AgeDB: The first manually collected, in-the-wild age database. In Proceedings of the IEEE Conference on Computer Vision and Pattern Recognition Workshops (CVPRW). p. 1997–2005.
[35] Sengupta, S., JC. Chen, C. Castillo, V. M. Patel, R. Chellappa, and D. W. Jacobs. 2016. Frontal to profile face verification in the wild. In Proceedings of the IEEE winter conference on applications of computer vision (WACV). p. 1–9.
[36] Ryu, H. J., H. Adam, and M. Mitchell. 2017. InclusiveFaceNet: Improving face attribute detection with race and gender diversity. arXiv preprint arXiv:1712.00193.
[37] Venkatasalam, K., K. K. Dhanush, S. Dharun, J. Hemanthraj, and S. Irayanbu. 2024. AI-assisted missing person finder and face recognition using FaceNet algorithm. ShodhKosh: Journal of Visual and Performing Arts. 5(5): 1027–1033. doi: \nolinkurl10.29121/shodhkosh.v5.i5.2024.2670.
[38] Phan, H., C. X. Le, V. Le, Y. He, and A. T. Nguyen. 2024. Fast and interpretable face identification for out-of-distribution data using vision transformers. In Proceedings of the IEEE/CVF Winter Conference on Applications of Computer Vision (WACV). p. 6289–6299.
[39] Hendrycks, D., and T. Dietterich. 2019. Benchmarking neural network robustness to common corruptions and perturbations. Poster session presented at: The Seventh International Conference on Learning Representations (ICLR).
[40] Kang, C., Y. Chen, S. Ruan, S. Zhao, R. Zhang, J. Wang, S. Fu, and X. Wei. 2024. OODFace: Benchmarking robustness of face recognition under common corruptions and appearance variations. arXiv preprint arXiv:2412.02479.
[41] Neto, P. C., J. R. Pinto, F. Boutros, N. Damer, A. F. Sequeira, and J. S. Cardoso. 2022. Beyond masks: On the generalization of masked face recognition models to occluded face recognition. IEEE Access. 10: 86222–-86233. doi: \nolinkurl10.1109/ACCESS.2022.3199014.
[42] Mirza, M. J., J. Micorek, H. Possegger, and H. Bischof. 2022. The norm must go on: Dynamic unsupervised domain adaptation by normalization. Proceedings of the IEEE/CVF conference on computer vision and pattern recognition (CVPR). p. 14765–14775.
[43] Jang, M., S. Y. Chung, and H. W. Chung. 2023. Test-time adaptation via self-training with nearest neighbor information. The Eleventh International Conference on Learning Representations (ICLR).
[44] Chen, C., P. Zhang, H. Zhang, J. Dai, Y. Yi, H. Zhang, and Y. Zhang. 2020. Deep learning on computational-resource-limited platforms: A survey. Mobile Information Systems. 2020: 8454327. doi: \nolinkurl10.1155/2020/8454327.
[45] Hu, K., S. Gong, Q. Zhang, C. Seng, M. Xia, and S. Jiang. 2024. An overview of implementing security and privacy in federated learning. Artificial Intelligence Review. 57: 204. doi: \nolinkurl10.1007/s10462-024-10846-8.
[46] Sumsion, A, S. Torrie, D. J. Lee, and Z. Sun. 2024. Surveying racial bias in facial recognition: Balancing datasets and algorithmic enhancements. Electronics. 13(12): 2317. doi: \nolinkurl10.3390/electronics13122317.
[47] Deng, J., J. Guo, E. Ververas, I. Kotsia, and S. Zafeiriou. 2020. RetinaFace: Single-Shot Multi-Level Face Localisation in the Wild. Proceedings of the IEEE/CVF conference on computer vision and pattern recognition (CVPR). p. 5203–5212.
[48] Jing, M., X. Zhen, J. Li, and C. G. M. Snoek. 2022. Variational model perturbation for source-free domain adaptation. Advances in Neural Information Processing Systems. 35: 17173–17187.
[49] Yi, L., G. Xu, P. Xu, J. Li, R. Pu, C. Ling, L. McLeod, and B. Wang. 2023. When source-free domain adaptation meets learning with noisy labels The Eleventh International Conference on Learning Representations (ICLR).
[50] Kim, M., A. K. Jain, and X. Liu. 2022. AdaFace: Quality adaptive margin for face recognition. Proceedings of the IEEE/CVF Conference on Computer Vision and Pattern Recognition (CVPR). p. 18750–18759.
[51] Guo, Y., L. Zhang, Y. Hu, X. He, and J. Gao. 2016. MS-Celeb-1M: A dataset and benchmark for large-scale face recognition. In Computer Vision – ECCV 2016 : 14th European Conference (ECCV). p. 87–102.
[52] He, K., X. Zhang, S. Ren, and J. Sun. 2016. Deep residual learning for image recognition. Proceedings of the IEEE/CVF conference on computer vision and pattern recognition (CVPR). p. 770–778.
[53] Duta, I. C., L. Liu, F. Zhu, and L. Shao. 2021. Improved residual networks for image and video recognition. Proceedings of International Conference on Pattern Recognition (ICPR). p. 9415–9422.
[54] Michaelis, C., B. Mitzkus, R. Geirhos, E. Rusak, O. Bringmann, A. S. Ecker, M. Bethge, and W. Brendel. 2019. Benchmarking Robustness in Object Detection: Autonomous Driving when Winter is Coming. arXiv preprint arXiv:1907.07484.
[55] Yang, S., P. Luo, C. C. Loy, and X. Tang. 2016. Wider face: A face detection benchmark. Proceedings of the IEEE/CVF conference on computer vision and pattern recognition (CVPR). p. 5525–5533.
[56] Zhang, S., X. Zhu, Z. Lei, H. Shi, X. Wang, and S. Z. Li. 2017. S3fd: Single shot scale-invariant face detector. In Proceedings of the IEEE/CVF International Conference on Computer Vision (ICCV). p. 192–201.
[57] Anwar, A., and A. Raychowdhury. 2020. Masked face recognition for secure authentication. arXiv preprint arXiv:2008.11104.
Biographies

Dongyoon Seo received his bachelor’s degree in Global School of Media from Soongsil University, Seoul, Korea. He is currently pursuing his M.Sc. degree in Artificial Intelligence at Korea University, Seoul, Korea. He is also serving as a senior researcher at Complexion Co., Ltd. His research interests include face recognition, human pose estimation, and object detection.

Taebeom Lee received his bachelor’s degree in AI Big Data & Management from Kookmin University, Korea in 2024. He is currently a master’s student in Artificial Intelligence at Korea University, Korea. His current research interests include human–computer interaction, human pose estimation, and generative models.

Jeongyoon Yoon received his bachelor’s degree in Computer Science and Engineering from Dongguk University, Seoul, Korea in 2025. His current research interests include face recognition, 3D reconstruction, and motion estimation.

Chiho Park is the CEO of Complexion, an AI solutions company. He received his Bachelor’s degree in Business Administration from Korea University, South Korea, and is currently pursuing a master’s degree in Entrepreneurship. His research interests focus on AI models leveraging computer vision technology to analyze human movement. His current research focuses on the intersection of computer vision and deep learning, with an emphasis on applications of multi-modal fusion for developing generative models.

Sangpil Kim is an assistant professor in the Department of Computer Science and Engineering at Korea University. He received his Ph.D. in Electrical and Computer Engineering from Purdue University and earned his B.Sc. degree in Computer Science from Korea University, South Korea. His current research focuses on the intersection of computer vision and deep learning with an emphasis on applications of multi-modal fusion for developing generative models.

Miyoung Kim received her bachelor’s degree in Computer Science and Engineering from Hankuk University of Foreign Studies, Seoul, Korea in 2025. Her current research interests include face recognition and multi-modal.

Byoungsoo Koh He received his Ph.D. degrees at the Daejeon University, Korea. He is a project director at the Korea Creative Content Agency, Ministry of Culture, Sports and Tourism, Korea. He has served as an adjunct professor at the Department of Computer Engineering at Korea University of Industrial Technology. His research interests include system software, network, and copyright.
Journal of Web Engineering, Vol. 24_6, 871–910.
doi: 10.13052/jwe1540-9589.2462
© 2025 River Publishers