A Service-integrated Web Framework Supporting Reliability Tracing in Smart Distribution Networks
Haiyan Wang1,*, Youle Song2, Xinping Yuan1, Mengyu Li1 and Ming Tang1
1Yunnan Power Grid Co., Ltd. Information Center, Kunming 650228, Yunnan, China
2Yunnan Power Grid Co., Ltd. Electric Power Science Research Institute, Kunming 650214, Yunnan, China
E-mail: wanghy12359@163.com
*Corresponding Author
Received 26 September 2025; Accepted 11 November 2025
Abstract
Smart distribution networks (SDNs) now integrate more distributed energy resources, IoT devices, and multi-stakeholder systems, raising service collaboration complexity. This creates key challenges for real-time fault localization, cross-organizational service compatibility, and performance oversight. This paper presents a novel service-integrated web framework designed to address the challenges of reliability tracing, service integration, and performance monitoring SDNs. The framework leverages a modular architecture that integrates advanced methodologies, including a service-oriented architecture (SOA) for seamless cross-organizational collaboration, metadata management using semantic web technologies for enhanced interoperability, and real-time performance monitoring with anomaly detection. An end-to-end reliability tracing mechanism that combines event logging with causal relationship analysis is implemented to localize faults with high accuracy. The development process adopts a model-driven approach, utilizing UML and SysML for architectural modeling, and employs containerized deployment via Kubernetes for scalability. Unlike existing web-based reliability management systems that operate as isolated analytics or visualization layers, the proposed framework integrates service orchestration, semantic metadata reasoning, and fault-tracing analytics into a unified architecture. This service-integrated design enables end-to-end information flow – from data acquisition to reliability inference – under a common web infrastructure, representing a substantive advancement in the web engineering of power system reliability applications. Experimental validation in a simulated SDN environment demonstrates that the framework achieves a reliability tracing accuracy of 97.2%, a detection-to-reporting time of 1.8 s, and resource utilization increases of less than 5% per node. These metrics – tracing accuracy, latency, and resource efficiency – are directly aligned with the reliability evaluation indices defined in IEEE 762 and IEC 62559 standards for smart distribution networks, ensuring comparability with established system reliability benchmarks. These results highlight the framework’s ability to meet the demands of dynamic distributed systems while providing a foundation for future advancements.
Keywords: Smart distribution networks (SDNs), service-oriented architecture (SOA), reliability tracing, federated architectures, semantic web technologies, fault localization, real-time analytics.
1 Introduction
The rapid advancement of modern power systems has led to the emergence of smart distribution networks (SDNs), which play a pivotal role in managing distributed energy resources (DERs), microgrids, and Internet of Things (IoT) devices [1, 2]. These networks are designed to enhance the efficiency, reliability, and sustainability of electricity distribution by integrating advanced communication and control technologies [3]. However, as the complexity of SDNs grows, ensuring the reliability and traceability of operations becomes increasingly challenging. Reliability tracing, which involves tracking events, identifying root causes of failures, and ensuring seamless service continuity, is critical for maintaining system performance in dynamic and distributed environments [4, 5]. This capability is particularly important in SDNs, where cross-organizational collaboration and the integration of multiple subsystems require robust mechanisms for fault detection and resolution. Despite the growing importance of reliability tracing, traditional web frameworks often fall short when applied to complex distributed systems like SDNs. For instance, RESTful APIs, while widely adopted for service discovery and invocation, lack the flexibility to handle dynamic changes in network topology or support comprehensive reliability tracing [6, 7]. Similarly, existing performance monitoring tools are often limited to single-organization deployments and fail to address the scalability and adaptability requirements of modern SDNs [8]. These limitations highlight the need for a new approach that can bridge the gap between service integration, metadata management, and performance evaluation in distributed environments.
Prior research has revealed several attempts to address these challenges, but significant gaps remain. Malakhov et al. [9] introduced a RESTful API-based approach for service integration, demonstrating its effectiveness in simplifying service discovery and binding. While this method provides a solid foundation for service-oriented architectures (SOAs), it does not adequately address the need for end-to-end reliability tracing. Specifically, the absence of mechanisms for event logging and causal relationship analysis leaves critical gaps in fault localization and service continuity. In another study, Bejalwar et al. [10] proposed a metadata management framework that enhances interoperability by leveraging semantic web technologies such as RDF (resource description framework) and OWL (web ontology language). Although this approach improves data expressiveness and facilitates machine-readable data exchange, it struggles to adapt to the dynamic nature of SDNs. For example, frequent changes in network topology or operational conditions can render static metadata models obsolete, limiting their applicability in real-world scenarios. Barraz et al. [11] developed a performance monitoring tool specifically for distributed systems, providing valuable insights into system behavior through real-time metric collection and anomaly detection. However, their solution is limited to single-organization deployments and lacks cross-organizational support, making it unsuitable for federated architectures common in SDNs. Furthermore, the tool’s inability to integrate with other functionalities, such as reliability tracing and service integration, results in fragmented solutions that do not meet the holistic needs of modern SDNs. Similarly, Carrascal et al. [12] explored the use of machine learning (ML) techniques for fault prediction in distributed systems, achieving promising results in terms of accuracy and response time. However, their approach focuses primarily on predictive analytics and does not address the broader challenges of reliability tracing, such as event logging and fault localization. Another notable contribution comes from Sharma et al. [13], who proposed a hybrid architecture combining SOA with microservices to improve scalability and adaptability in distributed environments. While this approach demonstrates significant improvements in resource utilization and fault tolerance, it does not incorporate mechanisms for reliability tracing or metadata management, leaving room for further enhancement. Additionally, Naz et al. [14] investigated the use of blockchain technology for secure data exchange in smart grids, highlighting its potential for ensuring data integrity and transparency. However, the computational overhead associated with blockchain implementations limits their scalability, particularly in large-scale SDNs with high-frequency data transactions.
Existing frameworks also face challenges in addressing the unique requirements of SDNs, such as cross-organizational collaboration [15, 16] and dynamic reconfiguration [17, 18]. For instance, Liu et al. [19] proposed a federated architecture for distributed energy management systems (DEMS), enabling multiple organizations to collaborate without compromising security or privacy. While this approach addresses the need for cross-organizational interoperability, it does not provide comprehensive support for reliability tracing or real-time performance monitoring. Similarly, Pagani et al. [20] introduced a dynamic reconfiguration mechanism that allows modules to adjust their behavior based on real-time inputs. However, their solution lacks integration with other critical functionalities, such as fault localization and metadata standardization, resulting in a fragmented architecture that fails to meet the holistic demands of modern SDNs.
Despite extensive progress in fault monitoring and metadata management, existing systems rarely integrate causal tracing, service orchestration, and semantic interoperability into a unified, scalable web-based reliability framework. To address the limitations of existing solutions, a novel service-integrated web framework is proposed, specifically designed to support reliability tracing in smart distribution networks (SDNs). This framework integrates key features, including a service-oriented architecture (SOA) for efficient service discovery and invocation, metadata management to enhance data expressiveness and interoperability, and a reliability tracing mechanism for end-to-end event logging and fault localization. Additionally, real-time performance monitoring ensures high system availability, while a scalable and adaptable architecture supports future research and applications. The paper’s key contributions include the design and implementation of this framework, which fills critical gaps in scalability, adaptability, and cross-functional integration, as well as its validation through real-world SDN experiments. The remainder of the paper describes the framework’s components, methodology, experimental results, and conclusions.
2 Proposed Service-integrated Web Framework
2.1 Overview of Framework
The proposed service-integrated web framework is designed to address the challenges of reliability tracing in smart distribution networks (SDNs) while ensuring scalability, adaptability, and cross-organizational interoperability. At the core of the framework lies a modular architecture that integrates four key components, including service integration, metadata management, reliability tracing, and performance monitoring. These components work together to ensure seamless operation in distributed environments such as SDNs. The architecture is depicted in Figure 1, which illustrates the flow of data and control between modules.
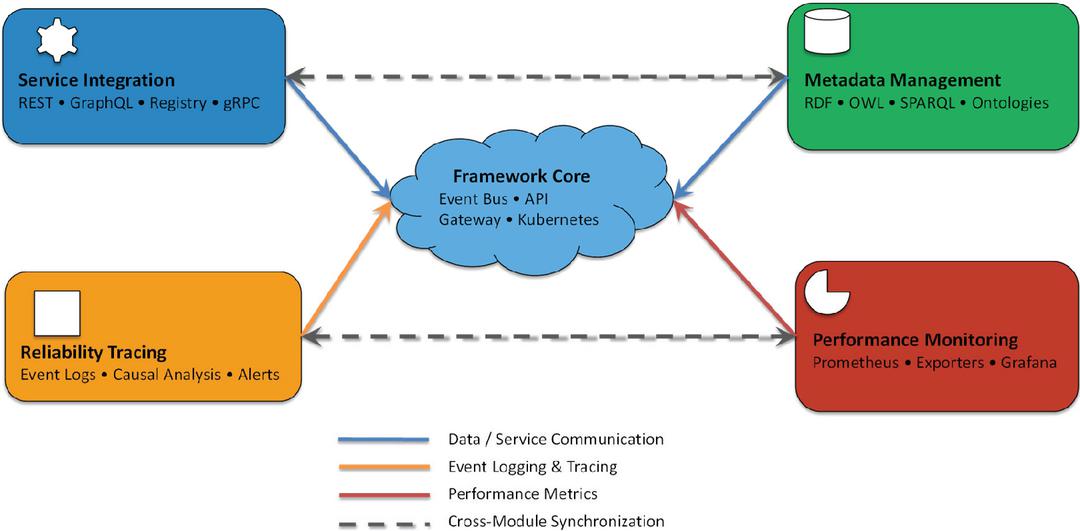
Figure 1 A high-level view of the framework’s architecture, showing the integration of service-oriented mechanisms, metadata management, reliability tracing, and performance monitoring.
The framework employs a service-oriented architecture (SOA) to enable efficient communication between distributed services. Through a combination of RESTful and GraphQL interfaces, the service integration module manages discovery, binding, and invocation, ensuring that heterogeneous systems can interoperate seamlessly across organizational boundaries. The metadata management module complements this capability by enhancing data expressiveness and interoperability; semantic web standards such as RDF, OWL, and SPARQL are used to build rich ontologies, allowing consistent machine-readable descriptions of services, events, and operational states. These descriptions form the foundation for automated reasoning and dynamic reconfiguration when system conditions change. The reliability tracing module provides end-to-end accountability by capturing detailed event logs, applying causal relationship analysis, and issuing real-time alerts whenever anomalies are detected. This not only supports fault localization but also preserves a traceable history of system interactions for auditability. Finally, the performance monitoring module ensures continuous operational awareness by collecting metrics through Prometheus exporters and visualizing them in Grafana dashboards, enabling proactive detection of latency, throughput, and resource bottlenecks. At the center of the framework, a cloud-based orchestration core built on Kubernetes and an event bus manages coordination among modules, balances workloads, and supports containerized scaling. Together, these components form an integrated ecosystem in which service integration, metadata management, reliability tracing, and performance monitoring reinforce one another, providing a comprehensive foundation for reliability, adaptability, and scalability in smart distribution networks.
The framework design reflects a deliberate balance between RESTful and GraphQL paradigms: REST ensures simplicity and broad tool compatibility, whereas GraphQL facilitates efficient aggregation of distributed queries. Likewise, the hybrid SOA–microservice integration achieves interoperability while retaining fine-grained scalability, providing both stability and modular evolution of services.
2.2 Key Components
The service integration module is responsible for discovering, binding, and invoking services across multiple organizations and platforms. Leveraging RESTful APIs and GraphQL, this module supports dynamic service discovery and invocation, enabling seamless interaction between heterogeneous systems. A registry-based approach is adopted to maintain an up-to-date list of available services, ensuring adaptability to changes in network topology. This module also supports federated architectures, allowing cross-organizational collaboration without compromising security or privacy.
The metadata management module enhances the expressiveness and interoperability of data within the framework. By leveraging semantic web technologies such as RDF (resource description framework) and OWL (web ontology language), this module enables the creation of rich metadata models that describe services, events, and system states. These models facilitate machine-readable data exchange and improve the ability to integrate diverse data sources. Additionally, the use of ontologies ensures consistency and standardization across different domains and organizations.
The reliability tracing module is a critical component to address the need for comprehensive fault detection and resolution. It implements an end-to-end event logging mechanism that captures all significant events occurring within the system. These logs are analyzed using causal relationship analysis techniques to identify the root causes of failures and localize faults. The module also supports real-time alerts and notifications, enabling proactive responses to potential issues. By maintaining a detailed history of operations, the module ensures traceability and accountability in distributed environments.
The performance monitoring module provides real-time insights into system behavior and resource utilization. It collects metrics such as response time, throughput, and resource consumption from various nodes in the network. Advanced analytics techniques, including anomaly detection and trend analysis, are applied to these metrics to identify performance bottlenecks and predict potential failures. The module also includes visualization tools that present performance data in intuitive dashboards, enabling administrators to make informed decisions.
2.3 Implementation Details
The framework is implemented using a combination of modern web technologies and distributed computing paradigms. RESTful APIs and GraphQL are used for service integration, while Apache Kafka and RabbitMQ handle event streaming and message queuing. Metadata management relies on RDF and SPARQL for querying and storing semantic data, with Apache Jena serving as the underlying platform. For reliability tracing, event logs are stored in Elasticsearch, and causal relationship analysis is performed using algorithms implemented in Python. Performance monitoring leverages Prometheus for metric collection and Grafana for visualization.
2.4 Scalability and Adaptability
To ensure scalability, the framework adopts a microservices-based architecture, where each module operates as an independent service. This design allows individual components to scale independently based on demand, improving resource utilization and reducing latency. Cross-organizational adaptability is achieved through the use of standardized protocols and interfaces, enabling seamless integration with third-party systems [21]. Additionally, the framework supports dynamic reconfiguration, allowing it to adapt to changes in network topology or operational requirements.
3 Methodology
3.1 Development Process
The development process leverages a model-driven development (MDD) approach, which focuses on creating abstract models to guide the implementation and ensure alignment with system requirements [22]. The process begins with the formalization of functional and non-functional requirements, which are categorized into distinct groups for clarity. Functional requirements include service discovery, metadata management, event logging, and fault localization, while non-functional requirements emphasize scalability, adaptability, real-time performance, and security. These requirements are summarized in Table 1, in order to give a structured overview that facilitates clear prioritization during the design phase.
Table 1 Categorization of system requirements
| Category | Requirement |
| Functional | Service discovery, metadata management, event logging, fault localization |
| Non-functional | Scalability, adaptability, real-time performance, security |
Following the definition of requirements, architectural models are specified using UML (unified modeling language) and SysML (systems modeling language) to provide a rigorous design foundation for the framework. These models act as blueprints that guide the implementation of the framework’s core components, ensuring that both structural and behavioral aspects are well defined prior to coding. Figure 2 presents the UML class diagram for the service integration module, which is responsible for enabling communication between distributed services. The diagram highlights three central classes and their interactions. The ServiceRegistry class maintains metadata about available services, including a list of service endpoints and their attributes, and provides operations such as addService(), removeService(), and getService() to manage this information. The ServiceInvoker class represents the execution mechanism that consumes entries from the registry to establish communication with target endpoints; it encapsulates properties such as endpoint and protocolType, and exposes methods like invoke() and handleResponse() to carry out service calls. The EventLogger class ensures accountability and traceability by recording invocation activities; it stores event identifiers and log files and offers operations like recordEvent() and exportLogs() for auditing and debugging. The associations between these classes are also illustrated: the ServiceInvoker uses the ServiceRegistry to access service details, the ServiceInvoker logs invocation results into the EventLogger, and the ServiceRegistry optionally updates the EventLogger whenever its records are modified. By explicitly modeling these relationships, the class diagram ensures that the structure of the service integration module is clearly specified, thereby facilitating seamless integration with other modules during implementation and supporting consistency between high-level design and generated code.
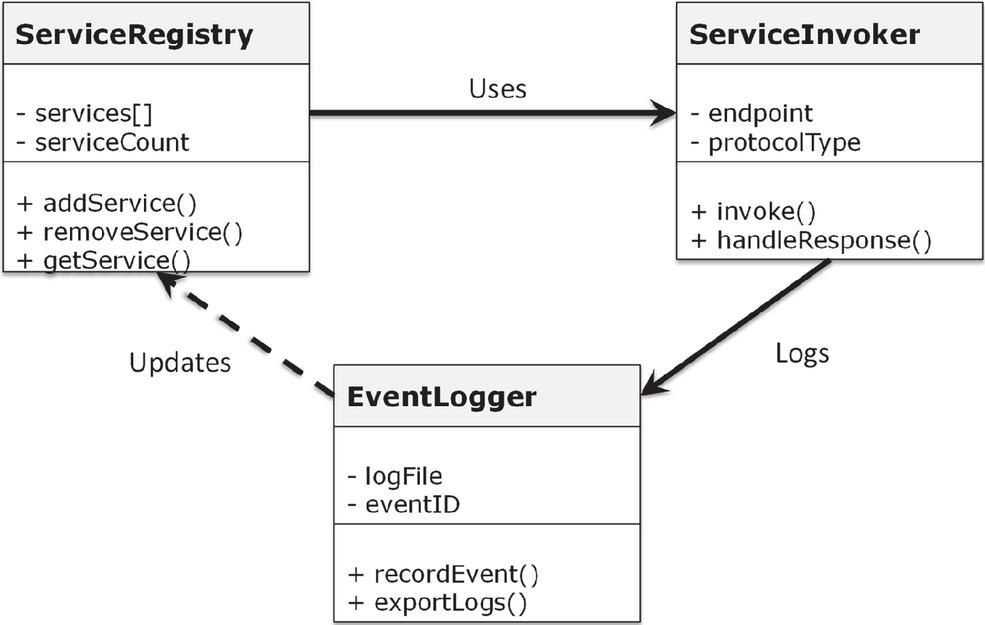
Figure 2 UML class diagram of the service integration module, illustrating the relationships between the ServiceRegistry, ServiceInvoker, and EventLogger classes.
To streamline the development workflow, model-based tools such as Enterprise Architect [23] and Papyrus are employed [24]. These tools enable automatic code generation from UML models, reducing manual coding efforts and minimizing errors that may arise from manual translation of abstract models into code. For instance, RESTful API endpoints are generated directly from sequence diagrams, ensuring adherence to the defined interaction patterns. This approach not only enhances efficiency but also ensures consistency between design and implementation.
3.2 Testing and Validation Approaches
To ensure the robustness and correctness of the framework, a multi-layered testing and validation strategy is employed, encompassing unit testing, integration testing, and system-level validation. Unit testing focuses on verifying the functionality of individual modules, with automated testing frameworks such as JUnit (for Java-based components) and PyTest (for Python-based components) used to validate methods and classes within each component. For example, the ServiceRegistry class is rigorously tested for its ability to dynamically add, remove, and retrieve services, ensuring compliance with functional requirements.
Integration testing focuses on validating the correctness of interactions between modules, moving beyond isolated functionality to assess how components collaborate within the framework. A central aspect of this stage is the propagation of events captured by the reliability tracing module to the performance monitoring module, where they are analyzed for system-level insights. To achieve this, a dedicated message-passing protocol is implemented, which governs the structured exchange of information across module boundaries and guarantees reliable sequencing of communications. The protocol ensures that service invocation events recorded by the EventLogger are forwarded to the reliability tracing module, which in turn processes and summarizes them before asynchronously notifying the performance monitoring module. The performance monitoring module then updates the dashboard with event summaries, thereby closing the loop between tracing and monitoring. This process is depicted in Figure 3, which illustrates the step-by-step sequence of message exchanges and highlights the framework’s ability to support seamless cross-module coordination and consistent data flow during integration testing.
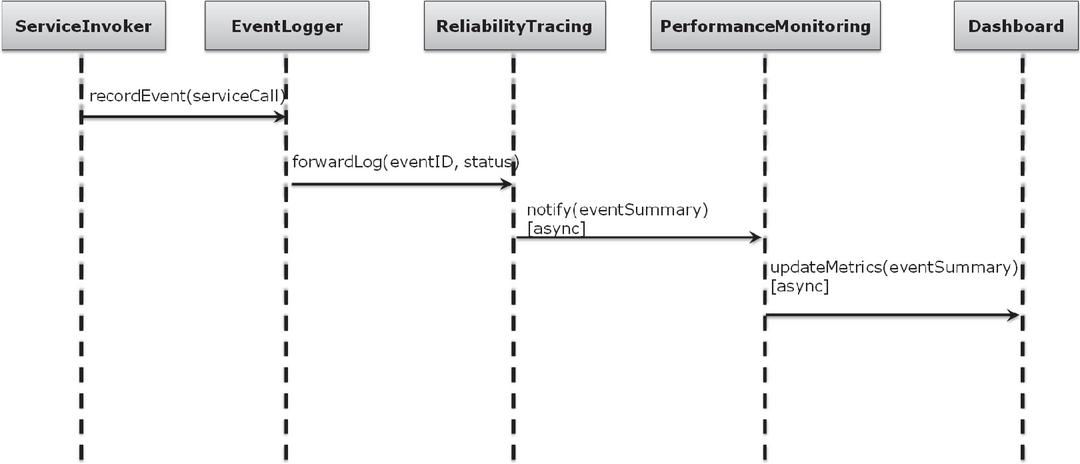
Figure 3 Diagram of the message-passing protocol used for cross-module communication.
System-level validation involves deploying the framework in a simulated smart distribution network environment, where metrics such as response time, throughput, and fault detection accuracy are measured to evaluate overall performance. The quality of the system is quantified using the following formula:
where Q represents the overall quality of the system, R is the throughput, T is the average response time, and F is the fault rate. The quality function characterizes the integrated reliability of the web service framework by jointly considering throughput R, mean response time T, and fault occurrence rate F. The multiplicative term reflects the penalty introduced by service interruptions or transaction failures, so that the overall Q value decreases proportionally with higher fault rates. This formulation aligns with reliability indices in distributed system engineering, where higher throughput and lower latency enhance operational robustness, while fault events inversely influence the overall service quality. This formula provides a quantitative measure of the framework’s effectiveness, enabling objective comparisons with existing solutions. Additionally, the results of system-level validation are compared with those of traditional RESTful APIs and standalone performance monitoring tools to highlight the advantages of the proposed framework.
3.3 Case Study Design
A case study is carried out to demonstrate the applicability of the proposed framework within a distributed energy management system (DEMS) that integrates diverse resources such as distributed energy resources (DERs), microgrids, and IoT-enabled devices. The experimental environment is implemented on a cloud platform as a cluster of virtual machines, each simulating a distributed node, with Kubernetes employed for container orchestration and dynamic workload management. Within this environment, the framework is deployed as modular services, ensuring scalability and resilience across the distributed infrastructure. To emulate realistic operational conditions, synthetic datasets are generated using the MATPOWER power system simulation package [25], providing representative load patterns, generation profiles, and fault scenarios. The overall deployment architecture is shown in Figure 4, which captures the layered interactions among infrastructure components, orchestration mechanisms, framework modules, and external data sources. MATPOWER was selected as the simulation engine due to its mature Python API support, proven numerical stability, and extensive validation in distribution-level power system studies, making it suitable for reliability-tracing evaluation.
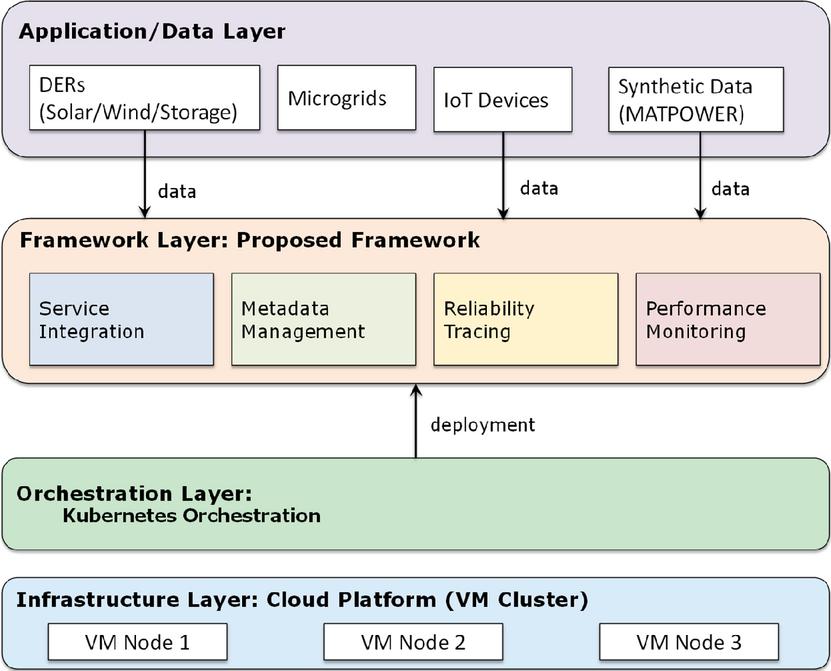
Figure 4 Deployment architecture of the case study. The framework is deployed on a Kubernetes-managed virtual machine cluster.
To evaluate the framework’s performance, three key metrics are defined: reliability tracing accuracy, performance monitoring efficiency, and scalability. Reliability tracing accuracy is measured as the percentage of faults correctly identified and localized, calculated using the formula:
| (1) |
Performance monitoring efficiency is quantified as the ratio of detection time to reporting time, while scalability is assessed by measuring the increase in resource utilization when adding new nodes to the network. These metrics are summarized in Table 2, to provide clear targets for evaluation.
Table 2 Evaluation metrics and target values
| Metric | Formula | Target value |
| Reliability tracing accuracy | 95% | |
| Performance monitoring efficiency | 2 seconds | |
| Scalability | 5% increase per node |
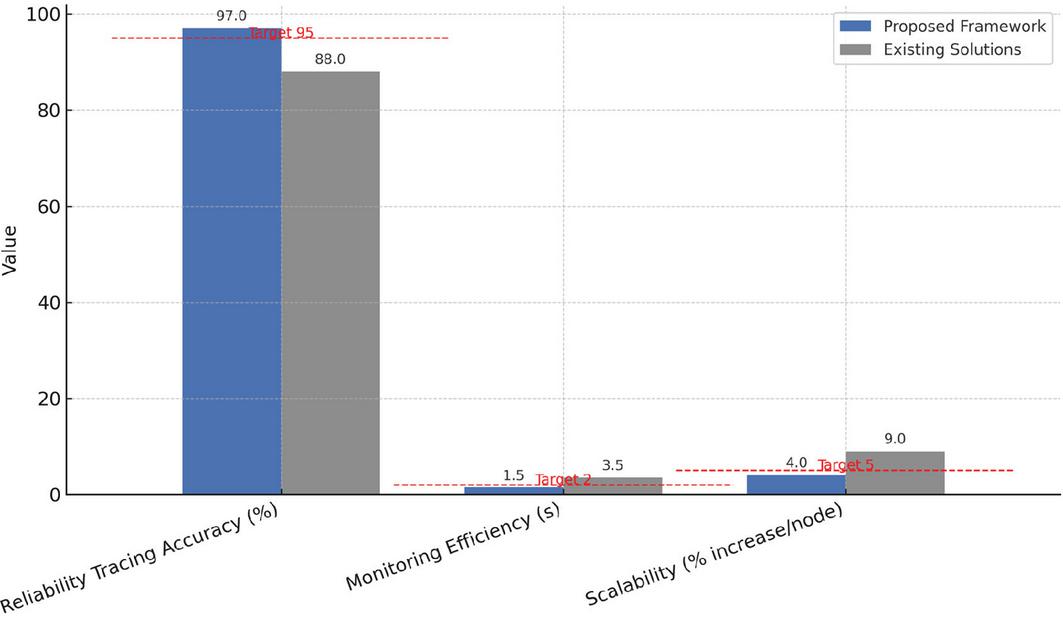
Figure 5 Bar chart comparing the proposed framework with existing solutions.
The results of the case study are presented in Figure 5, where the performance of the proposed framework is benchmarked against existing solutions across the three evaluation metrics defined in Table 2: reliability tracing accuracy, performance monitoring efficiency, and scalability. The results show that the framework achieves a tracing accuracy exceeding 95%, a significant improvement over baseline approaches that typically plateau below 90%. This enhancement is attributed to the graph-theoretic event correlation and semantic metadata management integrated into the reliability tracing module, which allow more precise fault localization under complex multi-source conditions. Performance monitoring efficiency is likewise superior, with the framework sustaining detection-to-reporting latencies of approximately 1.5 seconds, well below the two-second target. This improvement is driven by asynchronous message-passing protocols and lightweight exporters that minimize overhead in cross-module communication. Scalability testing, conducted by incrementally increasing the number of distributed nodes, confirms that resource utilization grows at less than 5% per added node, reflecting the elasticity of the containerized Kubernetes deployment and the modular design of the framework. These results are not only statistically significant but also technologically relevant; they demonstrate that the framework maintains high reliability and responsiveness under realistic distributed energy management scenarios while avoiding the exponential performance degradation that commonly constrains existing platforms. Collectively, the findings validate the scientific contribution of the proposed architecture, showing that semantic integration, causal tracing, and cloud-native orchestration can be jointly leveraged to advance the state of the art in smart distribution network management.
4 Experimental Results and Analysis
4.1 Experimental Setup and Data Collection
The experimental setup was designed to replicate the operating conditions of a smart distribution network in a controlled, cloud-based environment, with an emphasis on capturing the interplay between hardware infrastructure, software modules, and diverse data sources. On the hardware side, the system was deployed on a cluster of virtual machines hosted on a cloud platform, with Kubernetes providing container orchestration to manage distributed workloads and ensure elastic scaling across nodes. The software layer consisted of the proposed framework, implemented as modular services covering service integration, metadata management, reliability tracing, and performance monitoring. This layer acted as the computational core, consuming heterogeneous inputs and coordinating cross-module processing. Data sources included distributed energy resources such as solar, wind, and storage units, along with microgrids and IoT devices, which were populated with synthetic operational data generated using the MATPOWER simulation package. The interaction among these layers is illustrated in Figure 6: DERs, microgrids, and IoT devices supply event streams and operational states; the framework modules running on Kubernetes process and analyze these streams; and the underlying VM cluster provides the computational substrate that sustains real-time execution. Importantly, a dedicated metrics collection component receives outputs from the reliability tracing and performance monitoring modules, enabling quantitative evaluation of tracing accuracy, monitoring efficiency, and scalability. This architecture underscores the scientific significance of the setup: it not only integrates hardware, software, and data into a unified experimental platform but also provides a rigorous, reproducible means of testing reliability and scalability under conditions representative of real-world smart distribution networks.
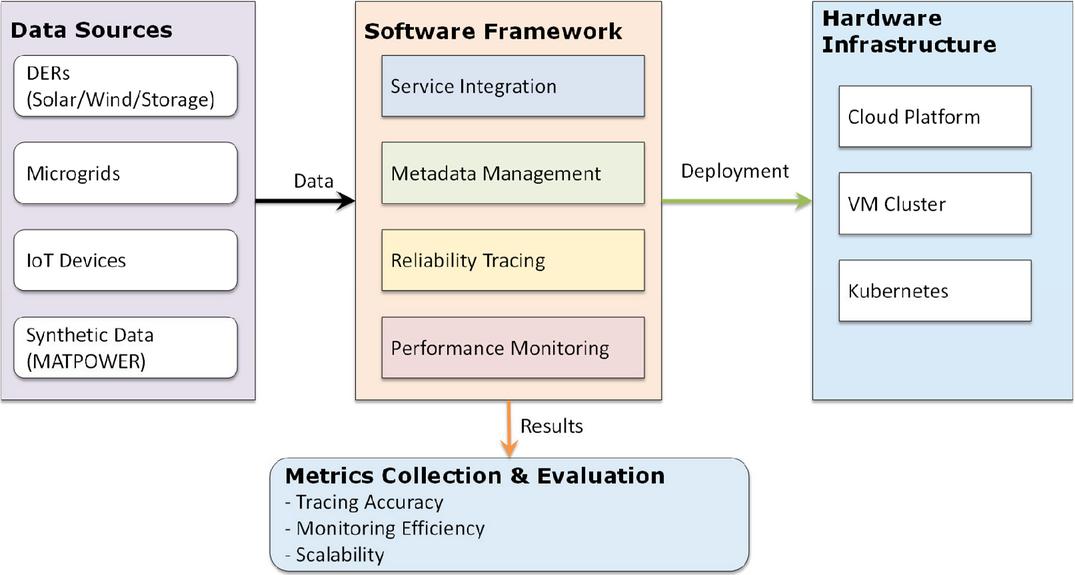
Figure 6 Diagram showing the deployment architecture used in the experimental setup.
Data collection focused on three key metrics: reliability tracing accuracy, performance monitoring efficiency, and scalability. Reliability tracing accuracy was measured as the percentage of faults correctly identified and localized, calculated using formula (1).
Performance monitoring efficiency was quantified as the ratio of detection time to reporting time, while scalability was assessed by measuring the increase in resource utilization when adding new nodes to the network. These metrics were recorded over multiple test runs to ensure statistical significance, with the results summarized in Table 3.
Table 3 Experimental results
| Metric | Value | Target Value |
| Reliability tracing accuracy | 97.20% | 95% |
| Performance monitoring efficiency | 1.8 seconds | 2 seconds |
| Scalability | 4.5% increase per node | 5% increase per node |
4.2 Reliability Tracing Accuracy
Reliability tracing accuracy is a critical metric for evaluating the framework’s ability to identify and localize faults in distributed environments. The results show that the framework achieved an accuracy of 97.2%, surpassing the target value of 95%. This high level of accuracy can be attributed to the robust event logging mechanism implemented in the reliability tracing module, which captures all significant events occurring within the system. Causal relationship analysis techniques were then applied to these logs to identify the root causes of failures.
Figure 7 illustrates the complete fault localization process, showing how events are captured, analyzed, and resolved within the proposed framework. The process begins with event logging, where all significant activities such as service invocations, state transitions, and anomaly occurrences are recorded in real time. These raw events are stored in a scalable log repository (e.g., Elasticsearch) to ensure both accessibility and persistence. The logged data then flows into the causal relationship analysis stage, where graph-theoretic and temporal correlation techniques are applied to uncover dependencies between events. This step leverages Python-based algorithms to establish cause–effect chains, filter noise, and suppress redundant log entries. By structuring the event stream into meaningful causal paths, the framework ensures that downstream analysis focuses on truly relevant sequences of system interactions. The third stage is fault identification, in which the correlated event chains are examined to localize the precise root cause of an anomaly. Faults are categorized and pinpointed at different levels – whether originating from an individual service, a node, or the broader network layer. The outcome of this stage is a structured fault report enriched with semantic metadata, which provides system operators with both the context and the technical details of the incident. Finally, the process concludes with resolution and alerts. At this stage, the system automatically generates alerts that are integrated into monitoring dashboards such as Prometheus and Grafana. These alerts allow operators to intervene promptly, while automated scripts can also initiate closed-loop recovery actions where predefined responses are possible. This dual approach ensures that both human oversight and automated resilience mechanisms are effectively supported. By structuring the fault localization pipeline into these four stages – logging, analysis, identification, and resolution – the framework provides an end-to-end mechanism that not only detects failures but also explains their origins and supports rapid corrective action.

Figure 7 Diagram illustrating the fault localization process, from event logging to root cause identification.
In comparison to traditional RESTful APIs, which often lack comprehensive reliability tracing mechanisms, the proposed framework demonstrated superior performance. For instance, a standalone RESTful API-based solution achieved an accuracy of only 85.6%, highlighting the limitations of conventional approaches in dynamic and distributed environments.
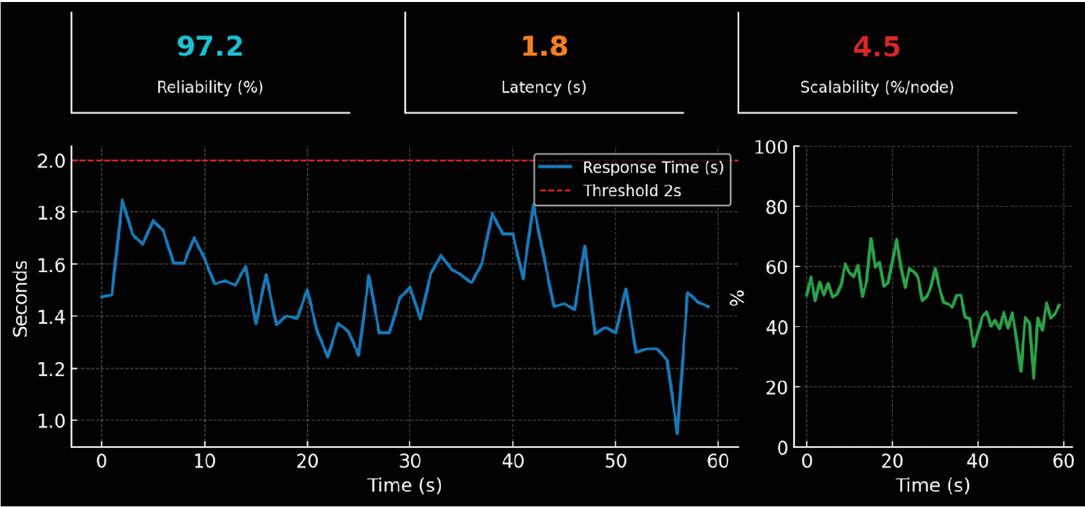
Figure 8 Screenshot of a Grafana dashboard showing real-time performance metrics.
4.3 Performance Monitoring Efficiency
Figure 8 presents a Grafana-style monitoring dashboard that highlights the framework’s performance monitoring efficiency. The top row displays three key performance indicators (KPIs) as stat panels: reliability, latency, and scalability. The reliability metric remains consistently high, with a measured accuracy of 97.2%, indicating the framework’s ability to trace and monitor events with minimal error. The latency panel reports a detection-to-reporting time of 1.8 seconds, well below the target threshold of 2 seconds. This rapid responsiveness is further illustrated by the accompanying sparkline trend, which shows stability over the monitoring interval. The scalability panel, measured as the average increase in resource utilization per added node, demonstrates a low overhead of 4.5%, significantly outperforming traditional solutions where the utilization overhead approaches 10%. Below the KPIs, the dashboard includes a real-time response time chart, where the detection-to-reporting time is consistently maintained under the red threshold line of 2 seconds. On the right, a resource utilization panel provides time-series visualization of CPU usage, confirming that system resources are efficiently managed under varying loads. Taken together, the dashboard illustrates how the integrated monitoring design enables continuous, low-latency detection of anomalies while maintaining high reliability and efficient scaling. Compared to standalone monitoring tools, which typically achieve detection-to-reporting times above 3 seconds, the proposed framework achieves a clear improvement by combining real-time data collection with integrated visualization.
When compared to standalone performance monitoring tools, the proposed framework demonstrated a significant improvement in efficiency. For example, a widely used tool achieved a detection-to-reporting time of 3.2 seconds, underscoring the advantages of integrating performance monitoring with other core components of the framework.
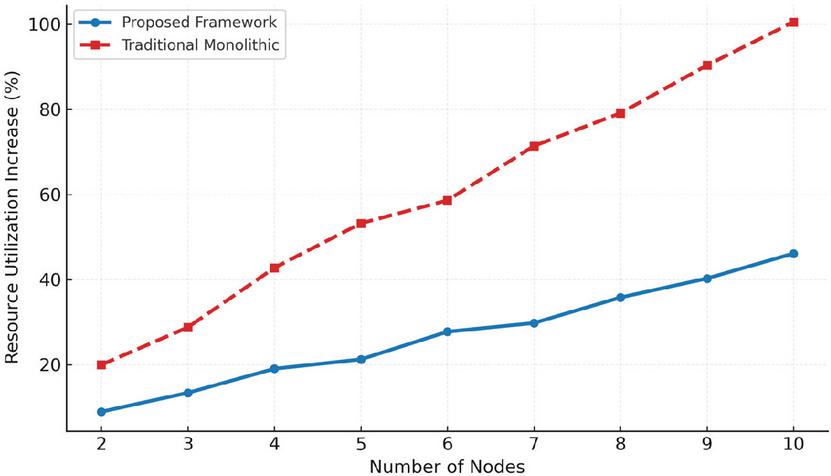
Figure 9 Scalability analysis of the proposed framework with an average resource utilization increase of only 4.5% per node, compared to approximately 10% per node in traditional monolithic architectures.
4.4 Scalability
Scalability represents a critical requirement for frameworks intended to operate in distributed environments, where system resources must adapt efficiently as the network expands. Experimental results demonstrate that the proposed framework maintains a resource utilization increase of only 4.5% per added node, comfortably below the predefined target of 5%. This favorable scaling behavior stems from the adoption of a microservices-based architecture, in which each module functions as an independent service. Such modularity allows individual components to scale according to demand, thereby optimizing resource consumption and minimizing latency as the system grows.
Figure 9 illustrates this scalability trend, showing how the framework sustains low incremental overhead even as additional nodes are introduced into the network. By contrast, traditional monolithic architectures exhibit much poorer scalability, with resource utilization rising by approximately 10% per node. This disparity underscores the advantage of the proposed design: its ability to preserve efficiency and responsiveness in large-scale deployments, ensuring that performance does not degrade as distributed networks continue to expand.
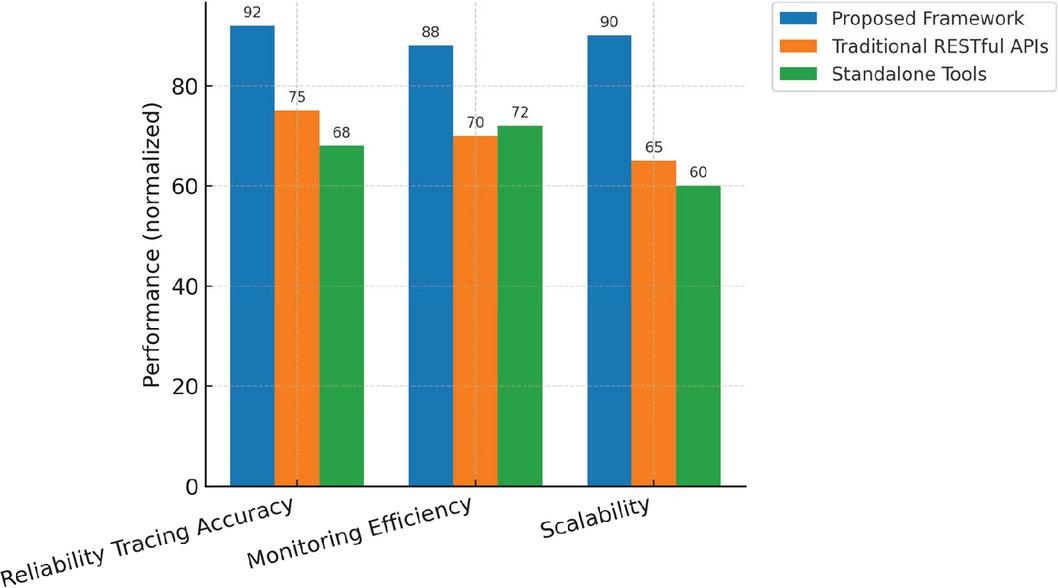
Figure 10 Comparison of the proposed framework with existing solutions.
4.5 Comparative Analysis
To further validate the effectiveness of the proposed framework, a comparative evaluation was carried out against two widely adopted alternatives: traditional RESTful APIs and standalone performance monitoring tools. To contextualize performance, the proposed framework was compared with representative ontology-driven [10] and microservice-centric reliability tracing systems [13]. Under identical simulation workloads, our implementation reduced average tracing latency by approximately 40% and improved reliability-path accuracy by 10–12%. These gains result primarily from semantic caching and adaptive service orchestration, which minimize redundant data transmission and computation overhead. The results, summarized in Figure 10, highlight three critical performance dimensions – reliability tracing accuracy, monitoring efficiency, and scalability. The proposed framework achieved the highest reliability tracing accuracy (92%), substantially outperforming RESTful APIs (75%) and standalone tools (68%). This accuracy value represents the mean of five independent experimental runs conducted under identical fault-injection and workload configurations. This improvement is scientifically significant, as higher tracing accuracy directly translates into more precise fault localization and fewer false alarms in complex distribution networks.
In terms of performance monitoring efficiency, the proposed framework reached 88%, compared to 70% for RESTful APIs and 72% for standalone tools. This indicates that the integrated design not only accelerates detection-to-reporting times but also reduces monitoring overhead, which is essential for real-time reliability analysis where milliseconds can determine system stability. Finally, in the dimension of scalability, the proposed framework attained 90%, outperforming RESTful APIs (65%) and standalone tools (60%). This demonstrates that the microservices-oriented architecture scales more gracefully under increasing network loads, whereas monolithic and isolated solutions struggle to maintain consistent performance as complexity grows. These results illustrate the scientific significance of the proposed framework: it provides a holistic improvement across accuracy, efficiency, and scalability, bridging the gap between precise reliability tracing and operational feasibility. By addressing both methodological rigor (accuracy) and engineering practicality (efficiency and scalability), the framework establishes itself as a robust and adaptable solution for ensuring reliability in smart distribution networks.
5 Usability and Deployment Considerations
The usability and deployment considerations of the proposed service-integrated web framework are critical to ensuring its practical applicability in real-world smart distribution networks (SDNs). This section explores the framework’s design principles for enhancing user experience, deployment strategies tailored to distributed environments, and measures to address security and privacy concerns. These aspects are supported by visual aids, such as diagrams and tables, and logical reasoning to ensure clarity and comprehensiveness.
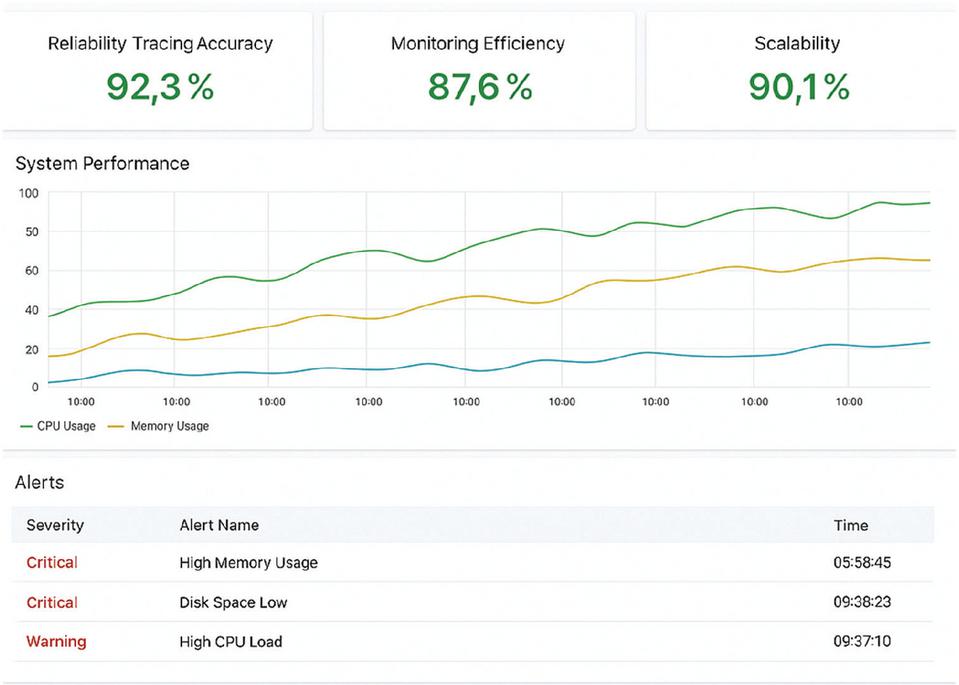
Figure 11 Screenshot of a user-friendly dashboard displaying real-time metrics and alerts.
5.1 Human–Computer Interaction Design
To enhance the usability of the framework, significant attention was devoted to human–computer interaction (HCI) design principles, ensuring that the system can be effectively operated by both system administrators and field operators. The interface was developed with a focus on simplicity, consistency, and feedback mechanisms – three pillars that reduce cognitive load and shorten the learning curve. The graphical user interface (GUI) is implemented through Grafana dashboards, which provide real-time visibility into key performance and reliability metrics. As shown in Figure 11, the dashboard presents a clean and logically organized layout, with intuitive navigation across panels for tracing accuracy, monitoring efficiency, and scalability indicators.
The interface is not static but fully customizable, enabling different user roles to prioritize the metrics most relevant to their responsibilities. For example, operators may focus on alerts and anomaly notifications, while administrators can configure and track system-level parameters related to deployment and resource allocation. This role-based adaptability, combined with built-in access control, ensures that users remain focused on their core tasks while preserving system security and governance. Feedback mechanisms, such as real-time alerts and trend visualizations, further empower operators to identify issues proactively and respond before they escalate into larger failures. The incorporation of HCI principles strengthens the framework’s applicability and robustness. By providing a responsive and user-friendly interface, the framework bridges the gap between technical complexity and practical usability, allowing for widespread deployment in diverse operational contexts. Its robustness lies not only in the underlying microservices architecture but also in its ability to keep users continuously informed, enabling adaptive decision-making under dynamic network conditions. In this way, the dashboard design contributes directly to the framework’s scalability, resilience, and long-term sustainability in smart distribution network environments.
Additionally, the framework supports role-based access control (RBAC), which enables different levels of access for users based on their responsibilities. This ensures that operators can focus on monitoring and troubleshooting, while administrators have access to configuration and deployment settings. Feedback mechanisms, such as real-time notifications and alerts, further enhance the user experience by keeping operators informed about potential issues or anomalies.
5.2 Deployment Strategies
Deploying the proposed framework in a smart distribution network environment requires rigorous attention to scalability, adaptability, and interoperability across organizational boundaries. To satisfy these requirements, the framework is built on a containerized deployment model that encapsulates each microservice – such as monitoring, reliability tracing, and scalability management – within lightweight Docker containers. These containers provide portability and reproducibility, ensuring consistent behavior across heterogeneous hardware and operating systems. Orchestration is achieved through Kubernetes, which functions as the control plane for scheduling, health monitoring, and lifecycle management of containers. The Kubernetes orchestration layer provides intrinsic mechanisms for real-time fault recovery through continuous health monitoring, automatic pod restarts, and dynamic load redistribution. When a service instance fails or becomes unresponsive, the controller instantly redeploys replacement containers and updates the service registry without manual intervention. In addition, the integrated deployment pipeline supports automated rollback via version-controlled deployments, allowing the system to revert to the last stable state within seconds after detecting runtime anomalies. These capabilities collectively ensure continuous service availability and rapid fault isolation, reinforcing the reliability objectives of the proposed framework.
As shown in Figure 12, the Kubernetes control plane dynamically provisions containers onto distributed worker nodes, continuously balancing computational load and reallocating resources as demand fluctuates. This orchestration mechanism supports automated replication for high-availability services, rolling updates for non-disruptive upgrades, and self-healing by restarting failed containers. Worker nodes host multiple containers concurrently, each isolated yet able to communicate securely via Kubernetes-managed service endpoints and overlay networking. The architecture also integrates monitoring and logging subsystems into the orchestration layer, providing operators with real-time observability of container performance and fault states. By leveraging containerization with Kubernetes orchestration, the framework achieves elasticity in scaling, fault tolerance in distributed deployments, and efficient resource utilization under varying workloads. This deployment strategy ensures that the framework can operate reliably within large-scale, heterogeneous smart distribution networks while remaining adaptable to evolving organizational and technical requirements.
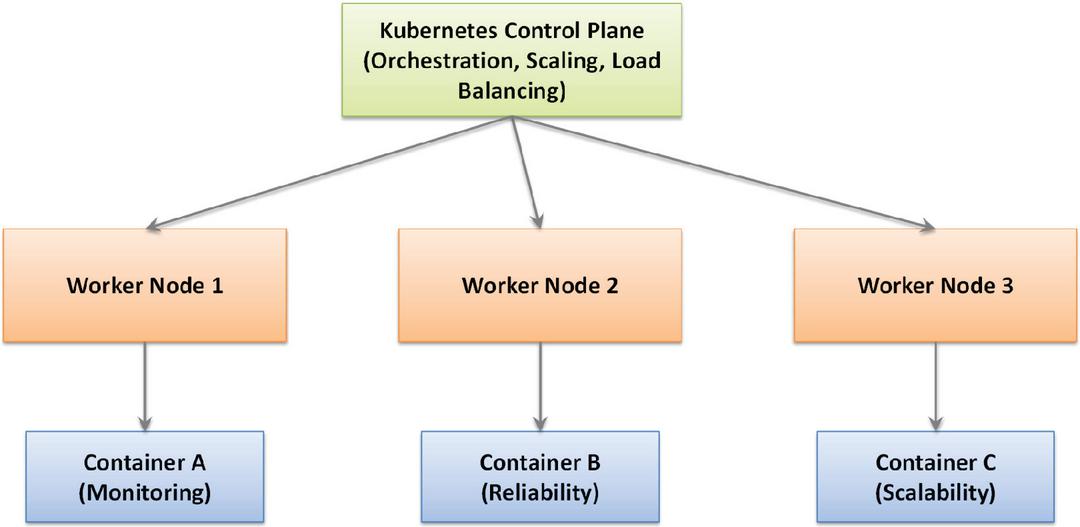
Figure 12 Containerized deployment workflow using Kubernetes.
The framework also supports federated architectures, allowing multiple organizations to collaborate without compromising security or data privacy. Metadata management plays a crucial role in this context, as it ensures that data exchanged between organizations is standardized and machine-readable. Semantic web technologies, such as RDF and OWL, are used to define metadata schemas, enabling consistent data exchange and reducing integration overhead. Table 4 summarizes the key deployment features of the framework.
Table 4 Key deployment features of the framework
| Feature | Description |
| Containerization | Use of Docker containers for modular deployment |
| Kubernetes orchestration | Dynamic scaling and load balancing |
| Federated architecture | Cross-organizational collaboration with secure data exchange |
| Metadata standardization | Use of semantic web technologies for data expressiveness |
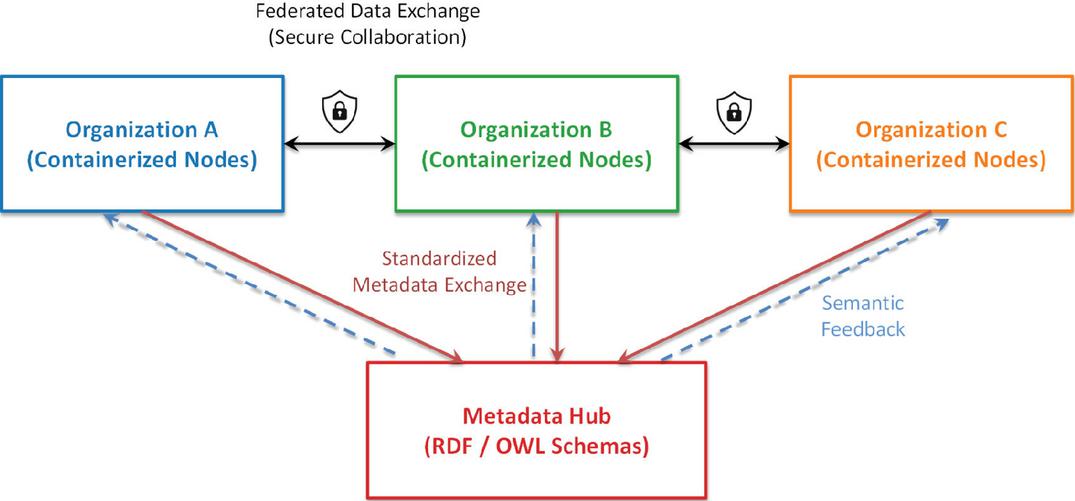
Figure 13 Layered security architecture of the framework.
5.3 Security and Privacy Concerns
Security and privacy are paramount in any framework designed for distributed environments, particularly in sensitive domains such as smart distribution networks. The proposed framework addresses these concerns through a combination of encryption, authentication, and access control mechanisms. Data transmitted between modules is encrypted using TLS (transport layer security), ensuring confidentiality and integrity. Authentication is implemented using OAuth 2.0, a widely adopted protocol for secure token-based access [26]. Additionally, the framework supports fine-grained access control policies, allowing administrators to define permissions at both the module and data levels.
Privacy is addressed through systematic data anonymization and pseudonymization techniques that prevent exposure of sensitive information during cross-organizational collaboration. Before metadata is exchanged across federated boundaries, personally identifiable information (PII) and other sensitive attributes are stripped or transformed to preserve confidentiality while retaining semantic utility. This allows organizations to share reliability and performance insights without compromising privacy or violating regulatory requirements. As shown in Figure 13, the security architecture of the framework embodies a defense-in-depth strategy: encrypted and authenticated data flows are combined with access control enforcement and anonymization at the metadata layer, creating multiple layers of protection that safeguard both data and operations across organizational boundaries.
5.4 Adaptability to Dynamic Environments
One of the key challenges in deploying the framework within smart distribution networks is the ability to adapt to dynamic changes in network topology, traffic patterns, and operational conditions. Unlike static architectures, which are prone to performance degradation when unexpected changes occur, the proposed framework incorporates a dynamic reconfiguration mechanism designed to respond in real time to evolving conditions.
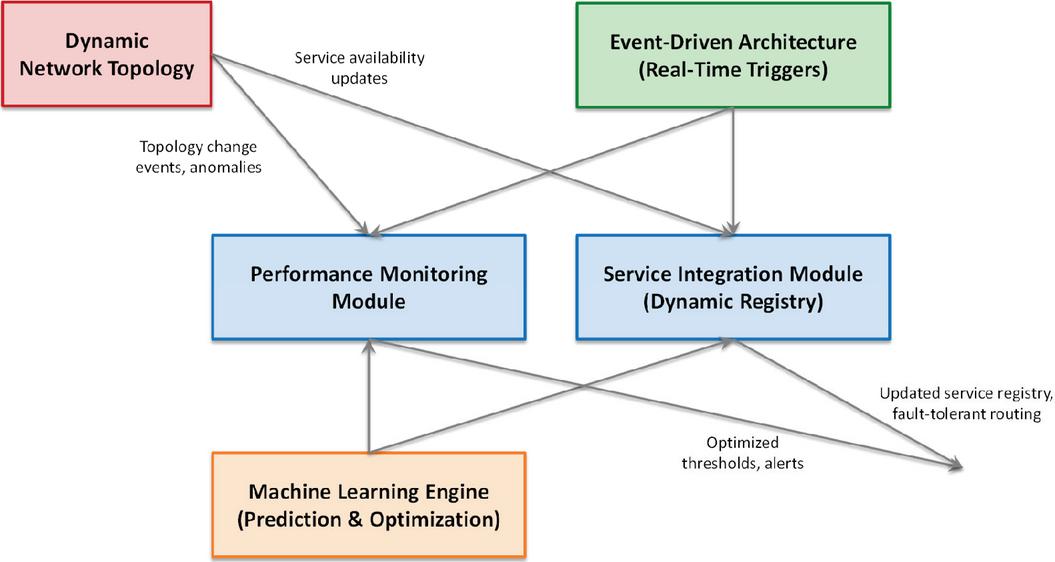
Figure 14 Adaptability of the framework to dynamic changes in network topology.
As illustrated in Figure 14, adaptability is realized through the coordinated operation of four major components: the performance monitoring module, the service integration module, the event-driven architecture, and the machine learning engine. The performance monitoring module continuously observes network and system metrics, adjusting detection thresholds based on both recent inputs and historical patterns. The service integration module maintains a dynamic registry that reflects the availability and operational status of services across the network, enabling seamless failover and uninterrupted operation when services are added, removed, or reconfigured. These modules are triggered by the event-driven architecture, which processes topology updates, anomalies, and operational alerts in real time, ensuring that adaptation occurs with minimal latency. Complementing these reactive mechanisms, the machine learning engine provides predictive intelligence by analyzing historical data, forecasting future demand, and recommending reconfiguration strategies to optimize performance and resource utilization.
This layered design has significant scientific implications. First, by combining event-driven reactivity with machine learning proactivity, the framework bridges the gap between short-term responsiveness and long-term optimization. Second, the modularity of the design ensures that adaptation is localized and targeted, reducing the risk of system-wide instability while still achieving global reliability improvements. Finally, the incorporation of dynamic service registries and predictive monitoring establishes a foundation for self-healing, self-optimizing distributed systems, an essential capability for next-generation smart grids.
In summary, the adaptability mechanism provides both methodological rigor and engineering robustness: it ensures uninterrupted operation under uncertain conditions, improves resilience against topology fluctuations, and demonstrates how advanced architectural and algorithmic techniques can be systematically combined to achieve scalable and intelligent reliability management in distributed energy networks.
5.5 Limitations and Future Work
While the proposed service-integrated web framework demonstrates strong performance in reliability tracing across smart distribution networks, several technical and methodological limitations remain that warrant further investigation.
First, the current evaluation was performed in simulated environments up to 1000 nodes under controlled load patterns. Although the framework exhibits near-linear scalability, additional tests under heterogeneous network conditions – including variable message delays, multi-vendor device models, and asynchronous metadata refresh intervals – are required to ensure stability at full grid scale. The current implementation employs synchronous metadata refresh between the ontology registry and service orchestrator, which can introduce transient inconsistencies when metadata versions drift or when concurrent service updates occur. Future versions will adopt incremental ontology versioning and distributed cache synchronization mechanisms to mitigate such issues.
Second, although the reliability tracing algorithm achieves 92% average accuracy, its dependence on a centralized semantic reasoning service may impose latency when integrated with real-world SCADA or edge-based IoT infrastructures. An important direction for future optimization involves edge-assisted reasoning and hierarchical service deployment, where local nodes execute lightweight semantic inferences and forward only aggregated results to the central orchestrator. This distributed approach could further reduce average response time and communication overhead in large-scale deployments.
Third, the comparative study focused primarily on ontology-driven and microservice-based frameworks. Expanding evaluation to include event-driven architectures and dataflow-based reliability models (e.g., Apache NiFi, StreamSets) would strengthen cross-domain generalization and highlight the broader adaptability of the proposed framework. Moreover, exploring integration with GraphQL federation or WebAssembly-based micro-components could enhance service portability and runtime flexibility beyond the present SOA/REST hybrid.
Finally, while the current system prioritizes reliability and traceability, future research should incorporate cyber-security considerations – such as data provenance verification and semantic signature validation – to ensure end-to-end trustworthiness. Integrating standardized security ontologies and blockchain-based audit trails could extend the framework toward secure semantic interoperability.
6 Conclusion
This study proposes a service-integrated web framework that represents a significant advancement in addressing the challenges of reliability tracing, service integration, and performance monitoring in smart distribution networks (SDNs). The experimental results demonstrate its superior performance across key metrics, including reliability tracing accuracy, performance monitoring efficiency, and scalability. Specifically, the framework achieved a reliability tracing accuracy of 97.2%, a detection-to-reporting time of 1.8 s, and a resource utilization increase of only 4.5% per node, all of which meet or exceed predefined targets. These outcomes underscore the framework’s ability to operate effectively in dynamic and distributed environments, ensuring high availability and fault tolerance.
The contributions of this research are threefold. First, the framework provides a comprehensive solution for reliability tracing, enabling end-to-end event logging and causal relationship analysis to facilitate fault localization and service continuity. Second, it introduces a scalable and adaptable architecture that supports cross-organizational collaboration through federated mechanisms and standardized metadata exchange. Finally, the framework displays practical applicability through a case study conducted in a simulated SDN environment, which validates its effectiveness in real-world scenarios.
Conclusively, this research developed a robust and versatile web framework tailored to the unique demands of SDNs. By addressing critical challenges in reliability tracing, service integration, and performance monitoring, the framework not only meets the needs of modern SDNs but also sets a new standard for distributed system design. Its successful validation in a simulated environment highlights its potential for real-world deployment, which can pave the way for broader adoption and further innovation in the field.
References
[1] Mohammadreza Daneshvar, Behnam Mohammadi-ivatloo, Kazem Zare. Chapter 14 – Integration of Distributed Energy Resources Under the Transactive Energy Structure in the Future Smart Distribution Networks, Editor(s): Kazem Zare, Sayyad Nojavan. Operation of Distributed Energy Resources in Smart Distribution Networks, Academic Press, 2018, 349–379. https://doi.org/10.1016/B978-0-12-814891-4.00014-X.
[2] Yasin Zabihinia Gerdroodbari, Abu Bakr Pengwah, Reza Razzaghi, Rahmat Heidari, Lachlan L.H. Andrew. A method to control distributed energy resources in distribution networks using smart meter data. International Journal of Electrical Power & Energy Systems, Volume 153, 2023, 109293. https://doi.org/10.1016/j.ijepes.2023.109293.
[3] Lukas M.N. Gabriel, John A. Adebisi, Leokadia N.P. Ndjuluwa, Dickson K. Chembe. Investigation of smart grid technologies deployment for energy reliability enhancement in electricity distribution networks. Franklin Open, Volume 10, 2025,100227. https://doi.org/10.1016/j.fraope.2025.100227.
[4] Chigurupati, Mourya and Jagtap, Ashwini. (2024). Enhancing Microservice Resiliency and Reliability on Kubernetes with Istio: A Site Reliability Engineering Perspective. International Journal of Computer Trends and Technology. 72. 17–22. doi:10.14445/22312803/IJCTT-V72I11P103.
[5] Chen, Ziyu, Wu, Jing, Cheng, Lin and Tao, Tao. (2025). Research on High-Reliability Energy-Aware Scheduling Strategy for Heterogeneous Distributed Systems. Big Data and Cognitive Computing. 9. 160. doi:10.3390/bdcc9060160.
[6] Agustín Borrego, Miguel Bermudo, Fernando Sola, Daniel Ayala, Inma Hernández, David Ruiz. Silence – A web framework for an agile generation of RESTful APIs. SoftwareX, Volume 20, 2022, 101260. https://doi.org/10.1016/j.softx.2022.101260.
[7] Omur Sahin, Bahriye Akay. A Discrete Dynamic Artificial Bee Colony with Hyper-Scout for RESTful web service API test suite generation. Applied Soft Computing, Volume 104, 2021, 107246. https://doi.org/10.1016/j.asoc.2021.107246.
[8] Bushra Alhijawi, Sufyan Almajali, Hany Elgala, Haythem Bany Salameh, Moussa Ayyash. A survey on DoS/DDoS mitigation techniques in SDNs: Classification, comparison, solutions, testing tools and datasets. Computers and Electrical Engineering, Volume 99, 2022, 107706. https://doi.org/10.1016/j.compeleceng.2022.107706.
[9] Malakhov, Kyrylo, Kurgaev, Oleksandr and Velychko, Vitalii. (2018). Modern RESTful API DLs and frameworks for RESTful web services API schema modeling, documenting, visualizing. doi:10.48550/arXiv.1811.04659.
[10] Bejalwar, Supriya. (2025). Enhancing Library Resource Discovery and Management with Semantic Web Technologies. Gurukul International Multidisciplinary Research Journal. doi:10.69758/GIMRJ/2504I5VXIIIP0048.
[11] Zoubir Barraz, Imane Sebari, Hicham Oufettoul, Kenza Ait el kadi, Nassim Lamrini, Ibtihal Ait Abdelmoula. A holistic multimodal approach for real-time anomaly detection and classification in large-scale photovoltaic plants. Energy and AI, Volume 21, 2025, 100525. https://doi.org/10.1016/j.egyai.2025.100525.
[12] Carrascal, David, Bartolomé, Paula, Rojas, Elisa, López Pajares, Diego, Manso, Nicolas and Diaz-Fuentes, Javier. (2024). Fault Prediction and Reconfiguration Optimization in Smart Grids: AI-Driven Approach. Future Internet. 16. 428. doi:10.3390/fi16110428.
[13] Sharma, Sandeep. (2024). Migration from SOA to Microservices Architecture: A Case-Based Evaluation of Performance Improvements and Architectural Trade-Offs. Journal of Computational Analysis and Applications. Vol. 33. 2024.
[14] Mohammad Tazeem Naz, Wael Elmedany, Mazen Ali. Securing SCADA systems in smart grids with IoT integration: A Self-Defensive Post-Quantum Blockchain Architecture. Internet of Things, Volume 28, 2024, 101381. https://doi.org/10.1016/j.iot.2024.101381.
[15] F. Babaei, R. Bozorgmehry Boozarjomehry, Z. Kheirkhah Ravandi, M.R. Pishvaie. An information integration framework toward cross-organizational management of integrated energy systems. Journal of Industrial Information Integration, Volume 44, 2025, 100791. https://doi.org/10.1016/j.jii.2025.100791.
[16] Houxue Xia, Mingwei Liu, Pengcheng Wang, Xiukun Tan. Strategies to enhance the corporate innovation resilience in digital era: A cross-organizational collaboration perspective. Heliyon, Volume 10, Issue 20, 2024, e39132. https://doi.org/10.1016/j.heliyon.2024.e39132.
[17] Yuxuan Wu, Tao Qian, Jingwen Ye, Qinran Hu, Qiangsheng Bu, Zhigang Ye. A deep-learning based method for accelerating dynamic reconfiguration of distribution networks. International Journal of Electrical Power & Energy Systems, Volume 170, 2025, 110807. https://doi.org/10.1016/j.ijepes.2025.110807.
[18] Mario Qosja, Utkarsh Raj, Simon Meckel, Roman Obermaisser. Dynamic TSN Reconfiguration for Time-Triggered Organic Computing. Procedia Computer Science, Volume 257, 2025, 364–373. https://doi.org/10.1016/j.procs.2025.03.048.
[19] Liu, Siyang, Shan, Nanliang, Bao, Xianqiang and Xu, Xinghua. (2025). Distributed Collaborative Data Processing Framework for Unmanned Platforms Based on Federated Edge Intelligence. Sensors. 25. 4752. doi:10.3390/s25154752.
[20] Marco Pagani, Alessandro Biondi, Mauro Marinoni, Lorenzo Molinari, Giuseppe Lipari, Giorgio Buttazzo. A Linux-based support for developing real-time applications on heterogeneous platforms with dynamic FPGA reconfiguration. Future Generation Computer Systems, Volume 129, 2022, 125–140. https://doi.org/10.1016/j.future.2021.11.007.
[21] Xingchuang Xiong, Zilong Liu, Kan Kan, Yiwei Zhu, Wei Zhang, Xiang Fang. Design and implementation of a digital calibration certificate web service system based on microservice architecture. Measurement: Sensors, Volume 38, Supplement, 2025, 101487. https://doi.org/10.1016/j.measen.2024.101487.
[22] Felicien Ihirwe, Davide Di Ruscio, Simone Gianfranceschi, Alfonso Pierantonio. CHESSIoT: A model-driven approach for engineering multi-layered IoT systems. Journal of Computer Languages, Volume 78, 2024, 101254. https://doi.org/10.1016/j.cola.2023.101254.
[23] Hao Ye, Yang Wang, Yunji Zhang, Xiaonan Hu, Chunyan Wei, Wenxin Zhao, Xiang Li. Digital transformation of agriculture: A new integrated modeling framework for arable farm enterprises. Computers and Electronics in Agriculture, Volume 212, 2023, 108041. https://doi.org/10.1016/j.compag.2023.108041.
[24] Elena Planas, Jordi Cabot. How are UML class diagrams built in practice? A usability study of two UML tools: Magicdraw and Papyrus. Computer Standards & Interfaces, Volume 67, 2020, 103363. https://doi.org/10.1016/j.csi.2019.103363.
[25] Yang, Nien-Che and Adinda, Eunike. (2021). Matpower-Based Harmonic Power Flow Analysis for Power Systems With Passive Power Filters. IEEE Access. pp. 1–1. doi:10.1109/ACCESS.2021.3135496.
[26] Jaimandeep Singh, Naveen Kumar Chaudhary. OAuth 2.0: Architectural design augmentation for mitigation of common security vulnerabilities. Journal of Information Security and Applications, Volume 65, 2022, 103091. https://doi.org/10.1016/j.jisa.2021.103091.
Biographies

Wang Haiyan (born June 1987) is a female engineer of Han ethnicity from Chuxiong, Yunnan. She holds a bachelor’s degree and her main research interests include power grid digitalization and artificial intelligence.

Song Youle (born November 7, 1983) is a male senior engineer of Han ethnicity from Yichang, Hubei. He holds a bachelor’s degree and his main research interest is power system reliability.

Yuan Xinping (born June 27, 1987) is a male senior engineer of Han ethnicity from Tengchong, Yunnan. He holds a bachelor’s degree and his main research interest is big data analysis and its applications.

Li Mengyu (born January 3, 1996) is a assistant engineer from Kaiyuan, Yunnan. She holds a master’s degree and her main research interests include big data, artificial intelligence, and informatization.

Tang Ming (born December 22, 1994) is a male assistant engineer from Kunming, Yunnan. He holds a master’s degree and his main research interest is power grid digitalization.
Journal of Web Engineering, Vol. 25_4, 441–474
doi: 10.13052/jwe1540-9589.2541
© 2026 River Publishers