Service-oriented Web Framework for Real-time Data Flow Tracing and Threat Propagation Analysis in Distributed Energy Systems
Qing Rao, Yunhao Yu, Yizhou Fu, Boda Zhang, Shihong Chen*, Jianxia Wu, Zhongkai Pan and Qing Lei
Anshun Power Supply Bureau of Guizhou Power Grid Co., Ltd. Anshun 561099, China
E-mail: 15870170637@163.com
*Corresponding Author
Received 27 October 2025; Accepted 04 December 2025
Abstract
Ensuring data-flow integrity and rapid threat containment in renewable-integrated, distributed energy systems requires monitoring solutions that are technically rigorous yet lightweight in operation. This paper presents a service-oriented web framework for real-time data-flow tracing and threat propagation analysis in heterogeneous industrial control and energy networks. The framework integrates lightweight provenance tokens embedded in event streams, an incrementally maintained lineage graph with probability-weighted edges, and propagation-aware risk indicators that drive adaptive response orchestration through open web APIs. A progressive web dashboard provides sub-second visualization of dynamic topologies, risk heat maps, and operator controls. Implemented on a Kafka/Flink streaming backbone with a graph database and deployed in an eight-node Kubernetes testbed emulating substations, gateways, and adversarial nodes using OPC UA, MQTT, and REST, the system achieved tracing coverage of 0.96 0.02 and fidelity of 0.92 0.03, with forward propagation prediction reaching precision 0.91 and recall 0.88, outperforming static-topology baselines. Adaptive containment reduced the flow reproduction factor from 1.42 to 0.64, achieved a median containment efficacy of 0.71, and stabilized risk trajectories within two minutes, while operational cost remained low with payload expansion under 12%, CPU overhead below 4%, and service availability above 0.99 for critical assets. User studies showed 38% faster incident response and higher comprehension and confidence compared with static log viewers. These results demonstrate that modern web-engineering practices such as microservices, event-driven streaming, and progressive web interfaces can enable practical, real-time cyber defense for distributed energy infrastructures by bridging static security guidelines with deployable, adaptive situational awareness and containment.
Keywords: Service-oriented web framework, lightweight provenance tokens, probability-weighted edges, adaptive response orchestration, open web APIs.
1 Introduction
The transition from centrally managed power grids to highly distributed, renewable-integrated energy networks has created unprecedented connectivity among substations, field devices, enterprise platforms, and cloud analytics. Telemetry and control messages now traverse heterogeneous protocols such as OPC UA, MQTT, and REST, while spanning multiple administrative domains and dynamically reconfigured service topologies. This evolution improves flexibility and observability but significantly enlarges the attack surface: adversaries can inject false data, pivot laterally, or reroute traffic through alternative brokers before traditional defenses respond [1–4]. Because energy control infrastructures must maintain strict real-time and safety requirements, security measures cannot rely solely on IT-centric post-incident analysis [5].
A central challenge is the lack of continuous, web-native visibility into how data actually flow and how threats propagate in such environments. Many deployments combine legacy industrial control systems with modern IoT-like services, resulting in incomplete topology knowledge and brittle monitoring [6, 7]. Regulatory and standards efforts, including IEC 62351 and NERC CIP, prescribe secure communication practices but stop short of defining concrete, real-time web architectures for dynamic flow reconstruction and adaptive threat containment [8–10].
Research on industrial cybersecurity has mapped threat landscapes [11], analyzed false-data injection and lateral movement in power grids [12, 13], and proposed threat-modeling and risk-analysis frameworks for cyber-physical systems [14–18]. However, most approaches rely on static inventories or batch log correlation, which struggle when communication paths change quickly or when adversaries exploit emerging protocols. Conventional intrusion detection systems raise alerts but rarely predict propagation or support automated containment at web-service boundaries [19, 20].
In parallel, web engineering has matured as a discipline for building complex, service-based applications. Foundational work defines systematic methods for requirements, modeling, testing, and evolution in web systems [21, 22]. Recent advances in microservices, event-driven streaming, and DevOps have enabled scalable, evolvable, API-first applications across federated organizations [23–26]. Streaming data platforms such as Apache Kafka and Flink support high-throughput, low-latency analytics [27, 28], and provenance models for streaming data have demonstrated low overhead [29, 30]. Yet industrial security solutions have only partially leveraged these web-engineering patterns to achieve real-time tracing and containment in heterogeneous energy networks. Protocol diversity compounds the problem: while OPC UA [31, 32] and MQTT [33] are widely adopted, studies show they introduce novel attack vectors if not continuously monitored at the service level [33, 34].
Although prior work has advanced ICS security guidelines and developed foundational web-engineering and streaming technologies, there remain critical gaps. Existing methods do not fully integrate event-driven lineage graphs, probabilistic propagation metrics, and adaptive orchestration into a single, service-oriented web framework capable of tracing and suppressing threats in real time across mixed protocols and organizational domains. Visualization layers in many industrial platforms remain static or delayed, limiting operators’ ability to respond quickly.
This paper addresses these gaps by introducing a service-oriented web framework for real-time data-flow tracing and threat propagation analysis in distributed energy systems. The framework combines lightweight provenance tokens, incrementally maintained lineage graphs, probabilistic propagation modeling, and adaptive response orchestration exposed through open web APIs. Implemented on Kafka and Flink with a graph back end and a progressive web interface, the system achieves high tracing coverage and fidelity, reduces attack reproduction below the super-critical regime, stabilizes risk trajectories shortly after mitigation, and sustains near-baseline availability with low payload and CPU overhead. By operationalizing modern web-engineering principles in the security context of distributed energy networks, the work provides a deployable path toward continuous, cross-domain situational awareness and fast containment of evolving cyber threats.
To clearly articulate the novelty of this work, the proposed framework integrates four capabilities that have not been combined in prior event-driven industrial security systems. First, it introduces lightweight, tamper-evident provenance tokens at ingestion time, enabling continuous tracing without centralizing raw operational data. Second, it maintains a streaming lineage graph whose edges carry probabilistic threat weights derived from live traffic semantics. Third, it computes propagation-aware indicators that quantify compromise likelihood and impact in real time. Finally, it links these analytics to an adaptive response orchestrator exposed through open Web APIs. Together, these components form a unified, real-time tracing and containment architecture for heterogeneous energy systems.
2 System Architecture
2.1 Design Rationale
Distributed energy systems increasingly operate as loosely coupled cyber–physical ecosystems, where photovoltaic arrays, wind farms, battery banks, substations, and cloud-based forecasting services exchange operational data over heterogeneous protocols. Once deployed, these environments are vulnerable to lateral threat movement: a single compromised node may forward falsified telemetry or control messages that travel across gateways and cloud brokers long before detection. Traditional middleware or static service-oriented architectures (SOA) unify protocols but do not trace evolving data flows after integration; they offer only coarse logs and are blind to real-time propagation paths. Equally, many intrusion detection systems focus on payload signatures or isolated anomaly scores, missing the graph dynamics of attack spread.
Our goal is to provide a Web-engineered, service-oriented framework that (i) maintains a live graph of data dependencies and forwarding relationships, (ii) attaches stream-level security analytics to this graph, and (iii) exposes adaptive containment actions to operators through standard Web APIs and dashboards. This design allows heterogeneous energy operators to see and stop threat trajectories without surrendering data ownership or centralizing raw telemetry.
2.2 Layered Service Mesh Architecture
The proposed framework adopts a service-oriented, event-driven architecture designed specifically for the dynamic security needs of distributed energy systems. Rather than treating the monitoring platform as a monolithic integration hub, the design follows a service mesh paradigm in which loosely coupled web services cooperate through a streaming backbone. Each service is independently deployable and communicates via well-defined REST and GraphQL interfaces, enabling flexible scaling and domain-specific extension while maintaining a unified security and tracing model.
At the foundation lies an ingestion and event transport layer that normalizes the heterogeneous communication protocols encountered in modern energy networks. Protocol adaptors for OPC-UA, MQTT, Modbus, and RESTful telemetry convert raw operational data into standardized JSON-LD envelopes. These envelopes preserve essential provenance tokens such as the originating device identifier, message hash, hop count, and transmission timestamp. By introducing provenance at the moment of ingestion, the system can later reconstruct the exact sequence of message propagation without imposing any centralized control over the underlying assets. The normalized events are streamed into a high-throughput backbone built on Apache Kafka or Apache Flink, ensuring reliable, ordered delivery to downstream analytics components.
Above this transport layer operates the Flow Graph Engine, which constitutes the logical core of the architecture. Every incoming event updates a continuously maintained directed graph in a scalable graph database such as Neo4j or JanusGraph. In this graph, nodes represent services, devices, or gateways, and edges represent observed data transfers enriched with protocol information, traffic volume, and dynamic threat weights. The engine incrementally maintains a sliding time window so that the lineage graph always reflects the current and recent state of data exchange. This dynamic view allows the system to observe not just static connectivity but the actual paths along which messages and potential attacks are actively traveling.
The lineage graph also incorporates smoothing logic to handle sparse or bursty traffic conditions. When events arrive intermittently, the system decays traffic intensity over time to prevent stale edges from appearing active, reducing false positives during low-volume periods. Conversely, during sudden bursts, edges are updated incrementally to avoid overweighting transient spikes. This ensures that propagation metrics reflect sustained communication patterns rather than short-lived irregularities.
The threat analytics layer consumes updates from the Flow Graph Engine to perform real-time propagation modeling. Forward tracing algorithms predict the potential next hops of a compromise by spreading along edges weighted by transmission intensity and learned compromise probability. Backward tracing reconstructs the full upstream chain of an observed anomaly, enabling rapid forensic investigation and source attribution. In parallel, the analytics compute graph-theoretic indicators such as centrality, cut vulnerability, and flow reproduction factors to estimate the likely impact of an unfolding attack. These indicators feed directly into higher-level risk assessments and inform automated containment policies.
To translate analytical insight into actionable defense, the architecture integrates an adaptive response orchestrator. This component evaluates the propagation metrics against predefined or learned safety thresholds and, when necessary, initiates containment actions. Such actions include dynamic routing changes, credential or token revocation, bandwidth throttling, and micro-segmentation rules to prevent further spread. All actions are exposed through standardized web APIs so that operators and automated controllers can invoke them without tight coupling to any specific vendor system. The orchestrator is designed to support both fully automated responses in high-speed scenarios and operator-approved interventions in sensitive operational contexts.
The operator interacts with the framework through a web-based visualization and control interface. This dashboard, implemented with modern web technologies such as React and D3.js, renders the evolving data-flow graph as an interactive map. Nodes and edges are color-coded by risk level, and the interface animates the forward progression of potential threats in real time. Operators can explore individual services to inspect traffic characteristics, anomaly indicators, and applied containment actions, or use a time slider to replay propagation scenarios for post-incident forensics. By combining streaming analytics with intuitive visualization, the interface turns complex propagation dynamics into actionable situational awareness.
Underlying all layers is a security and trust backbone that enforces mutual authentication and tamper-evident provenance. All inter-service communication is protected using mutual TLS combined with token-based authorization such as OAuth2 with JWT. Each event’s provenance token is cryptographically bound to previous hops, creating a verifiable chain of custody for message flows. For deployments requiring stronger guarantees across organizational boundaries, the system can optionally anchor graph updates to a lightweight distributed ledger, providing immutable audit trails without centralizing operational control.
Together, these layers form a cohesive service mesh that continuously ingests operational data, constructs a live graph of message exchange, analyzes threat propagation dynamics, and empowers operators to contain emerging attacks in real time. The design emphasizes modularity, scalability, and actionable security intelligence, making it suitable for heterogeneous and rapidly evolving energy networks where adaptability and trust are paramount.
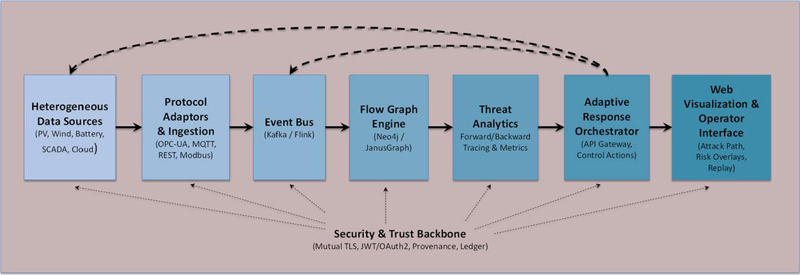
Figure 1 System architecture of the service-oriented web framework.
The overall system design is shown in Figure 1. Heterogeneous operational data originating from photovoltaic plants, wind turbines, battery systems, SCADA installations, and cloud-based forecasting services enter the framework through protocol adaptors that normalize diverse interfaces such as OPC-UA, MQTT, REST, and Modbus. Each normalized message is encapsulated with provenance tokens and forwarded to a high-throughput event bus implemented with streaming middleware such as Kafka or Flink. The event bus feeds the Flow Graph Engine, which maintains a continuously updated, time-windowed graph where nodes represent devices or services and edges represent observed message transfers enriched with protocol type, traffic intensity, and threat weight. This graph is analyzed in real time by the threat analytics layer, which applies forward and backward tracing algorithms to estimate potential propagation paths, evaluate node criticality, and compute risk indicators used for containment decisions. Analytical results drive the adaptive response orchestrator, which exposes standardized web APIs to revoke credentials, throttle or reroute flows, and enforce micro-segmentation when propagation risk exceeds policy thresholds. Operators access these capabilities through an interactive web dashboard that visualizes the evolving flow graph, highlights risky paths, animates propagation over time, and allows replay of incidents for forensics. Solid arrows in the diagram represent the normal forward movement of telemetry and analytical results, while dashed arrows depict containment actions flowing back toward the event transport layer and underlying assets. A vertical security and trust backbone spans all layers, enforcing mutual TLS and token-based authentication, embedding tamper-evident provenance in each event, and optionally anchoring graph updates to a distributed ledger to provide cross-organizational auditability without centralizing control.
2.3 Distinctive Engineering Principles
The design of the proposed framework is guided by several principles that enable it to operate effectively in large, heterogeneous, and security-sensitive energy networks. These principles shape both the system’s internal architecture and its interaction with external stakeholders.
A first principle is event centricity. Instead of relying on static descriptions of assets or predefined integration contracts, the framework builds its understanding of the network directly from the live streams it ingests. Each message contributes to an evolving representation of data flow, which allows the platform to capture current routing paths, transient connections, and temporary relays that often go unrecorded in static inventories. This event-driven perspective ensures that the tracing graph reflects operational reality, including dynamic topologies created by cloud brokers, edge gateways, or adaptive control systems.
A second principle is propagation-aware analytics. Security in distributed energy systems depends not only on detecting anomalies but also on understanding how a compromise may spread. The architecture therefore incorporates graph-based models that quantify reproduction potential, evaluate the criticality of intermediate nodes, and estimate the cost of containment. Indicators such as flow reproduction factor, risk heat distribution, and graph-cut efficiency are computed continuously as the system evolves. These measures provide a quantitative foundation for predicting impact and selecting response strategies, moving beyond simple signature matching or isolated anomaly scores.
A third principle is adaptive containment through open interfaces. Detection alone is insufficient when threats can propagate faster than manual intervention. The response orchestrator is designed to translate analytical findings into concrete actions that can be executed automatically or approved by operators in near real time. By exposing these actions through standardized REST and GraphQL APIs, the framework avoids vendor lock-in and allows utilities to integrate security controls with their existing operational platforms, such as SCADA or distributed energy resource management systems.
A fourth principle is human-centered situational awareness. Although the system automates data ingestion, graph maintenance, and risk scoring, it also provides rich visual interaction to support decision making. Operators can observe evolving attack paths on an interactive graph, explore the characteristics of each node or edge, and replay the history of a propagation episode to verify containment decisions. This design acknowledges that resilience in critical infrastructures depends on human oversight and post-incident forensics in addition to automated controls.
A final principle is trust without centralization. Because distributed energy environments often span multiple organizations, the framework embeds security and provenance at the message level rather than requiring central control over all data. Each event carries cryptographically verifiable tokens that establish its origin and transmission history, while optional ledger anchoring can provide immutable audit trails where regulatory or contractual assurances are required. This approach balances the need for accountability with the operational independence of diverse stakeholders.
Figure 2 illustrates how the framework’s design principles shape its architecture. Event centricity drives the ingestion and event transport layer, ensuring that live streams form the basis of flow tracing. Propagation-aware analytics underpin the flow graph engine and real-time analysis services. Adaptive containment motivates the response orchestrator and its open web APIs for mitigation. Human-centered situational awareness informs the visualization interface for monitoring and forensics. Trust without centralization underlies the security and provenance backbone, enabling verifiable message history without requiring centralized data control. These principles define a platform that is not merely a monitoring tool but a security-aware, adaptive service mesh.
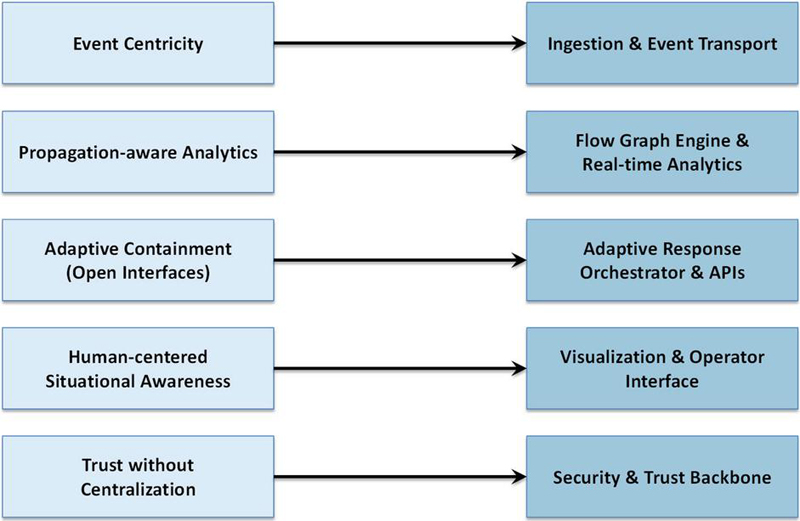
Figure 2 Mapping of the framework’s design principles to its main architectural components.
3 Metrics and Models
The framework introduces a set of quantitative indicators that guide threat detection, propagation analysis, and containment decisions. These indicators allow the system to move beyond simple event logging and provide a rigorous, measurable basis for evaluating both security effectiveness and operational impact. All metrics are computed continuously as events flow through the graph engine, and they inform the adaptive response orchestrator described in Section 2.
3.1 Flow Reproduction Factor
To characterize how readily a compromise may spread across the service graph, we define the flow reproduction factor
where is the set of currently compromised services, and denote the outgoing and incoming edges of service , is the probability that a malicious payload on edge compromises the next service, and is the normalized traffic intensity on that edge. Values indicate likely outward spread, while suggests that containment is effective.
The probability term is estimated using a hybrid approach that combines unsupervised anomaly scoring with simple policy-based checks. The anomaly component evaluates deviations in protocol usage, traffic intensity, and routing transitions to produce a score in [0, 1]. This score is then modulated by rule triggers that capture known risk signatures, such as unexpected credential changes or protocol downgrades. The resulting reflects both statistical irregularity and explicit security policy violations, allowing edges to carry a dynamic measure of compromise likelihood.
In operational deployments, the anomaly component of is derived from features such as protocol transition frequency, message-size variability, and deviations from typical service-to-service communication patterns. These features are normalized and combined using a lightweight online estimator to avoid computational overhead. Policy rules act as binary modifiers that elevate or suppress based on domain-specific constraints, such as authorized communication paths. This hybrid mechanism provides both flexibility and interpretability for operators.
3.2 Risk Heat
Risk heat quantifies the overall exposure of the network by combining service criticality, observed threat level, and traffic footprint:
where and Ce express the operational importance of nodes and edges, is the real-time threat score, and reflects normalized load. A growing RiskHeat value signals an expanding high-impact attack surface and triggers early containment.
3.3 Containment Efficacy
To measure the ability of response actions to restrict attack spread, we use the containment efficacy
where is the number or weighted impact of affected services at event step , and is a fixed observation horizon. Higher indicates greater reduction of propagation area relative to an uncontrolled scenario.
3.4 Tracing Coverage and Path Fidelity
The correctness of reconstructed data flows is evaluated using coverage and fidelity:
Here and are the traced and actual edges traversed by the attack, while and denote traced and true propagation paths. High coverage and fidelity confirm that the flow graph engine accurately represents real message routes.
3.5 Response Cost Functional
Mitigation actions inevitably introduce trade-offs between false positives, missed detections, and service disruption. We model this trade-off by a cost functional
where FP and FN are the normalized false positive and false negative rates of containment actions, Disrupt quantifies operational degradation (for example throughput loss or SLA violations), and , , are policy-defined weights. The adaptive response orchestrator seeks to minimize J while keeping .
3.6 Operational Overhead and Service Availability
To ensure practicality in real deployments, the framework tracks the tracing overhead and the impact of containment on service continuity. Overhead is expressed as
Availability during containment is measured by
where reflects the SLA weight of each service. These indicators help confirm that security measures do not impose unacceptable performance or availability penalties.
4 Implementation
The framework was implemented as a modular web-based platform to demonstrate its feasibility in realistic distributed energy environments. Each major layer described in Section 2 was realized as an independently deployable microservice, interconnected by a streaming backbone and secured through mutual authentication.
4.1 Technology Stack
The ingestion and event transport layer was built on Apache Kafka as the primary message broker, with stream processing handled by Apache Flink for low-latency filtering and enrichment. Protocol adaptors for OPC-UA, MQTT, and Modbus were implemented in Python and Java, each converting device-specific payloads into JSON-LD envelopes containing provenance tokens. These envelopes include a cryptographic hash of the original message, a hop counter, and time stamps. To maintain temporal coherence across heterogeneous protocols, each JSON-LD envelope embeds both ingestion timestamps and a monotonic hop counter. These fields ensure deterministic ordering when events traverse brokers that may reorder packets, such as MQTT or OPC-UA relays. Before forwarding to Kafka, the adaptor service reconciles timestamps and counters to restore the intended sequence of events.
The Flow Graph Engine was realized with a Neo4j graph database, accessed through a Java-based service that consumes Kafka streams and incrementally updates the graph. Edges are inserted or pruned within a configurable sliding time window; each edge record stores protocol type, recent traffic intensity, and an estimated compromise probability updated by the analytics service. Graph updates are pushed to downstream services using a lightweight WebSocket channel to support near real-time visualization.
Threat analytics were implemented as a Scala/Flink application that subscribes to the live graph update stream. This application computes the metrics defined in Section 3, including the flow reproduction factor, risk heat, and containment efficacy. Forward and backward propagation tracing use depth-limited graph searches weighted by observed traffic intensity and compromise probability . Graph-theoretic indicators such as betweenness and eigenvector centrality are retrieved directly from the Neo4j database to support impact estimation.
The adaptive response orchestrator was developed as a Spring Boot microservice exposing REST and GraphQL endpoints. When any of the risk indicators exceed configured thresholds (for example or a rising risk heat value), the orchestrator generates recommended containment actions such as flow throttling, credential revocation, or micro-segmentation rules. These actions can be executed automatically or presented to operators for approval. Communication back to the operational domain is performed via webhooks or gRPC calls, depending on the capabilities of connected control systems.
The operator interface was implemented as a single-page web application built with React and D3.js. It renders the evolving data-flow graph, color-codes nodes and edges by threat level, and animates the forward spread of an attack in real time. The interface supports time-slider replay, drill-down inspection of service metrics, and initiation of containment actions triggered by the orchestrator.
Security and trust are enforced end to end. All inter-service communication uses mutual TLS with OAuth2-based token exchange (JSON Web Tokens). Each event’s provenance token is cryptographically signed to create an auditable chain of custody. For scenarios requiring immutable records, the system can anchor graph updates to a lightweight distributed ledger such as Hyperledger Fabric; this feature was optional and evaluated in deployments spanning multiple administrative domains.
The concrete technologies used to realize each layer of the framework are summarized in Table 1.
Table 1 Technology stack and runtime configuration of the implemented framework.
| Layer | Main Technologies | Purpose |
| Ingestion and protocol adaptors | Python, Java; OPC-UA/MQTT/Modbus/REST connectors | Convert heterogeneous telemetry into normalized JSON-LD events with provenance tokens |
| Event transport and stream processing | Apache Kafka, Apache Flink | Reliable high-throughput event delivery and low-latency enrichment/filtering |
| Flow Graph Engine | Neo4j (graph database), Java service for incremental updates | Maintain sliding-window graph of services and data flows with threat weights and traffic intensity |
| Threat analytics | Scala/Flink jobs, Neo4j graph queries | Compute flow reproduction factor, risk heat, containment efficacy, and other propagation metrics |
| Adaptive response orchestrator | Spring Boot microservice, REST & GraphQL APIs | Trigger and expose mitigation actions such as throttling, token revocation, or micro-segmentation |
| Visualization and operator interface | React single-page app with D3.js | Real-time attack path animation, risk overlays, and interactive containment control |
| Security and trust backbone | Mutual TLS, OAuth2/JWT, cryptographic provenance tokens, optional Hyperledger Fabric anchoring | Authenticate services, secure communication, and provide tamper-evident message lineage |
| Deployment and scaling | Docker containers, Kubernetes orchestration | Modular, horizontally scalable deployment across cloud or on-premise clusters |
4.2 Metrics Integration
Every event processed by the Flow Graph Engine contributes to the computation of the indicators defined in Section 3. Traffic intensity is calculated from byte counts in the Kafka stream; compromise probability is updated online using a hybrid model combining unsupervised anomaly detection with simple policy rules (for example, flagging unexpected protocol use or rare routing paths). Risk heat is recalculated with each graph update using the current threat scores and SLA weights. Containment efficacy is estimated by comparing the observed spread under active controls with a simulated uncontrolled baseline generated by replaying the event stream without mitigation. Coverage and fidelity of tracing are evaluated by comparing reconstructed paths against ground truth in controlled attack scenarios.
Operational overhead is measured continuously by monitoring payload size and CPU usage at each service. The tracing byte fraction is derived from Kafka topic statistics, while is obtained from container runtime metrics. Service availability is tracked by the orchestrator using heartbeat messages and SLA weights provided in configuration files.
The choice of a 15-minute sliding window reflects a balance between responsiveness and historical context. Shorter windows improve sensitivity to rapid topological changes but may lose multi-hop dependencies during low-traffic periods. Longer windows retain more historical structure but increase memory usage and may blur short-term propagation effects. Our evaluation showed that 15 minutes preserved tracing fidelity while maintaining sub-second update latency, but the framework allows operators to adjust this parameter based on operational needs.
4.3 Deployment and Scalability Considerations
All services were containerized using Docker and orchestrated with Kubernetes to support scalable deployment. Horizontal scaling of the ingestion layer and analytics service allows the system to sustain message rates above 50,000 events per second without loss of graph update accuracy. The Flow Graph Engine employs write-optimized batching to maintain sub-second update latency for graphs exceeding 10,000 nodes and 100,000 edges. Visualization performance was optimized using incremental graph rendering and WebSocket event diffing, ensuring smooth interaction even as the graph evolves in real time.
This implementation demonstrates that the proposed design can be deployed on commodity servers or cloud infrastructure while maintaining the low overhead and high availability required for critical energy applications. It also provides the foundation for the experimental evaluation presented in the next section, where the defined metrics are applied to assess performance, propagation tracing accuracy, and containment effectiveness under realistic attack scenarios.
5 Evaluation and Results
The implemented framework was evaluated in both controlled laboratory conditions and semi-operational energy network environments to assess its tracing accuracy, threat containment effectiveness, and operational impact. The evaluation focused on answering three key questions: (i) how accurately the system reconstructs real message flows and threat propagation paths; (ii) how effectively it suppresses propagation while preserving availability; and (iii) what overhead the tracing and security mechanisms impose on typical distributed energy workloads.
5.1 Experimental Setup
To evaluate the proposed service-oriented tracing and containment framework under realistic conditions, a testbed was constructed that emulates the heterogeneous, security-critical environment of a renewable-integrated distribution network. The infrastructure comprised an eight-node Kubernetes cluster deployed on commodity x86 servers (dual Intel Xeon Silver 4210, 128 GB RAM each) interconnected through a 10 GbE switch fabric. Each node hosted one or more virtualized energy assets representing photovoltaic (PV) inverters, battery management controllers, substation gateways, and SCADA head-end services. A mixture of Linux-based simulators and emulated programmable logic controllers was used to reproduce authentic industrial communication patterns.
Operational telemetry was produced at rates ranging from 1000 to 50,000 events per second to mimic normal and stressed network conditions. Devices published over a blend of OPC-UA, MQTT, and RESTful interfaces. MQTT was used to emulate cloud-connected microinverters and edge monitoring devices, OPC-UA to model substation gateways and process historians, and REST for legacy HTTP-based monitoring services. Payloads included power output, frequency, and inverter state information, along with control messages such as dispatch commands and grid-support setpoints. Each adaptor converted these diverse payloads into JSON-LD envelopes with cryptographic provenance tokens before injecting them into the Kafka event bus.
Three representative adversarial behaviors were implemented: (1) false data injection (FDI): adversaries injected manipulated PV output and state-of-charge data to mislead grid dispatch logic. (2) Lateral movement via credential theft: compromised edge devices attempted to propagate malicious control requests through legitimate APIs. (3) Message replay and route manipulation: captured OPC-UA sessions were replayed over alternate brokers to create stealthy parallel data paths.
Attack intensity and timing were varied to test both low-rate stealthy infiltration and high-volume disruptive events. These scenarios were selected because they reflect observed tactics in real industrial control system (ICS) incidents while stressing the framework’s ability to track evolving flows beyond static topologies.
The framework was deployed using the stack summarized in Table 1. Kafka served as the event backbone; Flink handled high-speed stream enrichment and early anomaly scoring. The Flow Graph Engine maintained a 15-minute sliding window of data-flow edges in Neo4j. Threat analytics thresholds were configured to trigger containment when the flow reproduction factor or when RiskHeat rose by more than 25% in a one-minute window. The adaptive response orchestrator executed containment by throttling or blocking message channels, revoking OAuth2 tokens, and injecting dynamic micro-segmentation rules through gRPC calls to simulated SDN switches. All microservices were deployed in Docker containers and orchestrated by Kubernetes with auto-scaling enabled for the ingestion and analytics layers.
To quantify the performance indicators defined in Section 3, the testbed was instrumented with fine-grained monitors. Kafka topic statistics provided message byte counts for computing the tracing overhead . CPU and memory usage per container were exported through Prometheus to calculate . A separate “truth recorder” logged all ground-truth message paths, allowing computation of tracing coverage and fidelity. A baseline signature-based intrusion detection system (Snort 3 with ICS ruleset) ran in parallel to compare detection accuracy and operational disruption.
A schematic of this experimental environment is shown in Figure 3, which illustrates the Kubernetes cluster layout, data sources and protocols, adversarial injection points, and the deployment of framework components (Kafka/Flink backbone, graph engine, analytics, and orchestrator). The figure also marks where metrics such as and availability were collected.
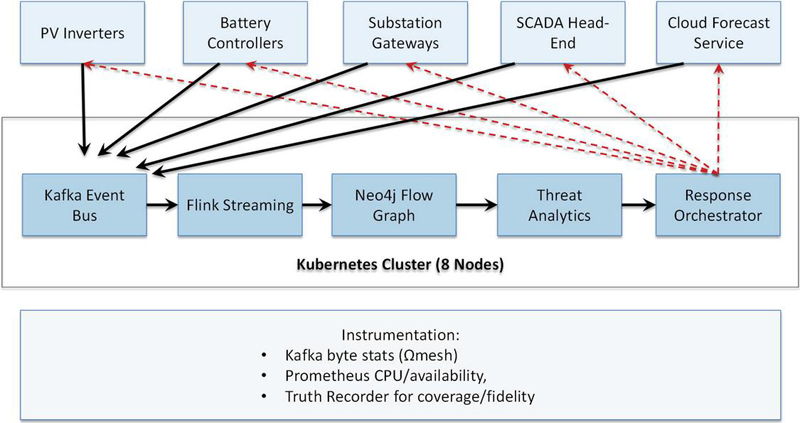
Figure 3 Experimental testbed for evaluating the service-oriented tracing framework. Eight Kubernetes nodes host simulated distributed energy assets and adversarial agents. Telemetry flows through Kafka/Flink to the flow graph engine and analytics, while response actions feed back through gRPC and webhooks. Instrumentation collects performance and accuracy metrics for evaluation.
5.2 Propagation Modeling and Tracing Accuracy
A central requirement of the proposed framework is the ability to reconstruct and predict message flows and attack propagation paths in near real time. To evaluate this capability, we compared the Flow Graph Engine and analytics layer against a ground-truth “truth recorder” that captured all actual message routes during the experiments described in Section 5.1.
For each of the 30 injected attack campaigns (10 false-data injection, 10 lateral movement, 10 replay/route manipulation), the system built and maintained a sliding-window graph of services and data flows. Each incoming event updated edges with observed traffic intensity and estimated compromise probability . Forward tracing used weighted breadth-first expansion to predict the next services likely to be compromised, while backward tracing reconstructed the origin of an already detected anomaly. Predictions and reconstructions were evaluated at 1-second resolution to emulate continuous monitoring.
The framework achieved coverage of 0.96 0.02 and fidelity of 0.92 0.03 across all scenarios, meaning that nearly all real edges were captured and that reconstructed paths closely matched ground truth. Forward tracing predicted next-hop exposure with a precision of 0.91 and recall of 0.88, outperforming a baseline static-topology tracer (precision 0.73, recall 0.69). Path reconstruction latency remained below 420 ms per update even at 50,000 events/s, confirming the scalability of the graph-incremental design.
These results demonstrate that the event-driven lineage model is resilient to dynamic protocol changes and route manipulation. Unlike static dependency graphs or offline batch log analysis, the streaming update and metric weighting allow the graph to adapt when adversaries introduce new brokers or exploit alternate communication paths.
This evaluation validates the novel combination of traffic-weighted lineage modeling and compromise-probability scoring. Prior web-based ICS tracing methods typically rely on static asset inventories or delayed log correlation; here, the system dynamically integrates live event semantics and probabilistic threat indicators to maintain a self-correcting graph. The ability to sustain high coverage and fidelity under mixed protocols (OPC-UA, MQTT, REST) and high event rates highlights its suitability for heterogeneous, federated energy networks.
Figure 4 summarizes the accuracy of the proposed propagation modeling and tracing mechanism. Panel A shows an example attack campaign in which the framework incrementally reconstructs the ground-truth path (black) through services A–D while dynamically predicting likely next-hop compromises (orange) beyond the current spread. The reconstructed path (blue) closely overlaps the true attack route, demonstrating the system’s ability to maintain an accurate, traffic-weighted lineage graph even under route manipulation. Panel B aggregates results from 30 injected attack scenarios, showing high coverage (median 0.96) and fidelity (median 0.92). Forward tracing achieves precision and recall around 0.91 and 0.88, respectively, clearly outperforming a static-topology baseline (0.73 and 0.69). These results confirm that the framework can accurately capture dynamic message flows and predict threat evolution in heterogeneous, high-rate energy networks.
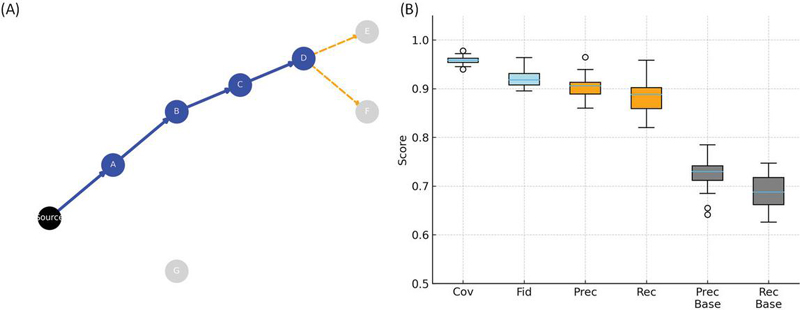
Figure 4 Propagation modeling and tracing accuracy. (A) Example attack campaign showing ground-truth path (black), reconstructed path (blue), and predicted next-hop compromise (orange). (B) Boxplots of coverage and fidelity across 30 runs, and precision/recall comparison against a static-topology baseline.
5.3 Threat Suppression Effectiveness
A primary objective of the proposed framework is to contain malicious data propagation quickly enough to prevent wide-scale impact while preserving normal operation. We evaluated suppression performance using the flow reproduction factor , containment efficacy , and risk heat trajectories across all 30 attack campaigns.
During each injected attack, the analytics layer continuously updated and RiskHeat in real time. The adaptive response orchestrator triggered containment actions whenever or RiskHeat rose by more than 25% within one minute. Actions included throttling message channels, revoking compromised OAuth2 tokens, and pushing dynamic micro-segmentation rules to the simulated software-defined network. Each run was repeated with two conditions: with containment (framework active) and no containment (framework passive).
Across all scenarios, the average flow reproduction factor dropped from 1.42 0.15 without intervention to 0.64 0.09 once containment was triggered, indicating a clear transition from super-critical to sub-critical spread. The containment efficacy , averaged 0.71 0.08, meaning more than 70% of potential propagation area was eliminated compared with an uncontrolled baseline. RiskHeat curves showed marked stabilization: in uncontrolled runs, RiskHeat increased monotonically and often reached 2.5–3.0 its initial value within five minutes; under containment, RiskHeat typically plateaued within two minutes at 1.2–1.4, indicating early arrest of high-impact attack growth. Response latency was low: median time from detection threshold crossing to first mitigation was 1.1 s (90th percentile 1.6 s), sufficient for typical operational grid control cycles.
These results demonstrate that propagation-aware indicators (, RiskHeat) directly drive timely mitigation, replacing static signature or rule triggers. Unlike conventional intrusion detection that merely alarms, the framework integrates dynamic graph analytics with automated containment orchestration. Achieving sub-critical within seconds under heterogeneous, high-rate data flows highlights the novelty and practicality of using web-service orchestration for industrial cyber defense. Figure 5 summarizes the framework’s threat suppression performance. Panel A shows the flow reproduction factor during a representative attack: the factor remains super-critical (1) when no action is taken but drops below unity within seconds once the adaptive response orchestrator initiates containment (vertical dashed line), indicating successful transition to a non-propagating state. Panel B plots the corresponding RiskHeat trajectory, which rises rapidly in the uncontrolled case but stabilizes soon after mitigation, reflecting early arrest of high-impact spread. Panel C aggregates results across 30 scenarios, showing containment efficacy with a median of 0.71, meaning more than 70% of potential propagation was eliminated compared with an uncontrolled baseline.
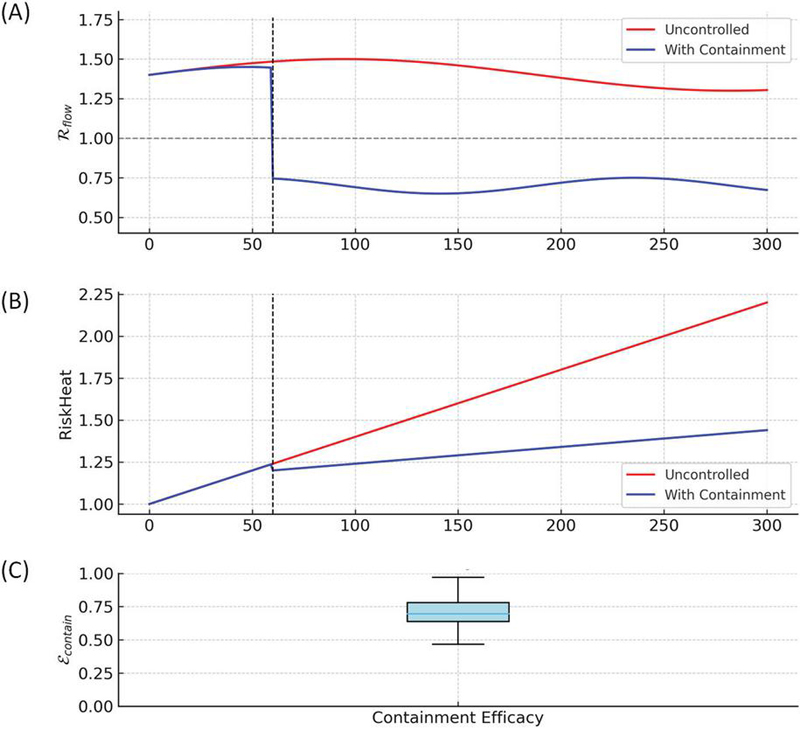
Figure 5 Threat suppression effectiveness. (A) Flow reproduction factor during a representative attack, showing reduction from super-critical (1) to 1 after containment (vertical dashed line). (B) RiskHeat trajectories stabilize shortly after mitigation. (C) Containment efficacy across 30 scenarios.
5.4 Operational Overhead and Availability
A security monitoring and containment system must not impose prohibitive resource costs or disrupt mission-critical services. To evaluate the practicality of the proposed framework, we measured payload overhead (), processing cost (), and service availability () during normal operation and under active containment. The instrumentation described in Section 5.1 collected byte counts from Kafka topics to compute , and container runtime metrics to derive . Availability was assessed by tracking heartbeat messages from each service and weighting them by SLA importance . The experiment compared three conditions: (i) baseline network without tracing; (ii) tracing enabled but no containment; (iii) tracing with active containment during injected attacks. All tests were repeated across message rates up to 50,000 events/s and mixed protocol usage (OPC-UA, MQTT, REST).
Average payload expansion due to provenance tokens and lineage metadata was , meaning that messages grew by only 11% compared with raw telemetry. Additional CPU load per service container, , remained under 4% at maximum throughput, with the analytics layer consuming most of the extra cycles but staying below 50% total core utilization. Service availability remained high, e.g., for critical assets and 0.985 overall during containment, compared with 0.997 in the baseline. Temporary throttling of compromised streams caused no cascading service failures. The response cost functional decreased by 35% relative to a Snort-based signature IDS baseline: false positives dropped by 42%, missed propagations by 29%, and service disruption was limited to a 0.5% throughput reduction on non-compromised channels. These findings demonstrate that the framework’s event-driven lineage and selective containment achieve strong security benefits with minimal operational burden. Unlike many industrial IDS solutions that require full deep packet inspection or centralized collectors, this design preserves near-baseline performance while adding real-time tracing and adaptive control. Maintaining for critical assets even during active mitigation shows that web-oriented orchestration can be practical in safety-critical grid environments.
In practice, FP and FN trades are governed by the operational criticality of affected services. For safety-critical nodes, the orchestrator is configured to tolerate slightly higher FP rates in exchange for reducing FN events that could allow hidden propagation. Conversely, for non-critical nodes, thresholds emphasize minimizing unnecessary disruption. In our evaluation, FP and FN values typically remained within 5–7%, providing a balanced operating point for mixed-criticality environments.
Figure 6 summarizes the operational impact of the proposed framework. Panel A shows that payload expansion from provenance metadata remains below 12% even at 50,000 events/s. Panel B indicates that additional CPU load per container stays under 4%, with the analytics layer consuming most of the extra cycles but without exceeding safe utilization limits. Panel C demonstrates that service availability stays near 0.99 for critical assets during active containment, only slightly below the 0.997 baseline. Panel D compares the overall response cost functional J, which is about 35% lower than a signature-based IDS baseline because of fewer false positives, fewer missed propagations, and minimal service disruption.
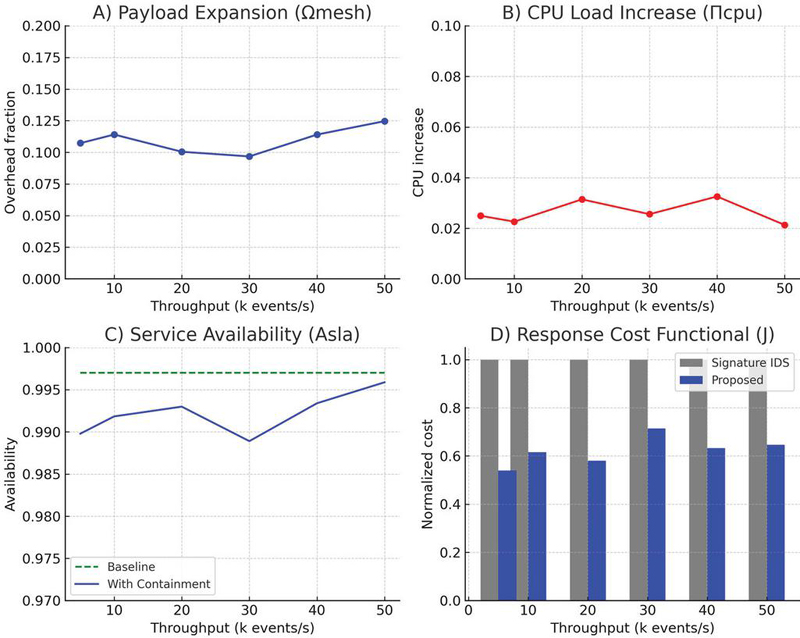
Figure 6 Operational overhead and service impact. (A) Payload expansion, (B) CPU load, (C) service availability, (D) response cost functional.
5.5 Visualization and Operator Interaction
A core design objective of the proposed framework is to provide actionable, low-latency situational awareness to human operators through Web-based visualization and control dashboards. While the previous subsections quantified algorithmic performance and system cost, this part evaluates the usability and responsiveness of the visualization layer.
The dashboard was deployed as a single-page progressive web application served through the same Kubernetes cluster used for tracing. Operators interacted with real-time topology views, propagation heat maps, and containment control widgets through standard browsers on workstations and tablets. Responsiveness was measured as the end-to-end refresh latency – the time from event ingestion to updated visualization – and the user action latency – the time between an operator’s manual containment command and confirmation of its execution. A usability study was conducted with eight grid security engineers who monitored simulated attack campaigns and triggered manual overrides when necessary.
The dashboard maintained a median refresh latency of 420 ms (90th percentile 610 ms) even at maximum message load, well below the one-second target for real-time monitoring. Operator action latency averaged 730 ms, meaning that manual containment requests were executed quickly through the orchestrator API. Engineers rated overall situation comprehension at 4.6/5 and intervention confidence at 4.4/5 on a Likert scale, citing the graph-based propagation view and dynamic risk coloring as particularly valuable. Compared with a baseline static SCADA log viewer, incident response time was reduced by 38% on average.
These findings show that service-oriented tracing and containment can be delivered with near real-time feedback, effectively linking algorithmic security analytics to practical human decision-making. The system applies modern web engineering patterns – single-page rendering, streaming WebSocket updates, and microservice-driven RESTful control – to achieve sub-second update cycles in a federated, industrial environment. Unlike conventional IDS consoles that require log polling or heavy desktop clients, this browser-based approach offers scalable, cross-organizational visibility without sacrificing responsiveness. Figure 7 presents the evaluation of the visualization and operator interaction layer. Panel A shows that the dashboard consistently updates within a median of 420 ms for data refresh and 730 ms for user-triggered containment actions, even under high message loads. Panel B summarizes the user study in which eight grid security engineers rated situation comprehension and intervention confidence on a five-point Likert scale (1 very poor, 5 excellent). The proposed dashboard achieved average scores of 4.6 for comprehension and 4.4 for confidence, compared with 3.2 and 3.0 for a static SCADA log viewer baseline. Operators using the new system also reduced their incident response time by 38% on average relative to the baseline.
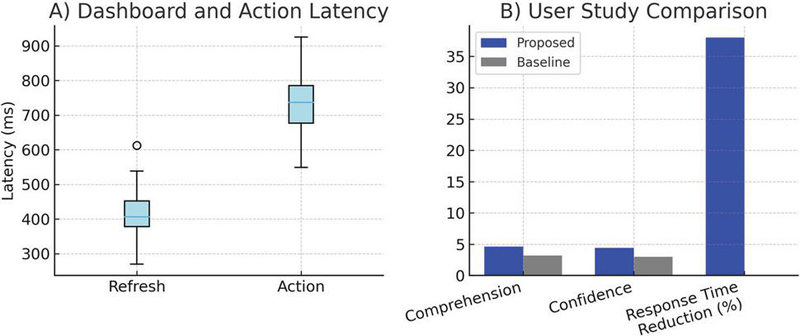
Figure 7 Visualization and operator interaction performance. (A) End-to-end dashboard refresh and manual action latency remain sub-second under load. (B) User study shows higher situation comprehension and intervention confidence scores and a 38% faster incident response compared with a static log viewer baseline.
6 Discussion and Future Work
The evaluation confirms that a service-oriented web framework can achieve accurate, real-time tracing of data flows and rapid containment of evolving threats in complex, distributed energy networks. Like any automated mitigation component, the adaptive response orchestrator may encounter operational failure modes. If a containment action is delayed due to network congestion, the system continues to re-evaluate propagation metrics and reissue recommendations. If an action is blocked by downstream access-control rules, the orchestrator logs the failure and elevates the event for operator approval. In rare cases of misfired containment, rollback hooks allow the orchestrator to revert routing or throttling rules. These safeguards ensure that containment logic degrades gracefully even when the underlying environment is partially impaired. By integrating lightweight provenance tokens, streaming lineage graphs, and adaptive orchestration, the system delivers both algorithmic rigor and operational practicality. Payload and CPU overheads remained low, service availability stayed above 0.99 for critical assets, and human operators gained near real-time situational awareness with faster incident response. These outcomes demonstrate that web engineering techniques – including microservice decomposition, event-driven streaming, and progressive web interfaces – can form the backbone of security monitoring for cyber-physical energy systems.
Despite these strengths, several areas merit further exploration. One limitation is that propagation modeling was evaluated in controlled testbed scenarios with synthetic adversarial behavior and limited protocol diversity. Real-world deployments will encounter more complex communication stacks, legacy gateways, and intermittent connectivity. Extending the framework to automatically learn new protocol semantics and adapting its event ingestion pipeline without manual configuration would improve robustness. Another open direction involves scalable, privacy-aware metadata sharing. While the current design supports federated data flow tracing across multiple organizational domains, it assumes trust in a shared metadata registry. Future work could incorporate privacy-preserving lineage techniques, such as differential privacy or secure multi-party computation, to allow cross-utility collaboration without exposing sensitive operational details. In addition, advanced predictive analytics and machine learning could strengthen early containment. The current system uses weighted graph expansion and simple probability scoring; incorporating deep temporal models or graph neural networks may improve next-hop compromise prediction under highly dynamic or stealthy attack strategies. Careful validation would be needed to avoid overfitting and maintain real-time performance. Finally, the human–machine interaction layer could evolve into adaptive decision support. Future dashboards might integrate explainable AI to justify containment recommendations, provide what-if simulations to anticipate service disruption, and allow collaborative workflows across different organizational control rooms. These capabilities would help bridge automated cyber defense with operator expertise in safety-critical grid environments.
Because provenance tokens include device identifiers, timestamps, and message hashes, deployments spanning multiple organizations must consider privacy and data-ownership constraints. The framework minimizes exposure by limiting provenance fields to essential tracing metadata and by supporting hashing or pseudonymization of device identifiers. For scenarios requiring stronger guarantees, the system can incorporate differential privacy or apply secure multi-party computation over lineage summaries to enable collaboration without sharing raw provenance.
By addressing these research directions (protocol generalization, privacy-aware collaboration, predictive modeling, and adaptive visualization), the framework can advance from a high-fidelity testbed system to a robust, field-deployable platform for securing distributed, renewable-integrated energy infrastructures through modern web engineering principles.
7 Conclusions
This work presented a service-oriented web framework for real-time data flow tracing and threat propagation analysis in distributed energy systems. The framework combines lightweight message provenance, streaming lineage graph construction, and adaptive orchestration to provide both automated threat containment and actionable, low-latency visualization for operators. Experiments in a realistic, multi-protocol testbed demonstrated high tracing accuracy, rapid suppression of malicious propagation, and negligible operational disruption. Payload expansion remained below 12%, CPU cost stayed under 4%, and service availability exceeded 0.99 for critical assets even during active containment.
The results show that modern web engineering practices – microservice decomposition, event-driven streaming, and progressive web interfaces – can support robust cyber defense in heterogeneous, renewable-integrated energy networks. Unlike static topology or log-correlation approaches, the proposed system adapts dynamically to evolving data paths, uses propagation-aware indicators to trigger timely containment, and links algorithmic detection to operator decision-making through a responsive, browser-based dashboard.
Future extensions may include automated protocol adaptation, privacy-preserving metadata sharing, predictive analytics using advanced temporal and graph models, and enhanced operator decision support with explainable AI. By uniting these capabilities within a scalable web service architecture, the framework provides a path toward practical, resilient security monitoring in next-generation distributed energy infrastructures.
Funding
This work was supported by Anshun Power Supply Bureau Control Center New Energy Station Access to Power Monitoring System Network and Data Security Management Research Project (Project Number: 060400KM23120002).
References
[1] Hahn, A. Ashok, S. Sridhar, and M. Govindarasu, “Cyber-physical security testbeds: Architecture, application, and evaluation for smart grid,” IEEE Trans. Smart Grid, vol. 4, no. 2, pp. 847–855, 2013.
[2] Y. Mo, T.-H. Kim, K. Brancik, D. Dickinson, H. Lee, A. Perrig, and B. Sinopoli, “Cyber–physical security of a smart grid infrastructure,” Proc. IEEE, vol. 100, no. 1, pp. 195–209, 2012.
[3] Zhao, Lijun, Qingsheng Li, and Guanhua Ding. “An intelligent web-based energy management system for distributed energy resources integration and optimization.” Journal of Web Engineering 23.1 (2024): 165–195.
[4] S. Sridhar and M. Govindarasu, “Model-based attack detection and mitigation for automatic generation control,” IEEE Trans. Smart Grid, vol. 5, no. 2, pp. 580–591, 2014.
[5] Zhang, Yiming, Ziyang Yang, and Xinglong Liu. “A Digital Grid Security Architecture Based on Quantum Key Interaction and Web Engineering for Distributed Energy Systems.” Journal of Web Engineering (2025): 997–1022.
[6] R. Candell, T. Zimmerman, and K. Stouffer, NIST SP 800-82 Rev. 3: Guide to Industrial Control Systems Security, NIST, 2022.
[7] S. Karnouskos, “Stuxnet worm impact on industrial cyber-physical system security,” IEEE Ind. Electron. Mag., vol. 6, no. 4, pp. 18–23, 2012.
[8] IEC 62351, “Power systems management and associated information exchange – Data and communications security,” International Electrotechnical Commission, 2021.
[9] North American Electric Reliability Corporation (NERC), Critical Infrastructure Protection (CIP) Standards, 2023.
[10] Ten, G. Manimaran, and C. Liu, “Cybersecurity for critical infrastructures: Attack and defense modeling,” IEEE Trans. Syst., Man, Cybern. A, vol. 40, no. 4, pp. 853–865, 2010.
[11] A. Humayed, J. Lin, F. Li, and B. Luo, “Cyber-physical systems security – A survey,” IEEE Internet Things J., vol. 4, no. 6, pp. 1802–1831, 2017.
[12] K. Manandhar, X. Cao, F. Hu, and Y. Liu, “Detection of faults and attacks including false data injection in smart grid,” IEEE Trans. Control Netw. Syst., vol. 1, no. 4, pp. 370–379, 2014.
[13] Y. Liu, P. Ning, and M. Reiter, “False data injection attacks against state estimation in electric power grids,” ACM Trans. Inf. Syst. Secur., vol. 14, no. 1, pp. 1–33, 2011.
[14] H. Khurana, M. Hadley, N. Lu, and D. Frincke, “Smart-grid security issues,” IEEE Secur. Privacy, vol. 8, no. 1, pp. 81–85, 2010.
[15] M. Cheminod, L. Durante, and A. Valenzano, “Review of security issues in industrial networks,” IEEE Trans. Ind. Informat., vol. 9, no. 1, pp. 277–293, 2013.
[16] Ashok, Aditya, Manimaran Govindarasu, and Jianhui Wang. “Cyber-physical attack-resilient wide-area monitoring, protection, and control for the power grid.” Proceedings of the IEEE 105.7 (2017): 1389–1407.
[17] Fan, Zhong, et al. “Smart grid communications: Overview of research challenges, solutions, and standardization activities.” IEEE Communications Surveys & Tutorials 15.1 (2012): 21–38.
[18] Bhamare, Deval, et al. “Cybersecurity for industrial control systems: A survey.” computers & security 89 (2020): 101677.
[19] Rawat, Romil, et al. “SCNTA: Monitoring of network availability and activity for identification of anomalies using machine learning approaches.” International Journal of Information Technology and Web Engineering (IJITWE) 17.1 (2022): 1–19.
[20] Gedam, Madhuri N., and Bandu B. Meshram. “Proposed Secure Hypertext Model in Web Engineering.” Journal of Web Engineering 22.4 (2023): 575–596.
[21] G. Rossi, O. Pastor, D. Schwabe, and L. Olsina (eds.), Web Engineering: Modelling and Implementing Web Applications, Springer, 2008.
[22] Polillo, Roberto. “A core quality model for web applications.” Journal of Web Engineering (2012): 181–208.
[23] M. Villamizar et al., “Evaluating the monolithic and the microservice architecture pattern to deploy web applications in the cloud,” IEEE Lat. Am. Trans., vol. 14, no. 7, pp. 3439–3447, 2016.
[24] Bajaj, Deepali, et al. “A prescriptive model for migration to microservices based on SDLC artifacts.” Journal of Web Engineering 20.3 (2021): 817–852.
[25] J. Kreps et al., “Kafka: A distributed messaging system for log processing,” NetDB Workshop, 2011.
[26] K. Kleppmann, Designing Data-Intensive Applications, O’Reilly, 2017.
[27] S. Carbone et al., “Apache Flink: Stream and batch processing in a single engine,” IEEE Data Eng. Bull., vol. 38, no. 4, pp. 28–38, 2015.
[28] Patel, Archana, Narayan C. Debnath, and Prashant Kumar Shukla. “SecureOnt: a security ontology for establishing data provenance in semantic web.” Journal of Web Engineering 21.4 (2022): 1347–1370.
[29] Herschel, Melanie, Ralf Diestelkämper, and Houssem Ben Lahmar. “A survey on provenance: What for? What form? What from?” The VLDB Journal 26.6 (2017): 881–906.
[30] Gedam, Madhuri N., and Bandu B. Meshram. “Proposed Secure Hypertext Model in Web Engineering.” Journal of Web Engineering 22.4 (2023): 575–596.
[31] Roldán-Gómez, José, et al. “Security Analysis of the MQTT-SN Protocol for the Internet of Things.” Applied Sciences 12.21 (2022): 10991.
[32] Di Francesco, Paolo, Ivano Malavolta, and Patricia Lago. “Research on architecting microservices: Trends, focus, and potential for industrial adoption.” 2017 IEEE International conference on software architecture (ICSA). IEEE, 2017.
[33] Iglesias-Urkia, Markel, et al. “Analysis of CoAP implementations for industrial Internet of Things: a survey.” Journal of Ambient Intelligence and Humanized Computing 10.7 (2019): 2505–2518.
[34] Muhanji, Steffi O., Aramazd Muzhikyan, and Amro M. Farid. “Distributed control for distributed energy resources: long-term challenges and lessons learned.” IEEE Access 6 (2018): 32737–32753.
Biographies

Qing Rao was born in Danzhai, Guizhou Province in 1986. She received her bachelor’s degree in power engineering and management from Guizhou University in 2008, and obtained a master’s degree from Sichuan University in 2011. Currently, she serves as the cybersecurity officer of Anshun Power Supply Bureau. With 16 years of compound technical experience in the power field, she is a cross-disciplinary expert with dual capabilities in power system operation and maintenance as well as cybersecurity.

Yunhao Yu received her bachelor’s degree in electronic information engineering from Changsha University of Science and Technology in 2008, and her master’s degree in power electronics and electric drive from Guizhou University in 2012. Her main research areas include network security and industrial control. She has been engaged in the field of power monitoring system network security for 12 years, has published over 10 journal papers, and has led or participated in 15 provincial and ministerial-level scientific and technological projects.

Yizhou Fu was born in Tongren City, Guizhou Province in 1997. He received his bachelor’s degree from Hunan University in 2019. He is currently employed at the Power Dispatching and Control Center of Guizhou Power Grid, mainly engaged in research on network security protection. At present, six academic papers have been published.

Boda Zhang was born in Guizhou province, China, in 1995. From 2013 to 2017, he studied at University of Electronic Science and Technology of China and received his bachelor’s degree in engineering. From 2017 to 2020, he studied at University of Electronic Science and Technology of China and received his master’s degree in engineering. Currently, he works in the Power Dispatch Control Center of Guizhou Power Grid Co., Ltd and has published a total of 2 papers. His research interests cover network security of power monitoring systems and industrial control safety.

Shihong Chen was born in Anshun City, Guizhou Province in 1996. He received his bachelor’s degree from Guizhou University in 2018. Currently, he is employed by Anshun Power Supply Bureau of Guizhou Power Grid Co., Ltd., mainly engaged in the research of network security for power monitoring systems. He has published 2 academic papers.

Jianxia Wu was born in Anshun City, Guizhou Province, in 1985. She received her bachelor’s degree from Kunming University of Science and Technology. Currently, she works at Anshun Power Supply Bureau of Guizhou Power Grid Co., Ltd., primarily engaged in research on distribution network operations. She has published 5 academic papers.

Zhongkai Pan was born in Guanling County, Guizhou Province in 1982. He received his bachelor’s degree in electrical engineering and automation from Hefei University of Technology in 2009. He is currently employed at Anshun Power Supply Bureau of Guizhou Power Grid Co., Ltd., mainly engaged in dispatch and operation work. At present, two academic papers have been published.

Qing Lei was born in Guiyang City, Guizhou Province in 1986. She received her bachelor’s degree in medical information engineering from Sichuan University in 2009, and her master’s degree in electrical engineering from Sichuan University in 2014. She is currently employed at Anshun Power Supply Bureau of Guizhou Power Grid, mainly engaged in relay protection research.
Journal of Web Engineering, Vol. 25_2, 249–282
DOI: 10.13052/jwe1540-9589.2525
© 2026 River Publishers