Combination Optimization of Web Services with Credibility and QoS Attributes
Xiang Sun
Linyi Vocational University of Science and Technology, Linyi 276000, China
E-mail: SunXiang@lyvust.edu.cn
Received 21 November 2025; Accepted 02 February 2026
Abstract
To address the problem of low service quality and efficiency caused by non-functional attributes in traditional Web service composition, this paper proposes a Web service composition model construction and optimization method that integrates trustworthiness calculation and QoS attributes. First, we conduct separate objective reputation assessments and subjective trust evaluations based on user needs. Next, we perform attribute normalization and calculate subjective and objective weights according to QoS attribute classifications to establish a comprehensive weighting method. Finally, we develop a multi-attribute QoS composite service model and optimize it using the IBBS algorithm to select the optimal Web service combination. Experimental results demonstrate that both the proposed reliability calculation method and QoS attribute service selection approach can effectively compute Web service reliability and optimize candidate service selections. Compared with advanced optimization algorithms, the IBBS algorithm exhibits significantly better time efficiency and optimization outcomes. When implemented in the constructed Web service combination system, this algorithm substantially enhances service quality, better meets user requirements, and demonstrates robust effectiveness and stability.
Keywords: Web services, trustworthiness, QoS attributes, bat optimization algorithm, comprehensive weighting calculation.
1 Foreword
In today’s digital age, Web applications have transcended the limitations of single devices, serving as the core bridge connecting desktops, mobile devices, tablets, and IoT terminals. Cross-platform Web applications, with their “one-time development, multi-platform adaptation” feature, not only reduce development costs but also accelerate the democratization of technology and services through seamless user experiences. However, faced with the challenges of device performance differences, fragmented screen sizes, and fragmented operating system ecosystems, how to build truly “user-centric” cross-platform applications has become a core proposition for developers and product teams. Zhao Liang, Zhang Chi [1, 2], and colleagues proposed a framework for session-type Web service matching and judgment based on automated testing technology and SxSTS technology, achieving Web service combination optimization through intelligent algorithms. Lin Mingwei, Tan Hefei, Deng Shuzhen [3–5], and their team developed QoS estimation and prediction methods using accelerated unconstrained tensor factorization and graph convolutional neural networks, respectively. They also established an SDN management attribute reconstruction algorithm that enables QoS attribute analysis and weight calculation, providing data references for subsequent Web service selection. Tu Jun, Wen Haibiao, and Sun Xutao [6–8] proposed applying Markov chains to terminal Web service attack detection tasks, while designing a lightweight Web service in Go. Through constructing a simulation model based on model validation data, they implemented Web service credibility assessment. The analysis reveals that existing Web services suffer from excessive non-functional attributes, inconsistent service specifications, and lack of unified standards, which hinder comprehensive evaluation and best practice implementation, ultimately compromising service quality. Building on this research, we propose a comprehensive QoS evaluation framework using credibility metrics and service quality attributes. By applying the analytic hierarchy process (AHP) and variation system numbers to calculate subjective and objective QoS weight values based on user preferences, we develop a composite weighting method that integrates both subjective and objective approaches. This methodology enables the construction of service combination models and selection processes, utilizing intelligent optimization algorithms to rapidly identify optimal service combinations from candidate solutions. The resulting service portfolios better align with user requirements, thereby enhancing both service quality and efficiency. This approach holds practical value and serves as a reference for designing cross-platform Web service applications with best practices. Chen Lin and Wang Zhan [9, 10] proposed an adaptive selection model for power service offerings under QoS data uncertainty and cloud–network convergence environments, enabling future attribute validation of service combinations. Chen Dan [11] et al. developed a multi-task learning-based time-series QoS prediction model with multi-source features to facilitate cloud service user recommendations. The experiment shows that the model improves the recommendation effect of cloud service users. Liao Wei and Li Haojie [12, 13] proposed improving the performance of Web application and server by applying responsive programming to the design of highly elastic cloud service architecture, and realized performance analysis of the Web server through it.
Web service attributes can be classified into two types: functional attributes and non-functional attributes. Functional attributes refer to those that play a role in the Web service, while non-functional attributes, such as QoS (quality of service), serve as evaluation metrics for the Web service. Each Web service’s QoS parameters can assess the actual performance of the current service. Quality of service (QoS) attributes encompass diverse metrics including pricing, response time, packet loss rate, throughput, bandwidth, jitter rate, availability, and priority. Based on real-world operational environments, we recommend selecting four key attributes – pricing, response time, throughput, and availability – as evaluation criteria for assessing Web service quality, while also incorporating cross-platform Web application design principles and best practices.
In the QoS attributes of Web application services, different attribute values lack direct comparability and mutual calculation capability, and their impacts on system service quality vary significantly [14]. Based on application requirements, these attributes can be categorized into two types: positive attributes and negative attributes. Positive attributes include throughput, availability, and other metrics. The higher the value of this attribute, the better the service quality. Negative attributes include response time and service price. The lower the value of this attribute, the higher the service quality. To enable comprehensive evaluation of QoS attributes and calculation of adaptive values for composite services, we propose normalization of the aforementioned QoS attribute values. The ultimate goal of normalization is to map attributes onto a unified scale, specifically normalizing them to the [0.1] interval. The normalization formula is as follows:
| (1) |
In the formula represents the attribute value, and and represent the maximum and minimum values of the attribute value, respectively.
2 Web Service Trustworthiness Calculation
Web service systems contain multiple quality of service (QoS) attributes. The attribute related to service reliability is termed a reputation attribute, which reflects users’ subjective evaluations of the service over time. To enhance Web service quality and reliability, we propose an evaluation framework that combines user subjective feedback with objective QoS compliance metrics. This approach positions credibility and trust as key indirect indicators for assessing service reliability.
(1) Objective reputation assessment. Reputation refers to the degree to which a Web service fulfills its commitments, serving as an objective metric. Historical data for this metric is automatically collected through the QoS extension module of the UDDI system based on objective feedback records. The service maintains continuity, and historical evaluation data provides a foundation for subsequent assessments. Set the QoS attribute value for each Web service release commitment to . When the service is invoked by a service request, the QoS extension module in the system automatically retrieves the service based on its objective execution process and sets the attribute values during actual transmission to . is used as an evaluation metric for the actual service execution to assess the fulfillment of service provider commitments; a higher value indicates better fulfillment of service commitments and greater credibility. Based on the value, a predefined reputation level can be assigned to each QoS attribute:
| (2) |
After service invocation, each QoS attribute obtains a credibility rating through objective performance feedback. This reveals that, across N consecutive service instances, the credibility rating X of each attribute fulfilling its commitments follows a multinomial distribution. Historical observation records exist in the credit database. The credit management module in the system compares the feedback information of the actual execution results of the service with the initial distribution of the commitment information to obtain the feedback information of the credit rating.
Set a random variable as the credit rating for fulfilling a QoS attribute commitment across N consecutive service instances, and let denote the credibility information set for the th attribute, where represents the number of credibility levels. Based on historical statistical data, the posterior evaluation value of the random variable can be calculated as . This allows us to assess the probability of a specific QoS attribute appearing at the th credibility level. The credibility value of attribute is expressed as the probability sum of its posterior evaluation value across levels (satisfied, good, very good). Consequently, the credibility value obtained for attribute is:
| (3) |
In the formula represents the credibility score based on the attribute evaluation .
(2) Subjective trust evaluation. Trust refers to users’ assessment of Web services, serving as a subjective metric. The trust value of a service is derived from the subjective evaluations of all users who have used it. Based on historical call data, each attribute of Web service quality of service (QoS) has a user-rated value: , where the trust value for each attribute is calculated using the following formula:
| (4) |
In the formula represents the trust value of each attribute, represents the subjective evaluation value of the th QoS attribute of the th service by the th user, within the [0,1] range, indicates the number of interactions between the user and the service.
3 Development and Optimization of a Web Service Architecture Integrating Trusted Computing and Quality of Service (QoS)
3.1 QoS Attribute Classification and Normalization
Web service attributes are categorized into two types: functional and non-functional. Functional attributes are those that play a role in the Web service, while non-functional attributes, such as quality of service (QoS), serve as evaluation metrics. Each QoS parameter of a Web service can assess its actual performance. QoS attributes are diverse, and users can select corresponding attributes based on their actual living environment. According to the design principles and best practices of cross-platform Web applications, we propose selecting four attributes: price, response time, throughput, and availability, and use them as evaluation indicators for Web service quality.
In Web application services, QoS attributes exhibit distinct characteristics: their values lack direct comparability or mutual calculation capability, and their impacts on system service quality vary significantly [15]. These attributes can be categorized into positive and negative types based on application requirements. Positive attributes include throughput, availability, and other performance metrics. The higher the value of a QoS attribute, the better the service quality. Negative attributes such as response time and service price demonstrate the opposite relationship: lower values indicate higher service quality. To enable comprehensive evaluation of QoS attributes and calculate the fitness value of composite services, we propose normalization of these QoS attribute values. The ultimate goal of normalization is to map attributes to a unified scale within the [0.1] interval. The normalization formula is:
| (5) |
In the formula and represent the maximum and minimum values of the attribute, respectively [16].
3.2 QoS Attribute Weight Calculation
To visually demonstrate the significance of various QoS attributes in Web service quality, we propose a weighting calculation method for QoS attributes, which enables comprehensive evaluation of Web services. Commonly used QoS attribute weighting methods mainly include subjective and objective approaches. The subjective weighting method, characterized by strong subjectivity, primarily considers user preferences and serves as a key metric for QoS measurement. Subjective weighting methods exhibit strong subjectivity, primarily focusing on user preferences and serving as key metrics for QoS evaluation. Objective weighting approaches, however, perform data-driven analysis and computation of QoS attributes for candidate services without relying on human experience for automatic attribute weighting, demonstrating greater objectivity [17]. Yet these methods fail to account for actual user preferences. To achieve comprehensive QoS attribute weighting, we propose integrating subjective and objective weighting methods to fully consider both the objective distribution of data and real-world user preferences.
First, the analytic hierarchy process (AHP) is employed to enable users to assign importance levels to attributes based on their personal preferences. The system then conducts hierarchical analysis using these settings, converting user preferences into weights for each quality of service (QoS) attribute. After completing the transformation, consistency checks can be performed on the calculated weights to ensure compliance with requirements, thereby obtaining subjective weights. If the requirements are not met, the weights need to be recalibrated and recalculated. To eliminate subjective influences, a coefficient of variation method is proposed to determine objective weights for each QoS attribute based on data variation levels. Finally, the subjective and objective weights are combined to achieve comprehensive QoS attribute weighting.
3.2.1 Subjective weighting method
To determine the subjective weights of QoS attributes, we propose using the analytic hierarchy process (AHP) to construct a hierarchical model. This model consists of three primary layers: the objective layer, the criteria layer, and the solution layer. The QoS attributes reside at the target layer, while the criterion layer contains fundamental QoS metrics including price, response time, throughput, and availability. Service execution plans are categorized under the scheme layer [18]. To address users’ service preference requirements, the AHP method is proposed for subjective weight calculation, with the specific computational process as follows:
(1) Based on user preference levels, judgment matrices for each QoS attribute are constructed. The basic QoS attributes – price, response time, throughput, and availability – form a 4 4 fourth-order matrix.
| (6) |
In the formula: the final column vector of matrix A represents the QoS attribute weights for each column. The proposed method calculates these weights using the arithmetic mean approach.
(2) Before calculating attribute weights, matrix A should be normalized by column. The normalized column vectors are then summed and divided by 4 to obtain the attribute weights [19]. The calculated weights are: price 0.1, response time 0.13, throughput 0.23, and availability 0.54.
(3) To ensure the calculated weight values accurately reflect the preferences of various QoS attributes, a consistency check is required. This process begins with calculating the consistency index :
| (7) |
In the formula determines the order of the matrix, the parameter is set to 4, the maximum eigenvalue of matrix A is obtained. The consistency index is then calculated, yielding a value of 0.89. Using these two metrics, the consistency ratio can be determined:
| (8) |
When the value is below 0.1, the judgment matrix A is considered consistent, and the calculated single attribute weight value serves as the QoS attribute weight. If the value exceeds or equals 0.1, matrix A must be recalculated and the consistency check must be repeated until the value falls below 0.1 [20]. Based on the above calculation formula, it can be calculated that , , and are 4.015, 0.005, 0.89 and 0.0056, respectively. Through the consistency test, the calculated subjective weight value meets the set requirements.
3.2.2 Objective weighting method
The coefficient of variation (CV) is a weighting method designed to objectively assess data variability. This approach minimizes the influence of subjective factors on evaluation outcomes, enabling users to visually understand differences between QoS attributes and obtain objective weightings. For datasets containing samples and evaluation metrics, the CV method calculates data variability through the following steps:
(1) Calculate the average and standard deviation of QoS metrics displayed in the system.
(2) Calculate the coefficient of variation for each QoS attribute based on the mean and standard deviation .
| (9) |
(3) Calculate the objective weights of each QoS attribute using the coefficient of variation method:
| (10) |
In the formula represents the objective weight of each QoS attribute, represents the subjective weight value, and represent the number of users and attributes respectively [21]. Based on the formula, the objective weights for the Web service attributes – price, response time, throughput, and availability – are calculated as 0.04, 0.56, 0.29 and 0.11, respectively.
3.2.3 Comprehensive weighting method
The exclusive use of either subjective or objective weighting methods may lead to arbitrary subjectivity and excessive objectivity, failing to accurately capture intrinsic relationships between data points and resulting in unreasonable weight assignments. To address this, we propose a hybrid approach that integrates subjective and objective weighting calculations to determine final QoS attribute weights. This method simultaneously considers user preferences and objective data variations, thereby enhancing the scientific validity and rationality of weight settings. The comprehensive weighting calculation formula is:
| (11) |
In the formula represents the comprehensive weight, and denote the subjective and objective weights, represents the deviation factor balancing subjective and objective weights, with . When , the subjective weight is considered dominant; when , the objective weight takes a larger value [22]. Therefore, to make the determined attribute weights more reasonable, it is proposed to take the value of as 0.5. Based on the above comprehensive weighting method, the weights of price, response time, throughput and availability attributes can be calculated as 0.07, 0.345, 0.26 and 0.325, respectively.
3.3 Web Service Composition Modeling
To meet the design principles and best practices of cross-platform Web applications and improve the quality of Web service combinations and task execution, the comprehensive weight and credibility are used as the criteria for service selection. The specific combination process is as follows:
(1) Based on the QoS attribute weight and credibility of Web services, a complete task is decomposed into multiple indivisible subtasks, each of which can be executed by a single Web service. The specific expression is:
| (12) |
In the formula represents the number of subtasks and is the th subtask.
(2) The filter subservice identifies candidate Web services and composite services in the system that match the functions of the subtasks, and then combines them into a set of candidate services.
| (13) |
In the formula represents the number of candidate services and is the th candidate service of where .
(3) Based on the corresponding QoS constraints, a candidate service is selected from the candidate service set of the subtask to generate the optimal service combination [23].
3.4 QoS Metric Calculation and Web Service Selection
Based on the determined QoS attribute reliability evaluation values and QoS attribute weights, we propose a method to integrate credibility into QoS measurement calculations. The specific formula is as follows:
| (14) |
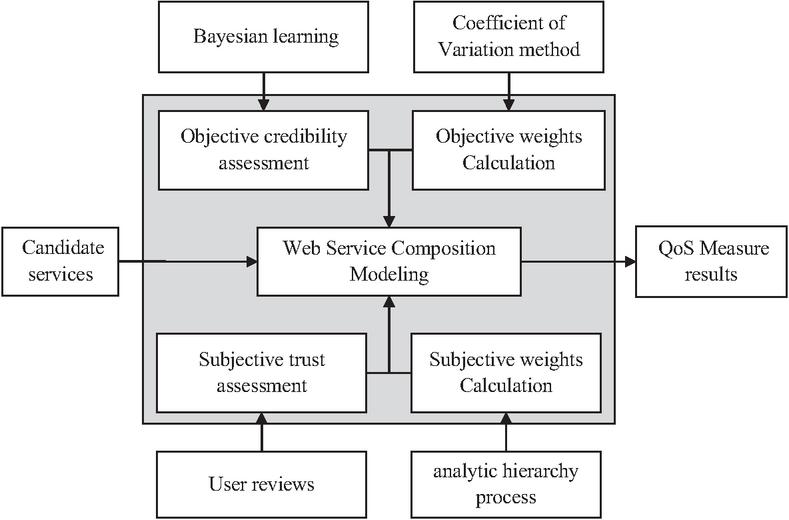
Figure 1 QoS measurement framework.
In the formula represents the attribute value incorporating credibility and represents the objective weight of each QoS attribute integrated with credibility. This measurement method enables effective selection of Web services, thereby improving service quality and credibility while fully considering users’ preferences for each attribute. The specific architecture of this measurement method is shown in Figure 1.
The QoS measurement method calculates the utility value of each candidate service, enabling their ranking and filtering. This process identifies high-utility Web services for inclusion in the global optimization portfolio. Such an approach reduces the size of service combinations, enhances optimization efficiency, and prevents resource waste [24].
3.5 Web Service Combination Optimization Based on an Improved Binary Bat Algorithm
3.5.1 Improve the binary bat algorithm
The multi-objective function of QoS-based Web service composition is to minimize the cost and response time and maximize the throughput and availability. Therefore, the Web service suite adopted multi-objective optimization methods include genetic algorithms, particle swarm optimization, and the bat algorithm. These algorithms demonstrate strong performance in both robustness and computational efficiency. Among them, the bat algorithm (BA), the latest heuristic optimization technique, is selected as the Web service combination optimization method to achieve a Web service combination that satisfies four QoS attribute optimization objectives within the multi-objective optimization framework.
The bat algorithm (BA) is an intelligent optimization algorithm that evolved from the hunting behavior of bats. When searching for prey, bats emit ultrasonic signals and adjust their flight direction and speed based on the feedback received. The BA algorithm treats the optimization problem as minimizing a target function, with the solution process resembling a swarm of bats searching for the optimal solution [25]. Each bat possesses unique individual attributes including position, velocity, frequency, and pulse rate. The position represents the solution. During each iteration, bats adjust their positions and velocities based on the objective function value and information from neighboring bats, effectively simulating behaviors such as emitting ultrasonic signals, searching, and gradually converging. Within the discrete binary search space, bats employ a V-shaped transfer function to update their positions, with the specific expression of the transfer function being:
| (15) | |
| (18) |
In the formula and represent the position and velocity of the th bat on the th dimension at iteration , and denote the position and velocity of the th bat on the th dimension at iteration , and indicate the current position and flight velocity of the bat, and denote the iteration count and the type transfer function, is the binary complement of , and and represent the inverse of the tangent function and a random number, respectively. The BA algorithm has gained widespread attention in multi-objective optimization due to its advantages such as fewer parameters and ease of implementation. The binary bat algorithm (BBA) demonstrates better performance in handling discrete problems, but it is prone to getting trapped in local optima, resulting in poor solution accuracy. Based on this, we propose an optimized version of the binary bat algorithm. The specific improvement involves adding an inertia weight to the velocity formula, which effectively balances global and local search capabilities. Additionally, a mutation operator is introduced to enhance the algorithm’s global search performance.
(1) Increase inertia weight. The BBA algorithm is prone to getting trapped in local optima during later search phases. To address this, we propose incorporating an inertia weight into the velocity update formula. Inspired by the particle swarm optimization mechanism, we introduce a nonlinear decreasing inertia weight to enable adaptive optimization. The specific formula is:
| (19) |
In the formula represents the nonlinear decreasing inertial weight, where and are the maximum and minimum values of , respectively, set to 0.9 and 0.4, and and denote the iteration count and maximum iteration count [26]. Based on the above formula, the speed weight of the BBA algorithm can be continuously adjusted with iteration count, thereby expanding the search range of bat individuals in the BBA algorithm and improving its global search performance.
(2) Introduce mutation operator. Mutation operators can randomly modify individuals within the current population under specific rules to achieve better solutions. These operators enhance the algorithm’s global search capability, making it more effective in finding optimal solutions. By integrating the mutation principle of genetic algorithms, we propose incorporating mutation operators into the BBA algorithm’s speed formula. This optimization yields the updated speed update formula as follows:
| (20) |
In the formula is the optimized update speed; represent the bat’s current flight speed and position, respectively, represents the variational operator, indicates the current search direction of the bat individual, and are adaptive learning factors, represents the nonlinear adjustment index, is the initial influence factor of , and are set to 0.6 and 2 respectively. The introduction of mutation operators in the BBA algorithm enables random mutation operations, allowing the current population to rapidly escape local optima and accelerate convergence [27]. Simultaneously, it randomly alters the search directions of individuals within the population, thereby expanding the search space and enhancing the algorithm’s performance in global search.
3.5.2 A hybrid optimization approach based on an improved binary bat algorithm
After improving the BBA (IBBA) based on the above methods, the algorithm is applied to the Web composite service optimization task, and the solution process is shown in Figure 2.
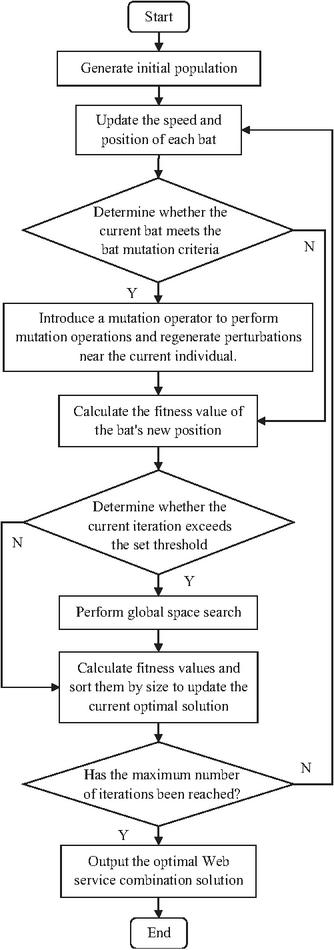
Figure 2 Solving the IBBA’s Web-based composite service.
The implementation process of the IBBA in Web composite service tasks is as follows:
(1) The Web service combination determines the QoS attribute optimization objectives and initializes parameters such as bat quantity, maximum iteration count, and frequency range.
(2) Determine the initial position of the bat population and record the current global optimal solution.
(3) The BBA with enhanced inertia weight is employed for updating bat speed and position.
(4) Verify whether the BBA satisfies the mutation criteria; if so, the mutation operator is applied to update the bat’s position, followed by re-generating perturbations around the current bat individual [28, 29].
(5) A new local solution is generated based on the update formula of each local solution in the current population and then converted into binary by Equation (15).
(6) Calculate the fitness value and sort it by size. Select the current maximum fitness value to replace the current optimal solution and update the current global optimal solution.
(7) Repeat steps (3) to (7) until the algorithm reaches the maximum number of iterations, and the optimal solution can be output, so as to obtain the optimal Web combination service.
4 Experimental Results
4.1 Experimental Environment
To validate the proposed Web service combination optimization method that integrates the credibility calculation and the QoS, the experiment is divided into three phases: first, verifying the effectiveness of the credibility evaluation method; second, analyzing the performance of the proposed service selection method; and finally, comparing the performance of the multi-objective optimization model for the global combination stage. The experiment employed a 64-bit Windows10 operating system as the software environment, with a 16GB RAM-equipped 13th Gen Intel® CoreTM i9-13900HX@2.20GHz processor as the hardware component, and Pychar2020.1.3+python3.9 as the experimental tool.
4.2 Experimental Data
The experimental data was sourced from the QWS dataset, which was collected from service websites, UDDI registries, and search engines. This dataset contains 2600 authentic Web service records, each with 10 QoS attributes. The experiment focused on four core metrics: price, response time, throughput, and availability. The price attribute ranges from 0 to 2000$ and the response time ranges from 0 to 400 ms. The availability and throughput ranges are 0 to 100% and 100 to 1000 bps, respectively.
4.3 Reliability Evaluation and Verification
To validate the proposed Web service trustworthiness evaluation method, we conducted performance analysis on the objective credibility assessment approach. Since real-world service invocation data from enterprises is unavailable, we generated four sets of simulated data to replicate actual QoS attribute interactions. These simulated datasets were labeled as A, B, C, and D, with their distribution patterns illustrated in Figure 3.
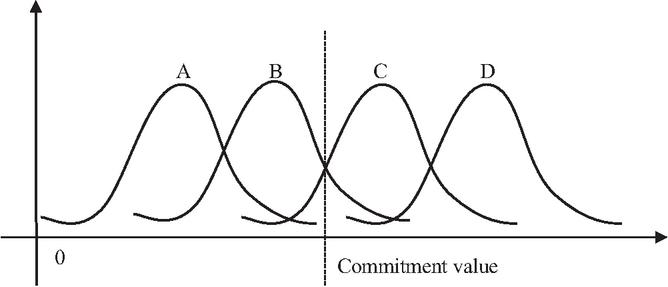
Figure 3 Simulated data distribution.
The four sets of generated data simulate the numerical values of Web service QoS attributes during actual calls, which are recorded as historical data. Bayesian learning is then applied to objectively evaluate the attributes’ credibility. Finally, the QoS attributes are categorized into cost-oriented and benefit-oriented types. Using these four data sets for credibility assessment validation, the test results are shown in Figure 4.
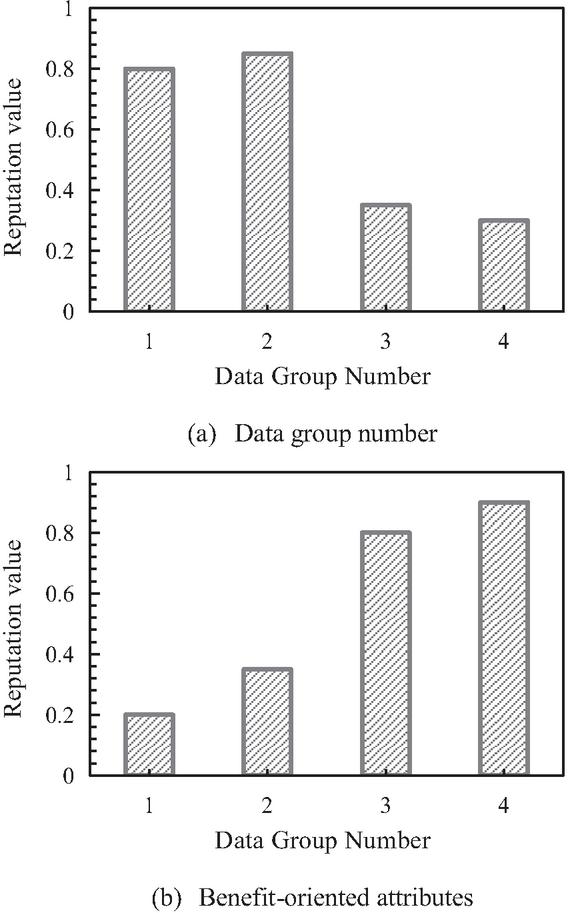
Figure 4 Objective credit evaluation results.
The analysis of the above figure shows that among cost-related attributes, the credibility scores of data groups A and B are relatively high, while those of groups C and D are lower. This indicates that the credibility evaluation values of groups A and B are distributed to the left of the commitment value, suggesting a higher creditworthiness in fulfilling commitments during actual service invocation. In the benefit attribute, the two groups of data A and B are lower than the promised value, that is, the degree of completion of the promise of this attribute in the actual service call is low, and the last two groups of data basically complete the promise or higher than the promised value, so as to obtain a higher credit evaluation value. Comprehensive analysis proves that the proposed objective reputation evaluation method can intuitively reflect the authenticity of each attribute in the actual service invocation and completion commitment and has a high degree of objective correctness. Through this evaluation method, the one-sidedness of the user subjective evaluation can be effectively avoided, and the accuracy of Web service credibility evaluation can be improved.
4.4 Validation of a QoS-based Web Service Selection Method
To evaluate the performance of the proposed QoS-based Web service selection method, we conducted Web service selection based on credibility and user-based evaluation methods. The precision, recall, and F1 score are used as the evaluation metric, with the specific formula being:
| (21) |
In the formula precision indicates the accuracy rate, represents the number of times the benchmark service is included in the service selection results, and represents the total number of service selections [30]. and are precision and recall, respectively; F1 value is a comprehensive metric for precision and recall. The larger the F1 value, the better the performance of the service selection method. Based on the established evaluation metrics, the experiment simulated the QWS dataset and MSR-Bing dataset as abstract service classes, generating 100 randomly assigned user requirements. During service selection, the TOP-2%, TOP-4%, TOP-6%, TOP-8%, and TOP-10% candidate services were selected. Three distinct service selection methods were applied to these candidates, and the test results are shown in Table 1.
Table 1 Comparison of three web service selection methods
| Candidate | Precision | Precision | Recall | F1 Value | |
| Method | Service | Ratio (%) | (%) | (%) | (%) |
| Web service | TOP-2% | 29.58 | 46.62 | 50.04 | 47.17 |
| selection based | TOP-4% | 35.67 | 59.37 | 63.36 | 62.58 |
| on credibility | TOP-6% | 60.32 | 62.05 | 69.57 | 65.06 |
| TOP-8% | 81.04 | 73.89 | 72.28 | 72.25 | |
| TOP-10% | 86.21 | 77.41 | 77.96 | 77.71 | |
| User evaluation | TOP-2% | 33.17 | 53.63 | 60.44 | 58.39 |
| based method | TOP-4% | 43.26 | 62.28 | 68.59 | 65.57 |
| TOP-6% | 68.53 | 71.44 | 73.68 | 72.32 | |
| TOP-8% | 66.89 | 79.56 | 79.51 | 79.34 | |
| TOP-10% | 79.34 | 83.97 | 82.06 | 82.58 | |
| A QoS-based | TOP-2% | 89.62 | 83.32 | 90.54 | 86.67 |
| web service | TOP-4% | 90.17 | 91.45 | 92.87 | 92.06 |
| selection method | TOP-6% | 92.58 | 93.78 | 94.26 | 94.15 |
| TOP-8% | 96.64 | 96.02 | 97.33 | 96.88 | |
| TOP-10% | 93.05 | 99.51 | 98.04 | 98.76 |
As shown in Table 1, this method demonstrates significantly higher precision and F1 score compared to the other two Web service selection approaches. Figure 5 presents the precision comparison results of these three methods.
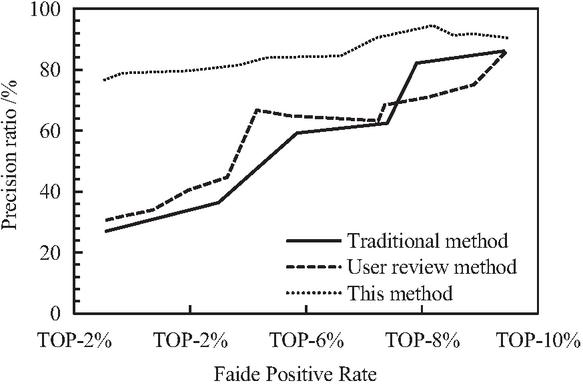
Figure 5 Comparison results of three methods on the QWS dataset.
As can be seen from the above analysis, with the increase in the number of selected services, the precision rate of the three selection methods is improved, but the precision rate of this method is higher than the other two methods. The analysis demonstrates that this method enables effective selection of Web services, ensuring both user QoS requirements and high reliability. Notably, the TOP-10% candidate services selected by this method achieve the highest precision rate. Therefore, we propose recommending the top 10% candidate services to users.
4.5 IBBA Algorithm Simulation Verification
4.5.1 Convergence verification
To evaluate the convergence performance of the IBBA algorithm, we conducted ablation experiments using both the original BA algorithm and the BBA algorithm. The maximum iteration number of the three algorithms is set to 300, the number of bats is 50, the speed and loudness are set to 0.5 and 0.25 respectively, the maximum and minimum flight frequency are 2 and 0 respectively, and the minimum and maximum value of nonlinear inertial weight are 0.4 and 0.9 respectively. Based on the above parameter settings, the experiment calculated the fitness function of the three algorithms respectively, and the convergence curves of the three algorithms were plotted as shown in Figure 6.
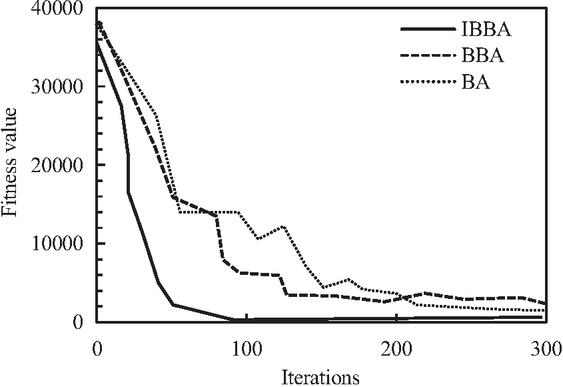
Figure 6 Variation curves of the fitness values of the three algorithms.
Figure 6 shows that the IBBA achieves rapid convergence at 57 iterations under identical conditions, stabilizing its fitness value at approximately 2760, significantly outperforming both BBA and BA. This demonstrates IBBA’s superior convergence speed and enhanced optimization performance.
4.5.2 Optimize performance verification
To further validate the proposed IBBA algorithm’s effectiveness in global optimization of Web service combinations, the experiment employed the Sphere test function as the benchmark and also used the widely used genetic algorithm (GA), the cuckoo optimization algorithm (CS), and the ant colony optimization algorithm (ACO) as contrast algorithms. The proposed algorithm is tested on a Python platform by using several optimization algorithms, and the results show that the proposed algorithm is effective in the global optimization of Web service combination. The genetic algorithm was configured with crossover probability 0.75 and mutation probability 0.28. The cuckoo optimization algorithm utilized discovery probability 0.6, while the ant colony optimization algorithm set pheromone activation rate at 0.9 with 30 ants. All algorithms were initialized with a mid-iteration scale of 100. Each experimental group underwent 40 repeated executions, with the average value selected as the final comparison result. The QWS dataset was fed into four algorithms, using response time and average normalized error as evaluation metrics for time efficiency and optimization effectiveness. The performance comparison results of the four algorithms are shown in Figure 7.
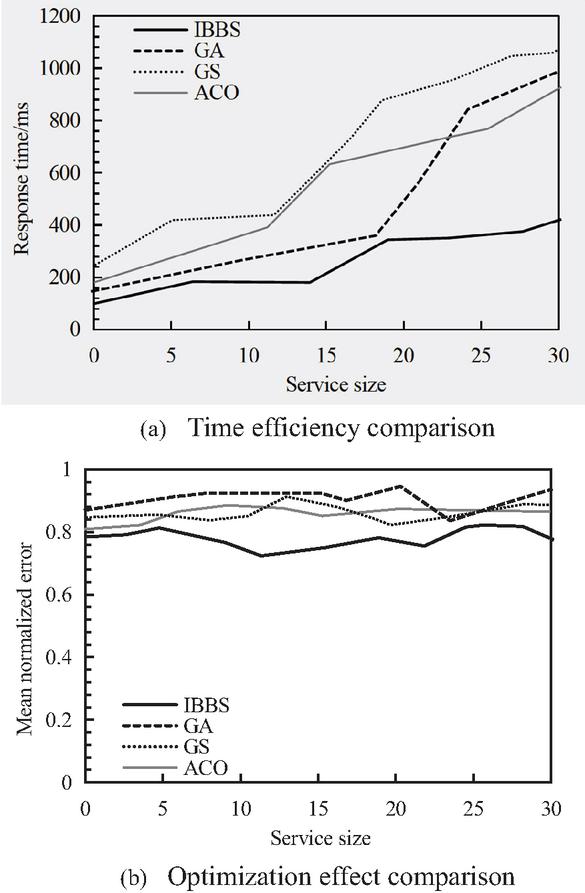
Figure 7 Comparison of performance of different algorithms.
As shown in the Figure 7, under the same service scale, the response time of the proposed IBBS algorithm is significantly lower than the other three algorithms. With the increase in the service combination scale, the response time of each algorithm increases, but the response time of the proposed algorithm remains below 400 ms, which is significantly better than the other algorithms. This demonstrates that the algorithm meets real-time service composition requirements with high processing efficiency. In optimization results, its average normalized error is lower than the other algorithms. The algorithm proves effective in solving global optimization problems for Web service composition, demonstrating superior performance.
4.6 Service Portfolio System Design and Implementation
4.6.1 System construction
To achieve comprehensive analysis and best practices for Web service composition, we propose a B/S architecture-based Web service composition system. The system hardware features a server with a 13th Gen Intel® CoreTM i9-13900HX @2.20 GHz processor, 16GB RAM, and an NVIDIA GeForce RTX 4060 GPU with 16GB VRAM. The software development was conducted on a local computer with a 64-bit Windows 11 operating system. The integrated development environment and programming language were PyCharm2020.1 and Python 3.9, respectively. The overall system architecture is shown in Figure 8.
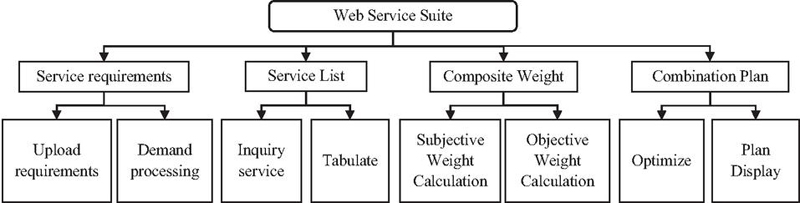
Figure 8 System architecture.
The system consists of four core modules: service requirements, service catalog, comprehensive weighting, and solution integration. The service requirements module handles two key functions: upload processing and requirement management. The service catalog provides query and display capabilities, while the comprehensive weighting module calculates subjective and objective metrics. The solution integration module features algorithm optimization and solution visualization. After logging in with credentials, users can access the service requirement module to upload and process their needs. The system then queries and displays relevant service processes. Upon submitting preference data, the system verifies consistency and calculates comprehensive weights. Finally, using the IBBS algorithm, it optimizes Web service combinations and presents the best solution through the interface.
4.6.2 System function and performance testing
To verify whether the system’s functionality and performance meet the design requirements, the experiment applied the proposed comprehensive weighting calculation method and IBBS algorithm to the system’s comprehensive weighting and combination scheme modules. The resulting system functionality and performance test results are shown in Tables 2 and 3.
Table 2 System function test results
| Functional Module | Test Steps | Expected Result | Test Result |
| Service request module | After logging in with a username and password, users can access this module to upload requirements. | The user completes the requirement upload, and the system preprocesses the requirement information based on the user’s requirements. | Test pass |
| Service list | The system queries services and displays lists based on user needs and preferences | Complete service queries and list displays | Test pass |
| Composite weight | The system employs the analytic hierarchy process (AHP) and coefficient of variation method to calculate subjective and objective weights and then performs comprehensive weight calculation. | Complete the calculation of subjective and objective weights and comprehensive weight analysis | Test pass |
| Combination plan module | The IBBS algorithm is employed to optimize and solve Web-based composite services, enabling the presentation of integrated solutions. | Complete the solution for portfolio service optimization and solution presentation | Test pass |
Table 3 System performance test results
| Test Item | Test Result |
| Response time | 400 ms |
| Throughput capacity | 100 bps |
| Serviceability | Strong |
| Resource utilization rate | High |
| Concurrent users | 100 |
The analysis of the above table shows that the system has complete functional modules, and the system can realize the combination optimization and visual display of Web services. The system performance meets the design principles and best practices requirements of cross-platform Web applications and is feasible and effective.
5 Conclusion
In conclusion, the proposed Web service selection and optimization method based on service credibility and QoS attributes demonstrates both feasibility and effectiveness. This approach effectively integrates credibility and QoS attributes while providing a QoS attribute weighting calculation method, offering a solid theoretical foundation and technical support for service selection during the local optimization phase. By ranking candidate services based on trusted QoS metrics, the system identified globally optimized solutions that satisfy users’ QoS requirements while maintaining high reliability. Experimental results demonstrate that the IBBS algorithm effectively resolves the global optimization challenge for Web service composition, yielding the optimal final solution. Compared with advanced optimization algorithms, this algorithm demonstrates superior optimization efficiency and effectiveness, validating its practicality and advantages. In real-world applications, it successfully implements optimal practices for Web service systems, enhancing the performance of Web service combination optimization. This system enables users to customize functionalities according to their specific needs, significantly improving work efficiency and operational convenience.
References
[1] Zhao Liang, Wang Bin, Zhang Lingning. Research on Web Service Optimization Using Automated Testing Technology [J]. Automation Applications, 2025, 66(14): 256–259.
[2] Zhang Chi, Kim Yong-ki. A framework for matching conversation types in Web services based on SxSTS [J]. Computer Applications and Software, 2025, 42(8): 12–19.
[3] Lin Mingwei, Li Wenqiang, Xu Xiuqin, et al. Web Service Quality of Service (QoS) Estimation Using Accelerated Unconstrained Tensor Decomposition [J]. Journal of Communications, 2024, 45(3): 166–181.
[4] Tan Hefei, Zong Rong, Wu Hao, et al. Graph Convolutional-Based Multi-task Web Service Quality of Service Prediction [J]. Computer Engineering and Design, 2024, 45(01): 47–54.
[5] Deng Shuzhen, Liu Decong, Chen Xiaozhu. Design of SDN Control Attribute Reconfiguration Algorithm [J]. Journal of Anhui Electronic Information Vocational and Technical College, 2025, 24(2): 59–63.
[6] Tu Jun, Xie Fei. Research on Markov Chain-Based Detection Technology for Terminal Web Service Attacks [J]. Microcomputer Applications, 2025, 41(6): 26–29.
[7] Wen Haibiao. Design and Implementation of Lightweight Web Services in Go Language [J]. Computer Knowledge and Technology, 2025, 21(16): 45–47.
[8] Sun Xutao, Guo Xiaowei, Wang Zhijia. A Method for Calculating the Credibility of Simulation Models Based on Model Validation Data [J]. Computer Simulation, 2022, 39(12): 73–76.
[9] Chen Lin, Zhao Dong, Yin Jianbing, Wang Mingchang, et al. Adaptive Selection Model for Power Business Services under QoS Data Uncertainty [J]. Electronic Design Engineering, 2024, 32(13): 131–134+139.
[10] Wang Zhan, Zhang Pengcheng, Jin Huiying, et al. Future attribute verification of service combinations in cloud-network convergence environment [J]. Computer Engineering, 2025, 51(3): 310–319.
[11] Chen Dandan, Wang Junfeng, Li Xiaohui, et al. Time-series QoS prediction in cloud service recommendation based on multi-source features and multi-task learning [J]. Journal of Sichuan University (Natural Sciences Edition), 2024, 61(4): 140–150.
[12] Liao Wei, Zhang Yong. Design of Elastic Cloud Service Architecture for High-Performance Web Applications [J]. Electronic Technology, 2025, 54(04): 160–161.
[13] Li Haojie, Guo Xu. Performance Analysis of Responsive Programming on Web Servers [J]. Journal of Shanghai Dianji University, 2025, 28(1): 58–62.
[14] Mecheri K, Klai S, Souici-Meslati L. Deep learning based web service recommendation methods: A survey[J]. Journal of Intelligent & Fuzzy Systems, 2023, 44(6): 9879–9899.
[15] Baun C, Bouché J. Closing the gap between web applications and desktop applications by designing a novel desktop-as-a-service (DaaS) with seamless support for desktop applications[J]. Open Journal of Cloud Computing (OJCC), 2023, 8(1): 1–19.
[16] Purohit L, Rathore S S, Kumar S. A QoS-aware clustering based multi-layer model for web service selection[J]. IEEE Transactions on Services Computing, 2023, 16(5): 3141–3154.
[17] Sivanandam C, Perumal V M, Mohan J. A novel light GBM-optimized long short-term memory for enhancing quality and security in web service recommendation system[J]. The Journal of Supercomputing, 2024, 80(2): 2428–2460.
[18] Swathi V, Kumar G S, Vathsala A V. Cloud service selection system approach based on QoS model: A systematic review[J]. International journal on recent and innovation trends in computing and communication, 2023, 11(2): 05–13.
[19] Khelil H, Brahimi M. Toward an efficient web service composition based on an improved BTLBO algorithm[J]. The Journal of Supercomputing, 2024, 80(7): 8592–8613.
[20] Pandharbale P B, Mohanty S N, Jagadev A K. QoS-aware web services recommendations using dynamic clustering algorithms[J]. International Journal of Information System Modeling and Design (IJISMD), 2022, 13(6): 1–16.
[21] Muslim H S M, Rubab S, Khan M M, et al. S-RAP: relevance-aware QoS prediction in web-services and user contexts[J]. Knowledge and Information Systems, 2022, 64(7): 1997–2022.
[22] Solomon N. Ogili, G. N. Onoh. Performance Evaluation Of Quality Of Service Of A 4g Network In A Tropical Environment[J]. International Journal of Computer (IJC), 2023, 47(1): 21–35.
[23] Hanabaratti K D, Rodd S F. Evolutionary Computing based Web Service Composition Technique for Scheduling of Workload under Cloud Environment[J]. Indian Journal of Science and Technology, 2022, 15(2): 69–80.
[24] Guo Yimin, Zheng Guangliang. Technical Governance Challenges and Reflections in Web Service Applications for Government Service Platforms [J]. Journal of Liaoning Technical University (Social Sciences Edition), 2025, 27(1): 32–36.
[25] Hasnain M, Ghani I, Pasha M F, et al. Machine learning methods for trust-based selection of web services[J]. KSII Transactions on Internet and Information Systems (TIIS), 2022, 16(1): 38–59.
[26] Esfandiari A, Farivar F, Khaloozadeh H. Fractional-order binary bat algorithm for feature selection on high-dimensional microarray data[J]. Journal of Ambient Intelligence and Humanized Computing, 2023, 14(6): 7453–7467.
[27] Liangzhao Zeng, Boualem Benatallah, Marlon Dumas, Jayant Kalagnanam, Anne H H Ngu. QoS-Aware Service Composition: A Retrospective[J]. IEEE Transactions on Software Engineering, 2025, 51(3): 836–841.
[28] Salkuti S R. Binary bat algorithm for optimal operation of radial distribution networks[J]. International Journal on Electrical Engineering and Informatics, 2022, 14(1): 148–160.
[29] Mouwafi M T, Abou El-Ela A A, El-Sehiemy R A, et al. Techno-economic based static and dynamic transmission network expansion planning using improved binary bat algorithm[J]. Alexandria Engineering Journal, 2022, 61(2): 1383–1401.
[30] Zhang Zhipeng, Zhou Jingquan. Web service composition optimization method based on improved bee colony algorithm [J]. Computer Technology and Development, 2024, 34(3): 64–69.
Biography

Sun Xiang was born in Shandong, China, in January 1983. He studied at Beijing Jiaotong University and received his master’s degree in 2008. He currently serves as a lecturer at Linyi Vocational University of Science and Technology. His primary research interests include information technology planning and construction, software architecture design, and software development and testing.
Journal of Web Engineering, Vol. 25_5, 737–764
doi: 10.13052/jwe1540-9589.2551
© 2026 River Publishers