Applying Feature-Oriented Software Development in SaaS Systems: Real Experience, Measurements, and Findings
Oscar Pedreira1, Fernando Silva-Coira1,
Ángeles Saavedra Places1, Miguel R. Luaces1, and Leticia González Folgueira2
1 Universidade da Coruña, Centro de Investigación CITIC, Facultade de Informática, A Coruña, Spain
2 Enxenio S.L., A Coruña, Spain
E-mail: oscar.pedreira@udc.es; fernando.silva@udc.es; asplaces@udc.es; luaces@udc.es; lgonzalez@enxenio.es
Received 14 January 2019;
Accepted 06 June 2019
Abstract
Distributing software as a service (SaaS) has become a major trend for web-based systems. However, this software distribution model poses many challenges. One of them is feature variability, that is, some features of the system may be required by some users, but not by all of them. In addition, variability is more complex than just including or excluding a feature, since different types of relationships may exist between features. The implementation of this variability, and the parametrization and configuration of the system can be complex in this context, so the development process of a SaaS system must adequately address variability management. In this paper we present an experience applying feature oriented software development (FOSD) in the context of SaaS web-based systems development. We present a real experience in the development of a web-based system for managing home care services for dependent people. The article describes the problem of variability management in this domain, and the feature model of the system. Finally, we present an empirical evaluation of the feature model of the system based on data obtained from its real deployment after two years of use. The empirical evaluation was based on state-of-the-art measures for variability management, and revealed relevant insights for software development in this context.
Keywords: feature oriented software development, feature oriented domain analysis, variability management, software as a service, feature model metrics.
1 Introduction
Delivering software as a service (SaaS) [24] has become a major trend in the last years. Instead of having an individual deployment of the system for each customer, in the SaaS model the system is deployed once, and provides service for many customers that share the same software and hardware resources. This software distribution model allows the customers to forget about aspects such as complex software deployments, maintenance, security, and acquiring and maintaining a hardware and network infrastructure for their information systems. This model may also have advantages for the developer companies, such as a greater control on the software evolution, licensing schemes that could be more flexible and attractive for customers, and a more effective way of commercializing the software. However, this approach also presents important challenges for the developer companies. For example, the provider has to manage the infrastructure needed for the service, including premises, hardware, network, and information security. The SaaS model also presents challenges related to the development of the software.
One of the challenges of developing SaaS systems is managing variability. Typically most customers share a large set of features, but they need to customize the software to their needs in some way.
Typical customizations include adding or removing functionalities, or parametrizing the software so its behavior changes to adapt to a particular customer need. This configuration and parametrization possibilities introduce a certain degree of variability in the system, that depend on the number of features and how they relate to each other. This usually results in a complex parametrization of the software, that must be handled carefully. An adequate approach for dealing with variability analysis and modeling in SaaS systems is feature-oriented software development.
Feature-oriented software development (FOSD) considers variability modelling and management as one of the central aspects of software development [2, 3, 5, 14]. A feature can be defined as a unit of functionality that satisfies a specific requirement. FOSD assumes that some features may be selected by some users in a specific configuration of the system, but not in all of them, depending on the needs of the users/customers. In addition, features cannot be managed just as a plain list of elements of the system, since different types of relationships and constraints can be defined between them. The features of the system and the relationships between them can be represented in a feature model. The feature model of a system defines a software product line (SPL), that is, a family of products that share a set of core assets (components), but that may differ in the features they include.
The application of FOSD techniques to the development of SaaS systems has already been considered in previous research. For example, [19] presented a proposal for the development of SaaS systems applying SPL engineering techniques, where the application architecture is designed as a composition of services, and where each service implements a specific set of features. [16] proposed the use of variablility modelling based on metagraph for SaaS systems configuration and customization. [18] considered an scenario in which the system is deployed independently for each customer, and they proposed to use variability models to systematically derive customization and deployment information for each individual customer.
In this paper, we present a real experience in applying variability management techniques in the development of a web-based SaaS system, more specifically, a software for managing home care services for people with special physical or psychological conditions. We briefly describe the domain, and we present the complete feature model of the system, that allowed us to successfully introduce variability and customization in the development process. In addition, we present an empirical evaluation of the variability of the system with data obtained after two years of system use in the real deployment. In this empirical evaluation we analyzed data from system configurations for more than 100 customers and thousands of users, based on state-of-the-art metrics. The results of the empirical evaluation revealed interesting findings regarding the use of the features in the real deployment, which raise important considerations in the development of systems with variability.
The rest of the paper is organized as follows. Section 2 reviews background and related work. Section 3 describes some aspects of the Home Care Service management and describes the feature model of the system. Section 4 presents an empirical analysis of the real deployment of the system and how the different features are being used. Finally, Section 5 presents the conclusions, and lines for future work.
2 Background and Related Work
2.1 Feature Oriented Software Development
Most large software systems have a degree of variability that allows to customize them in many ways to the needs of different customers and users. ERPs are the paradigmatic example of this scenario, since their parametrization usually considers hundreds of parameters and plays a central role in the deployment and adoption of the system. Research in software engineering has developed different strategies and techniques for developing high quality systems where a significant degree of variability is present.
Feature-oriented software development (FOSD) takes this scenario as the context for the development of a system [3, 5]. A feature is defined in [3] as “a unit of functionality of a software system that satisfies a requirement, represents a design decision, and provides a potential configuration option”. Some customers may need a feature, while others may not. Features are a way of modelling the variability of a software system, since they may be present only in the deployments for the customers that need them. The goal of FOSD is to design and develop a system that can be easily tailored to the needs of specific customers/users with low effort, while maintaining high quality levels.
A feature model [15] represents the features of the system and the relationships between them. Feature models can be graphically represented in feature diagrams, following the notation proposed by [11]. Features can be abstract or concrete. Some features may be mandatory while others may be optional. For a given feature, there may be many options to implement it (and they do not necessarily need to be exclusive). Finally, there is the possibility of using include/exclude relationships between features. [12] introduced an extension of the notation used in feature diagrams that considers the concept of cardinality, as the number of times a feature can be repeated in a product.
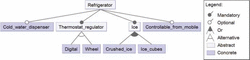
Figure 1 shows an example of a feature model. The root of the tree represents the system that is modelled, in this example, a refrig-erator. At a first sight we can distinguish between concrete features, such as Cold water dispenser and Controllable from mobile, and abstract features, such as Ice_and_Thermostat regulator. An abstract feature may group a set of related, lower-level, features. In some cases, the children of an abstract feature may represent alternative ways of implementing the parent. For example, in the case of Ice, it has two children features, Crushed ice and Ice cubes, that represent two ways of having ice in the refrigerator. The notation used to represent the relationship between Ice and its children means that there is an Or relationship between Crushed ice and Ice cubes. That is, we can have refrigerators dispensing only Ice cubes, refrigerators dispensing only Crushed ice, and refrigerators dispensing both types of ice. Our model also represents that the refrigerator can have a Thermostat regulator, that can be Digital or an analogic Wheel. The relationship between Digital and Wheel with its parent feature, Thermostat regulator, means that they are alternative.
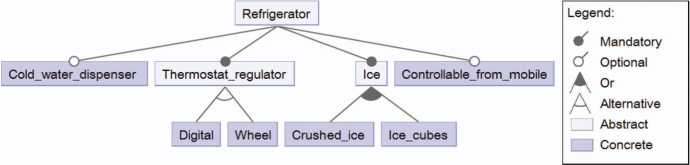
Figure 1 Example of a feature model.
The variability of the features defines a product family, that is, the set of all the products that could be obtained from the set of all valid feature specification combinations.
Feature analysis is the base for software product lines (SPL), that is, a platform for automatically generating different versions of a product family from a specification of the features that have to be present in the final system. A software product line is a family of related software systems that share a common set of assets, but differ in that some features are present in some products, while they are not in others [2, 10, 22]. Developing each of these systems separately would be too costly. A software product line considers developing a platform that contains all the possible features identified in the analysis, to generate final products from a given feature specification. Instead of constructing related but different systems in different ways, SPLs allow us to build a platform for automatically generating all those products, therefore reducing the development efforts and quality issues. However, FOSD is not only applied in the context of software product lines. For example, [23] connected the concepts of FOSD and model driven development (MDD).
FOSD has been previously applied to some aspects of the development of SaaS systems, such as the system architecture [19], the variability modelling [16], and the automatic generation of the configuration of individual deployments for specific customers [18].
2.2 Measures for Software Product Lines and Variability Management
Measuring feature models has been an active line of work within this research area. [26] presents a comprehensive set of measures and metrics for SPLs. Many of them depend directly on the feature model and, therefore, could be applied to any system developed under this paradigm. [20] presents a systematic review of quality attributes and measures for SPLs. In this systematic review, the authors identified 165 quality measures proposed between 1996 and 2010. Those quality measures relate to 97 different quality attributes. Among all the aspects considered in the exhaustive review in [20], the authors classify the quality attributes in the categories of functional suitability, reliability, performance efficiency, operability, security, compatibility, maintainability, and transferability.
Measuring systems developed under a SPL or feature oriented software development has continued being a topic of interest for the community. For example, [25] empirically evaluated a decision model for adopting software product lines; [1] proposes eight metrics for FOSD that consider implementation-related aspects; [8] presented a proposal for aggregating metrics for feature models using fuzzy logic; and [4] presented structural metrics to assess the maintainability of SPLs.
Recently, [13] has presented a systematic literature review on metrics for specifically analyzing variability and its implementation in software product lines, considering literature published up to 2018. They found 147 metrics, from which 57 are variability model metrics. However, features are not something static once the system has been developed and deployed. Analyzing how feature models of the systems evolve is important. Therefore, some of the metrics compiled in [13] address measurements on data obtained from the use of each feature in the configurations of each customer in real deployments.
In this paper we use some of those metrics for evaluating the feature model of the system, namely: number of features (NoF) [9], coefficient of conectivity-density (CoC) [4], depth of tree (DoT) [6, 9], number of leaf nodes (NLeaf) [9], number of Or-feature groups [7], number of X or-feature groups [7], the ratio of variability (RoV) [4], and the theoretical (de-)selection ration (TSR) [17]. Section 4 presents interesting findings from this evaluation.
3 Applying FOSD to a SaaS System: Home Care Service
3.1 Description of the Domain
In Spain, all city councils have to provide a home care service to dependent people. These people are evaluated according to their medical and economic situation by the municipal technicians, who assign them a number of weekly hours of attention and a price to pay for them (which can range from free to a percentage of the real cost). In general, city councils do not directly provide this service, but they subcontract it to specialized companies. These companies have hired both assistants, who take care of the dependent users in their homes, in the schedule and with the conditions they need, and coordinators who organize the daily agenda of each assistant.
The management of this service is extremely complex for both companies and city councils. On the one hand, the hourly price of the service that the city council pays to each company depends on the conditions of the contract and can also specify a price for different days (weekdays, weekends, holidays, nights, etc). On the other hand, companies have to pay full salaries to their assistants (not just the hours they worked at dependent’s homes), even when they just can strictly charge the hours of service they actually give, which makes it critical for them to do plannings that minimize the displacements.
In addition, there are dependents for whom it is essential to receive the service as they depend on it to eat, to get out of bed or to have a minimum hygiene, so they must always have an assistant at the scheduled time. However, assistants have vacations, days off and sick leave, and replacing them sometimes requires increasing the number of work hours of other colleagues, which is only possible within certain legal limits. Besides, dependents have periods of hospitalization or travel to their family home which means interrupting the service (and stop paying), causing gaps in the agenda of their assistants and, if not managed, losses for companies.
In order to deal with this reality, home care service companies work with a fundamental concept that they call the “bag of hours” of each assistant, that is, the number of hours that each one works in a given period regarding to the number of hours established in their contracts in such period. Managing these data for each assistant allows the company of a home care service to automatically have up-to-date and detailed information about the hours hired and worked by their employees, in addition to other data of interest. Each bag of hours is calculated as the difference between hours hired, and hours actually worked (including complementary hours) or permission hours, where:
- N° of hired hours is the number of hours assigned to the employee for her/his current contract.
- N° of worked hours is the number of hours actually worked by the employee. For this, the hours of the services carried out in a period of time are added. Certain factors are also taken into account, such as absences or services canceled at the request of a user.
- N° of complementary hours is the number of overtime hours worked beyond the time hired and they are paid separately.
- N° of permission hours is the number of paid hours (permission, holidays, public holidays, sick leave, etc) and unpaid permissions.
As a part of the monitoring they do of the service, municipalities want to be informed of everything at any time, especially the times of arrival and departure of each assistant to each domicile and when a dependent changes his assistant, as frequent changes mean a low quality of service.
In order to give support to all these processes, we developed an application that is being marketed as SaaS and is currently in use in 111 Spanish city councils, most of them in Galicia, and 79 companies that have hired a total of 5,649 assistants. This application offers a company profile and a city council profile to access the data of each municipality, so that the application itself serves as a means of communication between them. The check-in in each domicile is achieved by calls from the number of the domicile to a special phone number of a digital switchboard and is reflected in the database available to the city council and company. On the other hand, a mechanism is offered so that the company can efficiently plan the organization of the service and the scheduling of its assistants. The city council can also access the files of the dependent users, nowadays, a total of 14,662, including which assistant provides service to each user each day.
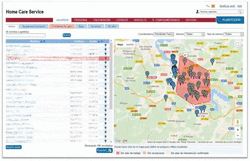
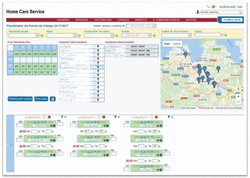
Figure 2 shows an screenshot of our system, that gives the complete list of dependent users, with links to get all the information registered, with the corresponding map to facilitate their geolocation. Figure 3 presents the interface that facilitates coordinators to organize the daily schedule of the assistants, taking into account crucial parameters such as distances between users, bag of hours, tasks to perform, etc.
Although the mechanics of work are similar in all companies and municipalities, the reality is that points of variability began to emerge from the beginning. This is due to the fact that different companies and city councils have different protocols of action and, logically, they wanted the management application to support their way of working. In the generation of these data a multitude of parameters are involved. Further, each city council and company calculate the bag of hours differently, taking into account certain factors of interest. Therefore, the bag of hours is a challenge due to its high complexity and variability.
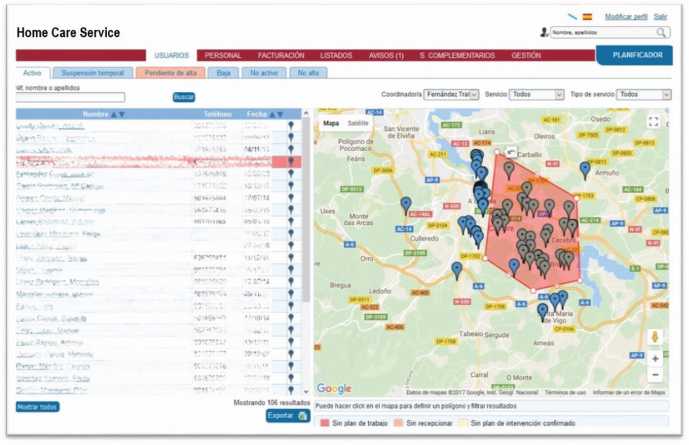
Figure 2 List and geographic location of dependents in Home Care Service.
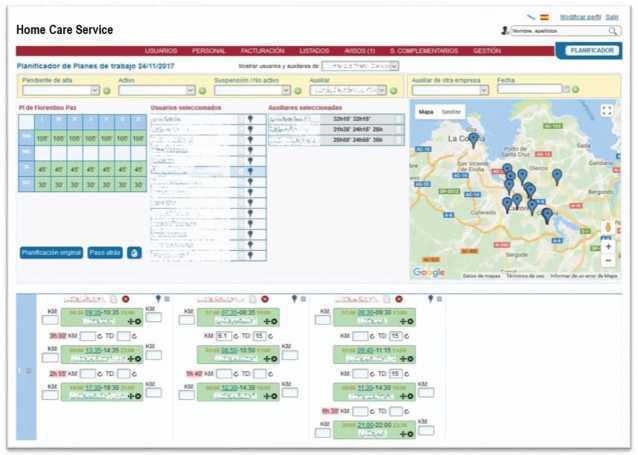
Figure 3 Scheduler.
Another complex part of the system is the billing of services. The company and the city council generate invoices for the services in a certain period of time. Therefore, it is necessary to generate both the invoice that the company charges the city council for providing the service and the invoice that users must pay to the city council.
3.2 Description of the Feature Model
The features that allow the different clients to adapt the behavior of the software to their needs can be grouped in features for city council, features for the company (those that apply to the company or its assistants), and features for each assistant.
3.2.1 City Council
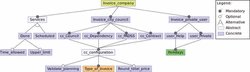
The Home Care Service is intended to be used by several city councils, where each one has different needs for daily work. Figure 4 shows the part of the feature model representing the features available for the city councils.
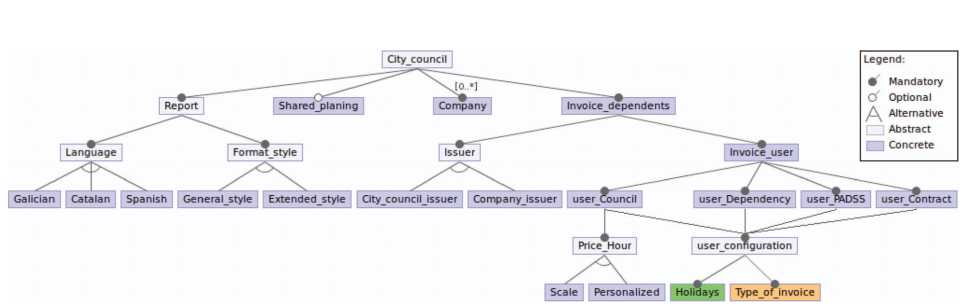
Figure 4 Feature diagram: city council.
The feature Report configures the language and style of the reports exchanged between the city council and its companies. At this moment, regarding the language, variability is defined by three alternative features: Galician, Catalan or Spanish. Moreover, the feature Format style allows us to choose the template that will be used for reports, a General style or an Extended style, where the first one customizes the information shown according to the type of report and the second feature uses the same general form for all.
The optional feature Shared planning makes the schedules of users of the municipality visible to all its companies. This feature is useful when an assistant is off sick and an assistant of another company must take care of his users temporarily. The city council charges users for the services provided, as we stated before, in the percentage established. The variability of this billing is defined by the feature Invoice dependents. Feature Issuer allows city councils to invoice themselves (City council issuer) or to delegate the invoicing to the companies (Company issuer). In addition, users pay according to the category they belong to. The system allows to configure invoicing for four categories (Council, Dependency, PADSS, and Contract). For each of them, it is selected which days are consider holidays (Holidays), these days have a special price, and how each service is charged (Type of invoice). Those two features are described in Section 3.2.5 and Section 3.2.6, respectively. Besides, for the category Council, the price per hour charged (feature Price Hour) can be obtained from a scale (Scale) or can be a custom price (Personalized).
Finally, one city council is associated with several companies. The feature model of the feature Company is shown in Section 3.2.2.
3.2.2 Company
The feature model corresponding to an association city council-company (a company that operates in a city council) is shown in Figure 5.
Companies design the weekly schedule of their care assistants. Mean of transport sets the mean of transport used by workers: Walking or Driving (this will be taken into accound during planning).
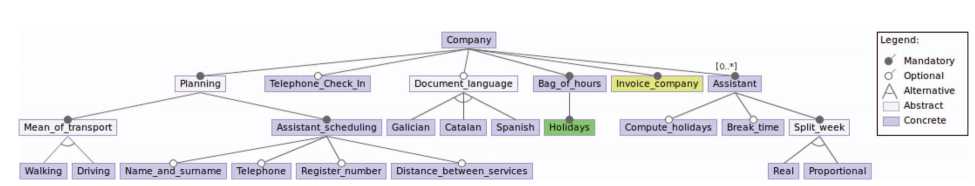
Figure 5 Feature diagram: company.
The feature Assistant scheduling allows us to configure the information that contains the weekly planning that the assistants receive. In addition to showing the days and hours of each service, some other attributes of the dependant can be included as name and surname, telephone, register number, and the distance from that service to the next one.
The Home Care Service implements the functionality, represented by the feature Telephone Check in, to record the real start time and the duration of each service through a system of telephone calls. When an assistant starts the service in a dependents home, he/she makes a call (from the user’s telephone) to a virtual phone number to confirm his/her entry. This process is repeated at the end of the service. With this system, for example, companies are able to detect absences or calculate the actual time worked of their employees.
Document language defines the current language for the internal documents of a company, that is, documents that are not visible for the city council. There are three different options: Galician, Catalan and Spanish.
Another important feature of the Home Care Service is the Bag of hours. The hours worked by each employee are displayed in a table, aggregate for weeks and months. Usually, services on holidays have a greater weight than the rest of the services. For instance, an hour worked on a holiday counts as two hours on a work day, in the bag of hours. Holidays are selected with the feature Holidays. This feature is described in Section 3.2.5.
Companies can also invoice and charge the city councils for their services. The configuration of this module is done under the feature Invoice company. Due to space constraints, the corresponding subtree is shown in Section 3.2.3.
3.2.3 Company invoicing
The variability of the invoicing system is split into three main features: Services, Invoice city council and Invoice private user. Every month, companies charge city councils according to the total hours worked. Services sets how to count the time to bill for each service. With Scheduled only the planning time is considered. On the other hand, Done takes into account the real time worked along, with the optional sub-features Time allowed and Upper limit. For example, let us suppose the scheduled time is one hour and the actual time worked is 55 minutes. The option Scheduled always charges one hour, whereas the feature Done only computes 55 minutes.
The company invoices the corresponding city council to taking care of their dependents. For each category (Council, Dependency, PADSS, and Contract), the type of invoice that applies must be indicated (see Section 3.2.6). The feature Validate planning activates a process that does not allow the creation of dependent’ schedules that do not keep the restrictions previously imposed by the city council. Round total price rounds the final amount to an integer number (for example, 15.8 euros to 16 euros).
A company has private users that are not managed by a city council. These users are clients of the company and it is the company that is responsible for their management. There are two different categories of private user represented by features Help and Private. The feature Invoice private users allows the configuration of the invoicing for both types of users. In addition, Holidays sets the days with a special price.
3.2.4 Care assistant
The service also manages the information of the care assistants of a company. Figure 6 shows features relative to them under the feature Assistant.
The feature Assistant allows us to configure how the worked hours are computed for each assistant in the bag of hours. Compute holidays indicates that the hours worked on a holiday will have a greater weight than a normal day. The optional feature Break time is able to assign a break time to the assistants during their workday (for every four hours of continuous work). Finally, Split week indicates how the hours are divided when a week belongs to two different months. Real sets that each month is assigned their real worked hours whereas Proportional splits the total hours of the week proportional to the number of days of each month. For example, if the last week of March has 35 hours worked, where the first 5 days of the week belong to March and the 2 following days to April, 25 hours will be assigned to March (5 hours per day and 5 days) and the remaining 10 hours to February (5 hours per day and 2 days).
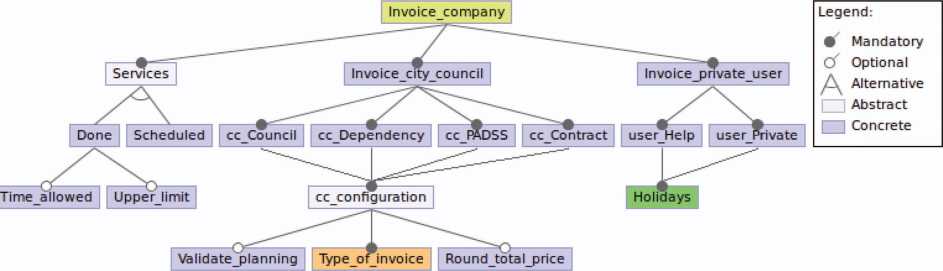
Figure 6 Feature diagram: invoice.
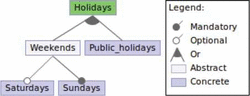
3.2.5 Holidays
Figure 7 shows the feature model of Holidays that allows to establish which days are considered holidays for the bag of hours of care assistants, or to calculate the amount of the invoices. Holidays are composed of public holidays (Public holidays) and weekends (Weekends). In turn, a weekend is formed by a Sunday (Sunday) and, optionally, by a Saturday (Saturday).
3.2.6 Type of invoice
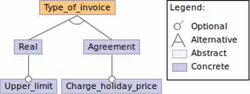
The feature model of Type of invoice is shown in Figure 8.
There are two alternative ways of billing:
- Real: The amount of the invoice is calculated based on the real computed time for the services of the month. If the optional feature Upper limit is enabled, the system does not allow to charge more than the assigned monthly hours in their planning.
- Agreement : It always charges the assigned monthly hours. If the real computed hours are greater than the assigned hours, with the feature Charge holiday price, the time difference is charged with a special price (as hours on holidays).
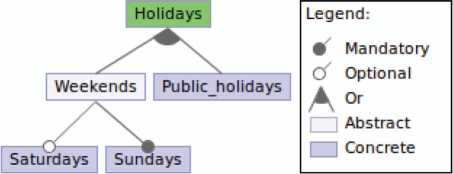
Figure 7 Feature diagram: holidays.

Figure 8 Feature diagram: type of invoice.
4 Empirical Evaluation
In general, parametrized systems or software product lines are designed thinking in user requirements and variability from an abstract point of view. That is, the domain analysis may allow us to identify that a given feature may be present or not for some users, or that for a certain feature the user may need to choose among many choices of implementation.
However, it may happen that some of the features included in the system are extensively used, while others are just used by a few customers. Evaluating the usefulness of a feature is not always straightforward. The easiest scenario would be the one in which each user is a customer, and we do not worry about the feature cost. However, this is not always the case. As we have seen in the previous section, a customer can generate a large number of users, each of them choosing their own parametrization of the system. In addition, features can not always be measured in the same way, depending on whether they imply an OR or XOR relationship with their sub-features.
In this section we present an empirical evaluation of the system under a set of metrics for variability obtained from [21]. More specifically, we apply the following metrics on the feature model: number of features (NoF) [9], coefficient of connectivity-density (CoC) [4], depth of tree (DoT) [6, 9], number of leaf nodes (NLeaf) [9], number of Or-feature groups [7], number of Xor-feature groups [7], the ratio of variability (RoV) [4], and the theoretical (de-)selection ration (TSR) [17]. These metrics give us information about the feature model of the system and, more importantly, about the use of the features of the system in real deployments.
The data used in this empirical evaluation comes from real user configurations generated in two years of use after the system first deployment. From its deployment, it has been commercialized to a total of 111 councils and, 79 companies. This generated a total of 147 system configurations for the companies, since a specific company can work for one or more city councils. The system is currently used by 5,469 workers to reflect the result of their daily work. Each worker has his/her own configuration (see Table 1).
Table 1 Number of users of each user type in the real deployment over a period of two years
| Configuration Type | # of Users |
| City councils | 111 |
| Companies | 147 |
| Workers | 5,649 |
4.1 Metrics on the Feature Model
4.1.1 Metrics on the feature model
Table 2 summarizes basic measurements on the feature model. The number of features (NoF), coefficient of connectivity (CoC), depth of tree, number of leaf nodes (NLeaf), number of Xor-and Or-feature groups, and the ratio of variability provide us with information about the complexity of the feature model.
The model we have presented in the previous section includes a total of 79 features, structured in a tree of depth 8. From those 79 features, 34 of them are leaf nodes. The feature model contains one Or-feature group, and 9 Xor-feature groups.
The ratio of variability (RoV) measures the average branching factor in the feature model, that is, the average number of children per parent node in the model. As it is defined in [21], the RoV can be obtained as follows:
Where fm is the feature model. In the feature model we presented in the previous section there are 45 internal nodes and 34 leaf nodes, so the ratio of variability is RoV = 1.34, that is, each internal node has an average of 1.34 children in the feature model.
Table 2 Summary of measurements on the feature model
| Metric | Value |
| Number of features (NoF) | 79 |
| Number of edges | 81 |
| Coefficient of conectivity (CoC) | 1.02 |
| Depth of Tree (DoT) | 8 |
| Internal nodes | 45 |
| Leaf nodes (NLeaf) | 34 |
| Or-feature groups (NOr) | 1 |
| Xor-feature groups (NXor) | 9 |
| Ratio of variability (RoV) | 1.32 |
4.2 Metrics on Feature Usage
4.2.1 Theoretical (de-)selection ratio
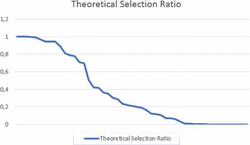
The theoretical (de-)selection ratio is one of the most interesting we found for evaluating the success of the system and its features in real deployments. This ratio measures for a feature f the percentage of configurations in which it has been selected. In our case, we computed the theoretical selection ratio, that is, we counted how many times a feature is being used from all the possible configurations.
The chart shown in Figure 9 shows the theoretical selection ratio, TSR(f), for each feature, sorting the features (X-axis) in decreasing value of the TSR(f). The information shown in the chart is very interesting, since we can see that some features are being used by a significant number of customers/users in their configurations, while others are not being used at all. For example, in the case of the city councils, 19 out of 111 of them issue the invoices themselves (feature City council issuer), and 81 of the councils prefer to delegate the invoice issuing on the companies. Taking into account that these two features form part of a Xor-feature group, we consider their selection ratio normal and acceptable. However, other features, such as Round margin, Done, and Upper limit are not used at all, which questions if they should have been incorporated into the system or not.
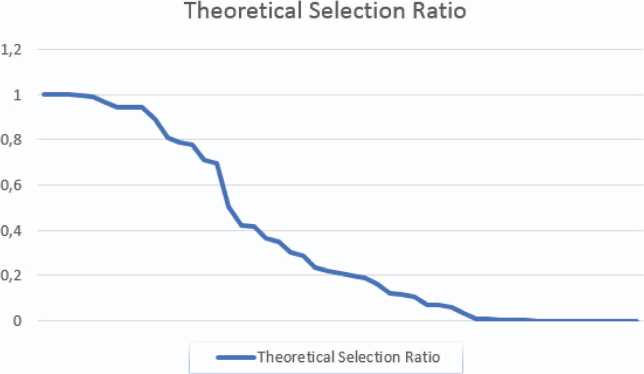
Figure 9 Theoretical selection ratio of the feature model.
Incorporating a new feature to the system has a cost, that can be higher or lower depending on the complexity of the feature. Therefore, making the decision of adding a feature should be based in the potential value it will add to the product. In the results we obtained from the empirical evaluation of the system we can see that 48% of the features have a selection ratio below 0.2, a 36% of the features have a selection ratio below 0.1, and 18% of the features have not yet been used in any configuration of the system.
Incorporating a feature to the system not only affects the cost of development and the system’s value, but also the complexity of the system. A feature adds complexity to both the implementation, to the parametrization interfaces, and to the deployments for new customers. The TSR could be used before incorporating a new feature to make the decision, based on market research information.
As we introduced in the previous sub-section, the decision of incorporating a given feature to the system is based on its cost, and on a perspective of its contribution to selling the system, that is directly reflected on its usage ration TSR(f).
We can define a new metric to compare features based on their cost and their real usage, the feature worthiness:
Using this metric, the cost of each feature is inversely weighted by its usage in real deployments.
5 Conclusions
In this paper we have presented a real experience on using variability management to analyze and model the variability in a complex real web system delivered as a service. Applying variability management has allowed the developers to analyze the features of the system under a solid framework, and in a systematic and comprehensive way. This approach has allowed the development team to deal with variation in an easy and natural way.
In addition to presenting the system and the feature model we have identified during its development, we have presented real data on the deployment of the system and the use of the features introduced in the system by the different user profiles it supports (councils, companies, and auxiliar assistants). In this analysis we have found interesting results regarding the use of the features. Some of them are considered by the company that developed the system as worthwhile or profitable, since many customers use of the options and also many users use the other options for that feature. However, the data also reflect that some features have been developed only for the specific need of one specific customer, so they are considered by the company that developed the system as less profitable. In addition, while dependencies had not been found during the variability analysis, the data suggest that some dependencies do really exist between different features, since the number of customers using one of its options is the same.
We consider that these results raise interesting questions for future work, in which we are currently working. First, some way of introducing the concept of return on investment in the variability management framework would be of interest for many companies, since this would help not only in identifying and analyzing features, but also in making the decision of whether introducing them in the system is worth or not. On the other hand, this real project has helped us to detect that identifying dependencies between features is not always direct during the analysis phase. Analyzing the real-world data collected from real systems to try to automatically identify such dependencies is also an interesting problem for future work.
Acknowledgments
This work has been partially funded by Xunta de Galicia / FEDER-UE CSI: ED431G/01 (Centros singulares de investigación de Galicia), Xunta de Galicia / FEDER-UE CSI: ED431C 2017/58 (Grupo de Referencia Competitiva), MINECO-AEI/FEDER-UE Datos 4.0 (TIN2016-78011-c4-1-R), MINECO-AEI/FEDER-UE ETOME-RDF3D3 (TIN2015-69951-R), MINECO-AEI/FEDER-UE Flatcity (TIN2016-77158-C4-3-R), and MICIU/FEDER-UE BIZDEVOPS-GLOBAL (RTI-2018-098309-B-C32).
References
[1] Ramon Abilio, Gustavo Vale, Eduardo Figueiredo, and Heitor Costa. Metrics for feature-oriented programming. In Proceedings of the 7th International Workshop on Emerging Trends in Software Metrics, WETSoM ’16, pages 36–42, New York, NY, USA, 2016. ACM.
[2] Sven Apel, Don Batory, Christian Kästner, and Gunter Saake. Feature-oriented software product lines: Concepts and implementation. Springer, 2013.
[3] Sven Apel and Christian Kästner. An overview of feature-oriented software development. Journal of Object Technology, 8(4):1–36, 2009.
[4] Ebrahim Bagheri and Dragan Gasevic. Assessing the maintainability of software product line feature models using structural metrics. Software Quality Journal, 19:579–612, 09 2011.
[5] David Benavides, Sergio Segura, and Antonio Ruiz-Corts. Automated analysis of feature models 20 years later: A literature review. Information Systems, 35(6):615–636, 2010.
[6] T. Berger, S. She, R. Lotufo, A. Wasowski, and K. Czarnecki. A study of variability models and languages in the systems software domain. IEEE Transactions on Software Engineering, 39(12):1611–1640, Dec 2013.
[7] Thorsten Berger and Jianmei Guo. Towards system analysis with variability model metrics. In Proceedings of the Eighth International Workshop on Variability Modelling of Software-Intensive Systems, VaMoS ’14, pages 23:1–23:8, New York, NY, USA, 2013. ACM.
[8] Carla I. M. Bezerra, Rossana M. C. Andrade, José M. S. Monteiro, and Davi Cedraz. Aggregating measures using fuzzy logic for evaluating feature models. In Proceedings of the 12th International Workshop on Variability Modelling of Software-Intensive Systems, VAMOS 2018, pages 35–42, New York, NY, USA, 2018. ACM.
[9] Carla I. M. Bezerra, Rossana M. C. Andrade, and José Maria S. Monteiro. Measures for quality evaluation of feature models. In Ina Schaefer and Ioannis Stamelos, editors, Software Reuse for Dynamic Systems in the Cloud and Beyond, pages 282–297, Cham, 2014. Springer International Publishing.
[10] Paul Clements and Linda Northrop. Software product lines. Addison-Wesley, 2015.
[11] Krystof Czarnecki and Ulrich Eisenecker. Generative programming: methods, tools, and applications. Addison-Wesley, 2000.
[12] Krzysztof Czarnecki, Simon Helsen, and Ulrich Eise` necker. Formalizing cardinality based feature models and their specialization. Software process: improvement and practice, 10(1):7–29, 2005.
[13] Sascha El-Sharkawy, Nozomi Yamagishi-Eichler, and Klaus Schmid. Metrics for analyzing variability and its implementation in software product lines: A systematic literature review. Information and Software Technology, 106:1–30, 2019.
[14] Matthias Galster, Uwe Zdun, Danny Weyns, Rick Rabiser, Bo Zhang, Michael Goedicke, and Gilles Perrouin. Variability and complexity in software design: Towards a research agenda. SIGSOFT Softw. Eng. Notes, 41(6):27–30, Jan. 2017.
[15] Kyo C. Kang, Sajoong Kim, Jaejoon Lee, Kijoo Kim, Euiseob Shin, and Moonhang Huh. Form: A feature-oriented reuse method with domain-;specific reference architectures. Annals of Software Engineering, 5(1):143, Jan. 1998.
[16] C. Lizhen, W. Haiyang, J. Lin, and H. Pu. Customization modeling based on metagraph for multi-tenant applications. In 5th International Conference on Pervasive Computing and Applications, pages 255–260, Dec. 2010.
[17] Stefan Mann and Georg Rock. Control variant-rich models by variability measures. In Proceedings of the 5th Workshop on Variability Modeling of Software-Intensive Systems, VaMoS ’11, pages 29–38, New York, NY, USA, 2011. ACM.
[18] Ralph Mietzner, Andreas Metzger, Frank Leymann, and Klaus Pohl. Variability modeling to support customization and deployment of multi-tenant-aware software as a service applications. In Proceedings of the 2009 ICSE Workshop on Principles of Engineering Service Oriented Systems, PESOS ’09, pages 18–25, Washington, DC, USA, 2009. IEEE Computer Society.
[19] H. Moens, E. Truyen, S. Walraven, W. Joosen, B. Dhoedt, and F. De Turck. Developing and managing customizable software as a service using feature model conversion. In 2012 IEEE Network Operations and Management Symposium, pages 1295–1302, April 2012.
[20] Sonia Montagud, Silvia Abrahão, and Emilio Insfran. A systematic review of quality attributes and measures for software product lines. Software Quality Journal, 20(3):425–486, 2012.
[21] Leonardo Passos, Marko Novakovic, Yingfei Xiong, Thorsten Berger, Krzysztof Czarnecki, and Andrzej Wasowski. A study of non-boolean constraints in variability models of an embedded operating system. In Proceedings of the 15th International Software Product Line Conference, Volume 2, page 2. ACM, 2011.
[22] Klaus Pohl and Günter Böckle. Software product line engineering: Foundations, principles and techniques. Springer.
[23] Salvador Trujillo, Don Batory, and Oscar Diaz. Feature oriented model driven development: A case study for portlets. In Proceedings of the 29th International Conference on Software Engineering, ICSE ’07, pages 44–53, Washington, DC, USA, 2007. IEEE Computer Society.
[24] M. Turner, D. Budgen, and P. Brereton. Turning software into a service. Computer, 36(10):38–44, Oct. 2003.
[25] Eray Tn, Bedir Tekinerdogan, Mert Emin Kalender, and Semih Bilgen. Empirical evaluation of a decision support model for adopting software product line engineering. Information and Software Technology, 60:77–101, 2015.
[26] Dave Zubrow and Gary Chastek. Measures for software product lines. Technical note, Software Engineering Institute (SEI) – Carnegie Mellon University.
Biographies

Oscar Pedreira has M.Sc. and Ph.D. degrees in Computer Science from University of A Coruña, Spain. He is an Associate Professor since 2008 at the same institution. He is a researcher of the Database Laboratory. His research interests include topics in databases (algorithms for similarity search, data structures and algorithms for graph databases, geographic information systems), and in software engineering (process improvement, testing, MDE, and SPL). He has co-authored many articles published in journals and conferences relevant for the research areas mentioned. He has continuously participated in research projects and technology and knowledge transfer projects with different companies.

Fernando Silva-Coira is an Assistant Professor at the Database Lab (LBD) of the Universidade da Coruña (UDC). He received this Ph.D. in Computer Science from the Universidade da Coruña in 2017 for his thesis entitled “Compact Data Structures for Large and Complex Datasets”. His research interests are the design of algorithms and imple-mentation of compact data structures, especially for the representation of geographic data.

Ángeles Saavedra Places is currently an Associate Professor at the Computer Science Department of the University of A Coruña. She received her PhD in Computer Science in 2003 from the same university. Her research interests are in the areas of Digital Humanities, Web Information Systems, Geographic Information Systems and Software Engineering. For further details about her CV see: http://lbd.udc.es/ShowResearcherinformation.do?id=5

Miguel R. Luaces received his M.S. degree in Computer Science from the University of A Coruña (Spain) in 1998 and an European Ph.D in Computer Science from the University of A Coruña (Spain) in 2004. He undertook research in the area of spatial, temporal and spatio-temporal databases at the FernUniversität Hagen (Germany) under the ChoroChronos project funded by the European Union. Today, he is an Assistant Professor at the University of A Coruña, and he is currently a member of the Databases Laboratory of the University of A Coruña where he has been involved successfully in a number of research and development projects. His research interests include Geographic Information Systems, Spatial and Spatio-temporal Databases, Software Engineering, and Web-based Information Systems.

Leticia González Folgueira holds a M.Sc. degree in Computer Science from University of A Coruña since 2008. She has more than 10 years of experience in software development, and she is currently a technical project manager in Enxenio S.L., where she has specialized in SaaS solutions in the social sector. From this experience, her Ph.D. thesis focuses in this domain, addressing the variability and personalization capabilities these applications must provide, as well as the integration of DevOps strategies in SaaS products.