Citation Count Prediction Using Abstracts
Takahiro Baba1, Kensuke Baba2, and Daisuke Ikeda1
1 Kyushu University, 819-0395, Fukuoka, Japan
2 Fujitsu Laboratories, Kawasaki, 211-8588, Japan
E-mail: baba.takahiro.414@m.kyushu-u.ac.jp
Received 20 January 2019;
Accepted 21 March 2019
Abstract
Researchers are expected to find previous literature that is related to their research and potentially has a scientific impact from among a large number of publications. This paper addresses the problem of predicting the citation count of each research paper, that is, the number of citations from other papers to that paper. Previous literature related to the problem claims that the textual data of papers do not deeply affect the prediction compared with data about the authors and venues of publication. In contrast, the authors of this paper detected the citation counts of papers using only the paper abstracts. Additionally, they investigated the effect of technical terms used in the abstracts on the detection. They classified abstracts of papers with high and low citation counts and applied the classification to the abstracts modified by hiding the technical terms used in them. The results of their experiments indicate that the high and low of citation counts of research papers can be detected using their abstracts, and the effective features used in the prediction are related to the trend of research topics.
Keywords: Citation count prediction; Document classification; Text analysis; Machine learning.
1 Introduction
Researchers are required to efficiently determine previous literature that is related to their research and has scientific impact from among a large number of publications. The number of research papers available online is rapidly increasing. Ideally, researchers should survey all possible publications for their research, but it is difficult to read the main text of all paper carefully. Therefore, researchers are expected to choose papers relevant to their research from a huge amount of data, and papers with high impact should be chosen before papers with low impact.
We address the problem of predicting the scientific impact of research papers. The measure of this impact is the citation count of each paper, that is, the number of citations from other papers to that paper. Predicting citation count enables us to screen papers to determine papers that potentially have high impact. Citation count is a reasonable feature for formalizing scientific impact. The impact factor [10], which is often referred as a quality measure of journal titles, is defined for a journal using the citation counts of the articles published in that journal. The h-index [11], which is a measure of the contribution of a researcher to the society concerned, is also based on the citation counts of papers written by that researcher. Citation count will increase as time elapses, and hence is not appropriate for measuring the impact of brand-new papers. Therefore, we need to predict the potential citation count of a paper using features that can be directly extracted from it.
In this study, we predict the citation counts of research papers using only their abstracts. A variety of features can be used for solving the problem of citation count prediction [14]. Previous literature on this problem claims that the textual data of a paper do not deeply affect the prediction compared with data about authors and venue of publication (see Section 5). However, textual data, especially abstracts, are worth analysing in detail for the following reason. Textual data should be directly related to the contents of a paper. In particular, abstracts are usually available as the metadata of respective papers. The other metadata, including authors, authors’ institutions, and journal (or conference) titles can be features of multiple papers, while an abstract corresponds to the paper concerned. In the previous literature, we identified two common limitations in using only abstracts for prediction:
- (1) The prediction accuracy is not high and detailed analyses are not conducted;
- (2) The prediction is explained in terms of trivial findings regarding the trends in research topics.
For the first limitation, we address a binary classification of abstracts into high and low citation counts abstracts as the target task, instead of a regression which is addressed in most previous literature. We tackle an easier task to analyze the effects of abstracts on citation counts in detail.
As for the second limitation, we investigate the effect of the technical terms that appear in abstracts on the prediction.
We investigated several types of classification of research paper abstracts to predict citation count. Our aim is to clarify the effects of (1) the abstracts of papers and (2) the technical and non-technical terms used in abstracts rather than to achieve high accuracy. We applied a standard classification method based on the bag-of-words model [13] to a set of abstracts of papers with high and low citation counts and investigated the accuracy and distinctive phrases. We obtained abstracts with citation counts from a database of research papers. Then, we defined the set of high and low citation counts by selecting top θ% and bottom θ% papers in order of citation count in the obtained abstracts. We also applied the same classification method to another set of modified abstracts in which the technical terms were replaced with a meaningless symbol. Additionally, we conducted a classification using only the technical terms that appear in the abstracts for comparison. Our previous work [4] reported that citation counts can be predicted using only the non-technical terms used in abstracts. This paper performs a strict detection of technical terms. The non-technical terms used in the previous work include some technical terms; hence, the result can be affected by the technical terms. Additionally, this paper compares our prediction method with other methods that use the contiguous occurrences of words and those that use only technical terms to clarify the effects of technical terms on prediction accuracy.
The results of our experiments indicate that the scientific impact of a research paper can be roughly predicted using only its abstract, and the effective features in the prediction are related to the trend of research topics. Papers with high and low citation counts can be accurately classified using their abstracts. However, the same classification of the modified abstracts with hidden technical terms had low accuracy. The accuracy of the classification using only technical terms was better than that of the modified abstracts.
The rest of this paper is organized as follows. Section 2 formalizes the target problem as a classification of documents, and describes the experimental methods. Section 3 reports the experimental results. Section 4 discusses the results and future directions of our study. Section 5 describes related work and clarifies the novelty of our work.
2 Methods
This section formalizes the prediction of the future impact of a research paper as a problem of document classification, and describes the experimental methods.
2.1 Document Classification
We formalized the problem of an approximate citation count prediction as binary classification instead of regression. The positive and negative data were generated from a set of papers using a threshold for the number of citation counts. Figure 1 shows the distribution of papers by citation count and the ratio of the accumulated number of papers to the number of the total papers we used in our experiments. For example, using a threshold of 10%, positive samples are defined as the abstracts of papers whose citation counts are more than 150. For the data sets described below, we conducted three classifications using a standard method using the occurrences of the total words, technical terms, or non-technical terms.
2.2 Data
We used the abstracts and citation counts of papers published in the Proceedings of the National Academy of Sciences (PNAS) [3] for our experiments. PNAS is appropriate for our experiments for the reason that we can obtain a sufficient number of papers published in a single journal title and have citation counts. The scope of PNAS includes any research area in general science. We obtained the metadata, which includes the abstract and citation count, from Europe PubMed Central (Europe PMC) [1].

Figure 1 Distribution of the numbers of papers with a citation count.
We conducted a preliminary experiment and selected the data of papers published in PNAS from 1981 to 2003 (and available from Europe PMC) according to the result of the experiment as follows. Figure 2 shows the annual numbers of papers published from 1915 to 2017 and the average citation counts, where the citation counts are the values as of June 2017. As shown in the figure, the average citation count rapidly decreases after 2004, which indicates that the citation counts of papers published after 2004 could be potentially larger in the future. Therefore, we used the data of papers published before 2004. Additionally, there are two peaks in the graph of average citation counts in the 1970s, which can be attributed to some exceptional factors. Therefore, we used the data of papers published after 1980.

Figure 2 Annual number papers published in PNAS and available from Europe PMC as of June 2017, and their average citation counts.
Additionally, we used abstracts between 100 and 400 words in length. The number of abstracts in this normal data set is 49,171.
We also generated a modified data set of abstracts to clarify the effect of the occurrences of technical terms on the citation counts. As the corpus for defining technical terms, we used Medical Subject Headings (MeSH) [2], which is a medical thesaurus published by the National Library of Medicine. The indexes of MeSH includes a subject heading “Descriptor”, a subheading “Qualifier”, and a supplementary concept record “Concept”. We used all the Descriptors, Qualifiers, and Concepts defined in the latest version as of February 2018 of MeSH as the technical terms for our experiment. The scope of MeSH is considered to be restricted to the life sciences while that of PNAS includes general science. The effect of this difference on the experimental results is examined in Section 4. In addition to the terms, we regarded phrases obtained by dividing the terms using commas as technical terms. We also used combinations of phrases divided by brackets in the terms as technical terms. For a technical term “A (B) C” for phrases A, B, and C, we used the phrases “A B C”, “A C”, “B C”, A, B, and C as technical terms. The number of obtained technical terms is 187,573. Then, all technical terms appearing in the abstracts were replaced with a symbol “X”. For example, the abstract of the paper [7]:
The genomic RNA of human rhinovirus type 14 was cloned in Escherichia coli and the complete nucleotide sequence was determined. The RNA genome is 7212 nucleotides long. A single large open reading frame of 6536 nucleotides was identified, which starts at nucleotide 678 and ends 47 nucleotides from the 3’ end of the RNA genome. Comparisons of the specified proteins with those of other picornaviruses showed a striking homology (44–65%) between rhinovirus and poliovirus. The rhinovirus genomic RNA is rich in adenosine (32.1%) and strongly favors an adenosine or uridine in the third position of codons. The predicted map locations of all the rhinovirus structural and non-structural proteins and their proposed proteolytic cleavage sites are described. was modified by replacing technical terms with “X” as follows:
The X X of X X X 14 was cloned in X and the X X was determined. The X X is 7212 X X. A X X X of 6536 X was identified, which X at X 678 and ends 47 X from the 3’ X of the X X. X of the specified X with those of other X showed a striking X (44–65%) between X and X. The X X X is rich in X (32.1%) and strongly favors an X or X in the X X of X. The predicted X X of X the X X and X and their proposed proteolytic X X are described.
All the abstracts in the normal data set included at least one technical term; hence, the size of the modified data set is equal to that of the normal data set.
2.3 Experiments
We predicted citation counts using the data sets defined in Section 2.2. We conducted 5-fold cross-validation. For training and test data in each validation, we selected the top and bottom θ% papers in the order of citation counts as positive and negative samples, respectively, after normalizing the citation count of each paper by dividing the number by the average citation count of its publishing year. The threshold θ was set to be 2i for 0 ≤ i ≤ 5 and 50. Therefore, the size of the experimental data for each classification is 2θ% of the total data, because each data set is defined using the top θ% and the bottom θ% of the original data.
We conducted five classifications with the normal and modified data sets. We applied the support vector machine (SVM) with a linear kernel to the multisets of the words appearing in the abstracts in the two data sets. We also applied the SVM to the multiset of the word-level 1-, 2-, and 3-grams of the abstracts, where an n-gram of a given sequence is a sequence of contiguous n elements of the sequence. We ignored all the single-character words except for the “X” used for technical terms, and did not use phrases that appeared in more than 50% of the training data for classification. Then, we predicted a positive or negative class using vectors obtained from the multisets. Additionally, we applied the SVM to the sets of technical terms appearing in the abstracts of the normal data set. Finally, we obtained the five data sets:
- Normal: the set of the multiset of the words appearing in each abstract in the normal data set;
- Normal 1–3: the set of the multiset of the word-level 1-, 2-, and 3-grams of each abstract in the normal data set;
- Modified : the set of the multiset of the words appearing in each abstract in the modified data set;
- Modified 1–3: the set of the multiset of the word-level 1-, 2-, and 3-grams of each abstract in the modified data set;
- Technical terms: the set of the technical terms appearing in each abstract in the normal data set.
The accuracy is defined to be the ratio of the number of correct predictions to the number of total predictions examined in a test. The precision and the recall are defined, for each class, to be the ratio of the number of correct predictions for a class to the number of all predictions for that class, and the ratio of the number of the correct predictions for a class to the actual number of samples of that class, respectively.
For comparison, we conducted a linear regression using the same data sets and features used in the binary classification. We investigated the coefficient of determination as a measure of accuracy for five regressions which correspond to the five classifications. The coefficient of determination for predicted values yi and the corresponding true values ŷi for 1 ≤ i ≤ n is defined to be
where
3 Results
Figure 3 shows the accuracy of the five classifications against threshold θ for generating positive and negative samples. Figure 4 shows the dimensionality of the vectors, that is, the number of the phrases, used in the classification for the cases. The confusion matrices of the classifications are shown in Appendix A.
Table 1 shows the coefficient of determination for the five regressions that correspond to the five classifications. By the definition, a minus value of the coefficient means that the prediction is almost meaningless.
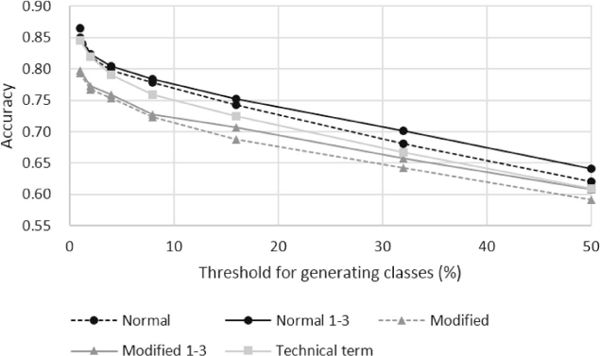
Figure 3 Classification accuracy of research papers with high and low citation counts.

Figure 4 Dimensionality of the vectors used for classifications.
Table 1 Coefficients of determination in five regressions
| Coefficient of Determination | |
| Normal | –3.18 |
| Normal 1–3 | 0.03 |
| Modified | –5.80 |
| Modified 1–3 | –0.04 |
| Technical term | –14.51 |
Tables 2–4 show distinctive phrases of the abstracts of papers with high and low citation counts. The listed phrases correspond to the top and bottom five elements of the separating hyperplane used in the classifier in the order of the coefficients, for the five classifications. Therefore, these phrases should be roughly distinctive of the positive or negative data.
Table 2 Phrases with large and small coefficients in classification of the normal data set
| θ | Phrases | |
| Large | 1 | human; dna; brain; gene; neurons |
| 2 | human; neurons; blood; genes; gene | |
| 4 | major; neurons; cortex; blood; genome | |
| 8 | cortex; bacterial; human; potent; fluorescent | |
| 16 | epithelial; bacterial; cortex; actions; endothelial | |
| 32 | consensus; cortex; mariner; variety; nitrocellulose | |
| 50 | confirming; latently; leaflet; women; overproducing | |
| Large, (1–3)-gram | 1 | human; dna; gene; cells; expression |
| 2 | gene; human; genes; dna; neurons | |
| 4 | gene; human; protein; brain; neurons | |
| 8 | human; gene; brain; cortex; sequence | |
| 16 | human; brain; bacterial; mice; cortex | |
| 32 | brain; human; cortex; common; oxygen | |
| 50 | human; bcl; cortex; brain; oxygen | |
| Small | 1 | kinase; time; relax; idiotype; leukemia |
| 2 | chicken; tcr; adenovirus; q10; epsilon | |
| 4 | chicken; yacs; oocytes; presence; fraction | |
| 8 | not; 14c; subunit; cd3; yacs | |
| 16 | not; homeodomain; respect; sea; material | |
| 32 | not; whether; yacs; question; example | |
| 50 | ria; xenografts; nonglycosylated; cytoskeleton; thermolysin | |
| Small, (1–3)-gram | 1 | time; idiotype; to the; kinase; theory |
| 2 | on; electron; that the; time; scale | |
| 4 | by the; subunit; on; oocytes; temperature | |
| 8 | by the; from the; globin; trna; subunit | |
| 16 | not; ii; chicken; subunit; that the | |
| 32 | from the; not; chicken; his; apob | |
| 50 | not; from the; intermediate; nb; induced |
Table 3 Phrases with large and small coefficients in classification of the modified data set
| θ | Phrases | |
| Large | 1 | including; within; we; among; thus |
| 2 | including; within; thus; identify; known | |
| 4 | encodes; including; known; base; amplified | |
| 8 | required; pathogenesis; potent; cloned; includes | |
| 16 | tasks; pathogenesis; here; cloned; glutamylcysteine | |
| 32 | constituent; glutamylcysteine; bpv; oxidatively; amyloid | |
| 50 | homopyrimidine; oxidatively; augment; pipet; suboptimal | |
| Large, (1–3)-gram | 1 | in X X; that X; X by: X including; that X X |
| 2 | in X X; that X; in X and; X including; by X | |
| 4 | in X X; that X; in X and; identified; hcv | |
| 8 | in X and; that X; identified; cloned; required | |
| 16 | in X and; cloned; the X and; isolates; of X and | |
| 32 | cloned; in X and; of X that; tasks; hcv | |
| 50 | of X that; ebna; are X of; thus X X; trx | |
| Small | 1 | when; ca; atoms; if; gt |
| 2 | na; if; hr; phosphorylated; scale | |
| 4 | yacs; phosphorylated; much; terms; na | |
| 8 | 14c; repertoire; revertants; terms; authentic | |
| 16 | enzyme; interfere; arbitrary; pe; polymerase | |
| 32 | cd2; agrees; preincubated; carboxylase; reinitiation | |
| 50 | ria; exclusion; phosphatidylcholine; instructive; organized | |
| Small, (1–3)-gram | 1 | on; on the; ca; atoms; when |
| 2 | on; that the; if; na; on the | |
| 4 | on; na; mm; at the; phosphorylated | |
| 8 | mm; from the; by the; 14c; the results | |
| 16 | not; when the; ii; mm; injected | |
| 32 | kda; mm; not; when the; enzyme | |
| 50 | still; not; 65; mtx; X is not |
Table 4 Phrases with large and small coefficients in classification of the normal data set using technical terms
| θ | Phrases | |
| Large | 1 | human; brain; dna; gene; sequence |
| 2 | gene; brain; disease; dna; cell | |
| 4 | brain; gene; dna; cell; protein | |
| 8 | amyloid; extracellular; fluorescent; gene; endothelial | |
| 16 | amyloid; arabidopsis; fibronectin; gene; pathogens | |
| 32 | adhesive; p65; synonymous; arabidopsis; lysozyme | |
| 50 | bacteriophage p1; heat-shock proteins; adhesive; rna helicase; antiport | |
| Small | 1 | late; problem; paper; origin; finite |
| 2 | sensitivity; period; problem; fusion; isolated | |
| 4 | exposure; temperature; mutagenesis; problem; artificial | |
| 8 | probability; accessibility; paper; immunoblot; dehydrogenase | |
| 16 | homeodomain; shuttle vector; sepharose; radioimmunoassay; reporter | |
| 32 | mosquitoes; heavy-chain; retinol; yeast artificial; orangutan | |
| 50 | texas; orangutan; societies; schedules; disparity |
4 Discussion
This section exams the experimental results.
4.1 Main Findings
We found that papers with high and low citation counts could be classified using only their abstracts. As shown in Figure 3, the accuracy of the five classifications using abstracts were better than the expected value 50% of that of random predictions. Therefore, by using this metrics, we can analyze the effects of contiguous occurrences of words or technical terms on the classification, while the linear regression with the abstracts predicted meaningless values as shown in Table 1.
Additionally, the accuracy increases in opposition to θ. In case where θ = 50, which corresponds to the naive binary classification with the total data, the prediction accuracy is low for the five data sets. By using only restricted papers we can clarify the difference between papers with high and low citation counts.
The effect of contiguous occurrences of words on the classification is small. As shown in Figure 3, the classification accuracy generated by the two classifications using the 1-, 2-, and 3-grams were almost the same as that by the corresponding classifications using the 1-grams, although the dimensionalities of the vector spaces increased by more than ten times by using (1,3)-grams as shown in Figure 4. Additionally, Tables 2 and 3 show that using (1,3)-grams does not find any phrase which represents a writing style or an idiom, while our similar experiment of classification for native language identification can find such phrases [5]. Therefore, we suppose that the effect of the information obtained from textual data including the writing style and idioms is little on predicting high impact papers.
The effect of technical terms on the classification is large. The decrease in classification accuracy caused by using only technical terms from the normal one was smaller than that caused by hiding technical terms as shown in Figure 3. As mentioned in Section 2.2, some technical terms used in the papers of PNAS are not included in the set of the technical terms defined using MeSH. The effect of technical terms was shown even using the insufficient set. As shown in Figure 4, the dimensionality of the vector space was small even compared with that of the classifications using the 1-grams. Therefore, we can estimate that most effective factors used in the classification were included in the set of technical terms.
4.2 Key Findings
We can conclude that the effect of technical terms on the prediction is large, also from the distinctive phrases used in the classification. As shown in Tables 2 and 4, most distinctive phrases of positive samples in the classification with the normal data set are included in the technical terms. Additionally, most distinctive phrases of positive data in the classification with the modified data set using (1–3)-grams contain the symbol which means technical terms as shown in Table 3. Therefore, the effect of technical terms on the prediction is considered to be large. In the case of the modified data set, using the generalized technical term finds how technical terms are used in abstracts instead of what the terms are.
5 Related Work
The novelty of our work is that we clarified the following:
• the effect of research paper abstracts on citation count prediction; • the effect of the technical terms that appear in an abstract on the prediction.
Existing studies have concluded that textual data of papers (including abstracts) are not effective for citation count prediction when compared with data related to authors and publication venues. Additionally, the textual data are treated as topics extracted from raw text in existing work. Therefore, non-topic information included in the textual data, such as the writing style, has not been considered as a feature for prediction.
Yan et al. [14] treated textual data as topics and concluded that their effect on prediction is small. They formalized the problem of citation count prediction. They applied four kinds of regression to three types of features of each paper (content, author, and venue). The content feature category includes the topics, which were obtained using latent Dirichlet allocation [6] from the textual data of the papers. The categories of author and venue include attributes related to the authors of each paper and the conference or journal at which each paper was published, respectively. The results of their experiments indicate that the features in the content category have little effect on prediction accuracy.
Chen and Zhang [8] also treated textual data as topics, but their standalone effect on prediction is not clear. They predicted citation count using regression for features related to the contents and authors of papers. They conclude that the features included in the content category are more effective than the author category. However, the effect of the textual data on the prediction was not clear, because both categories include topic information obtained from textual data using latent Dirichlet allocation, and the content category includes the information of past citation counts in addition to the topic information.
Li et al. [12] did not use textual data for prediction. They used the change in citation count over time for the prediction. Their method estimates this change using some paper features, but these features do not include textual data.
Dong et al. [9] treated textual data as topics for another type of prediction and concluded that their effect is small. They predicted h-index instead of citation count and investigated the effects of several features. They concluded that the relationship of the main author to the research topic and the venue are more effective for prediction than the trend in research topics and the co-authors. Textual data are used as topics for the prediction, and their standalone effect is small.
Yogatama et al. [15] used textual data as the main feature for prediction, but they treated them as topics. They used the change in topics over time for citation count prediction, which can be treated as research topics trends.
6 Conclusion
The future impact of a research paper can be roughly predicted using only its abstract, but most factors used in the prediction are related to the trend in research subjects rather than the abstract’s writing style. We classified the abstracts of papers with high and low citation counts using word occurrences, and compared the result with the cases in which we hid technical terms or we used only technical terms. Using abstracts affected the accuracy of binary classification of papers into those with high and low citations. The decrease in accuracy by hiding technical terms was larger than the decrease caused by using only technical terms. Therefore, we conclude that the citation counts of papers are highly related to the technical terms that appear in their abstracts.
One of our future work is improving the classifier for citation count prediction. We used the simple SVM with a linear kernel which straightforwardly define distinctive phrases of each class on the basis of the weights used in the classifier. We can apply other machine learning methods to the classification to improve the accuracy, but we need to explain the mechanism of classification as the finding of distinctive phrases. Another direction is extending the analysis of distinctive phrases. We listed several phrases with large or small weights in the classifier, but the vocabulary size, that is, the dimensionality of the vector space for each classification was extremely large. Therefore, we need a method to investigate a large number of phrases efficiently.
Additionally, we are planning to apply our results to actual problems.
The results of the experiments is expected to be used for an automatic proofreading of research papers; the scores put on phrases can suggest a better phrase expected to lead high impact.
Acknowledgments
We thank Kimberly Moravec, PhD, from Edanz Group (www.edanzediting.com/ac) for editing a draft of this manuscript. This work was supported by JSPS KAKENHI Grant Number 19K12133.
Appendix A
Tables A.1–A.3 show the confusion matrices of the classifications.
Table A.1 Confusion matrices generated by classifications of the normal data set
| 1-gram Positive Negative Precision | (1–3)-gram Positive Negative Precision | ||||||
| θ=1 | Positive | 439 | 81 | 0.84 | 456 | 113 | 0.8 |
| Negative | 51 | 409 | 0.89 | 34 | 377 | 0.92 | |
| Recall | 0.9 | 0.83 | 0.93 | 0.77 | |||
| θ=2 | Positive | 839 | 212 | 0.8 | 890 | 255 | 0.78 |
| Negative | 141 | 768 | 0.84 | 90 | 725 | 0.89 | |
| Recall | 0.86 | 0.78 | 0.91 | 0.74 | |||
| θ=4 | Positive | 1596 | 427 | 0.79 | 1697 | 498 | 0.77 |
| Negative | 369 | 1538 | 0.81 | 268 | 1467 | 0.85 | |
| Recall | 0.81 | 0.78 | 0.86 | 0.75 | |||
| θ=8 | Positive | 3107 | 917 | 0.77 | 3293 | 1065 | 0.76 |
| Negative | 823 | 3013 | 0.79 | 637 | 2865 | 0.82 | |
| Recall | 0.79 | 0.77 | 0.84 | 0.73 | |||
| θ = 16 | Positive | 5907 | 2086 | 0.74 | 6234 | 2276 | 0.73 |
| Negative | 1958 | 5779 | 0.75 | 1631 | 5589 | 0.77 | |
| Recall | 0.75 | 0.73 | 0.79 | 0.71 | |||
| θ = 32 | Positive | 10861 | 5158 | 0.68 | 11645 | 5309 | 0.69 |
| Negative | 4869 | 10572 | 0.68 | 4085 | 10421 | 0.72 | |
| Recall | 0.69 | 0.67 | 0.74 | 0.66 | |||
| θ = 50 | Positive | 15482 | 9532 | 0.62 | 16873 | 9921 | 0.63 |
| Negative | 9103 | 15053 | 0.62 | 7712 | 14664 | 0.66 | |
| Recall | 0.63 | 0.61 | 0.69 | 0.6 |
Table A.2 Confusion matrices generated by classifications of the modified data set.
| 1-gram Positive Negative Precision | (1–3)-gram Positive Negative Precision | ||||||
| θ=1 | Positive | 426 | 138 | 0.76 | 459 | 168 | 0.73 |
| Negative | 64 | 352 | 0.85 | 31 | 322 | 0.91 | |
| Recall | 0.87 | 0.72 | 0.94 | 0.66 | |||
| θ=2 | Positive | 806 | 281 | 0.74 | 891 | 357 | 0.71 |
| Negative | 174 | 699 | 0.8 | 89 | 623 | 0.88 | |
| Recall | 0.82 | 0.71 | 0.91 | 0.64 | |||
| θ=4 | Positive | 1533 | 535 | 0.74 | 1662 | 644 | 0.72 |
| Negative | 432 | 1430 | 0.77 | 303 | 1321 | 0.81 | |
| Recall | 0.78 | 0.73 | 0.85 | 0.67 | |||
| θ=8 | Positive | 2915 | 1160 | 0.72 | 3117 | 1325 | 0.7 |
| Negative | 1015 | 2770 | 0.73 | 813 | 2605 | 0.76 | |
| Recall | 0.74 | 0.7 | 0.79 | 0.66 | |||
| θ = 16 | Positive | 5564 | 2602 | 0.68 | 6002 | 2757 | 0.69 |
| Negative | 2301 | 5263 | 0.7 | 1863 | 5108 | 0.73 | |
| Recall | 0.71 | 0.67 | 0.76 | 0.65 | |||
| θ = 32 | Positive | 10251 | 5792 | 0.64 | 11050 | 6100 | 0.64 |
| Negative | 5479 | 9938 | 0.64 | 4680 | 9630 | 0.67 | |
| Recall | 0.65 | 0.63 | 0.7 | 0.61 | |||
| θ = 50 | Positive | 14857 | 10372 | 0.59 | 15893 | 10610 | 0.6 |
| Negative | 9728 | 14213 | 0.59 | 8692 | 13975 | 0.62 | |
| Recall | 0.6 | 0.58 | 0.65 | 0.57 |
Table A.3 Confusion matrices generated by classifications of the normal data set using technical terms
| Positive | Negative | Precision | ||
| θ=1 | Positive | 435 | 96 | 0.82 |
| Negative | 55 | 394 | 0.88 | |
| Recall | 0.89 | 0.8 | ||
| θ=2 | Positive | 824 | 198 | 0.81 |
| Negative | 156 | 782 | 0.83 | |
| Recall | 0.84 | 0.8 | ||
| θ=4 | Positive | 1570 | 430 | 0.78 |
| Negative | 395 | 1535 | 0.8 | |
| Recall | 0.8 | 0.78 | ||
| θ=8 | Positive | 2987 | 950 | 0.76 |
| Negative | 943 | 2980 | 0.76 | |
| Recall | 0.76 | 0.76 | ||
| θ = 16 | Positive | 5741 | 2196 | 0.72 |
| Negative | 2124 | 5669 | 0.73 | |
| Recall | 0.73 | 0.72 | ||
| θ = 32 | Positive | 10494 | 5254 | 0.67 |
| Negative | 5236 | 10476 | 0.67 | |
| Recall | 0.67 | 0.67 | ||
| θ = 50 | Positive | 15009 | 9599 | 0.61 |
| Negative | 9576 | 14986 | 0.61 | |
| Recall | 0.61 | 0.61 |
References
[1] Europe PMC: Europe PubMed Central. https://europepmc.org/. Accessed Feb. 5, 2018.
[2] MeSH: Medical Subject Headings. https://www.nlm.nih.gov/ mesh/. Accessed Feb. 5, 2018.
[3] PNAS: Proceedings of the National Academy of Sciences. http://www.pnas.org/. Accessed Feb. 5, 2018.
[4] Takahiro Baba and Kensuke Baba. Citation count prediction using non-technical terms in abstracts. In Computational Science and Its Applications – ICCSA 2018, pages 366–375. Springer International Publishing, 2018.
[5] Takahiro Baba, Kensuke Baba, and Daisuke Ikeda. Predicting author’s native language using abstracts of scholarly papers. In Foundations of Intelligent Systems, pages 448–453. Springer International Publishing, 2018.
[6] David M. Blei, Andrew Y. Ng, and Michael I. Jordan. Latent dirichlet allocation. J. Mach. Learn. Res., 3:993–1022, 2003.
[7] P L Callahan, S Mizutani, and R J Colonno. Molecular cloning and complete sequence determination of rna genome of human rhinovirus type 14. Proceedings of the National Academy of Sciences, 82:732–736, 1985.
[8] J. Chen and C. Zhang. Predicting citation counts of papers. In 2015 IEEE 14th International Conference on Cognitive Informatics Cognitive Computing (ICCI*CC), pages 434–440, July 2015.
[9] Y. Dong, R. A. Johnson, and N. V. Chawla. Can scientific impact be predicted? IEEE Transactions on Big Data, 2(1):18–30, March 2016.
[10] E Garfield. The history and meaning of the journal impact factor. JAMA, 295(1):90–93, 2006.
[11] J. E. Hirsch. An index to quantify an individual’s scientific research output. PNAS, 102(46):16569–16572, November 2005.
[12] Cheng-Te Li, Yu-Jen Lin, Rui Yan, and Mi-Yen Yeh. Trend-based citation count prediction for research articles. In Tru Cao, Ee-Peng Lim, Zhi-Hua Zhou, Tu-Bao Ho, David Cheung, and Hiroshi Motoda, editors, Advances in Knowledge Discovery and Data Mining, pages 659–671, Cham, 2015. Springer International Publishing.
[13] Christopher D Manning, Prabhakar Raghavan, and Hinrich Schütze. Introduction to information retrieval. Cambridge University Press, 2008.
[14] Rui Yan, Jie Tang, Xiaobing Liu, Dongdong Shan, and Xiaoming Li. Citation count prediction: Learning to estimate future citations for literature. In Proceedings of the 20th ACM International Conference on Information and Knowledge Management, CIKM ’11, pages 1247–1252, New York, NY, USA, 2011. ACM.
[15] Dani Yogatama, Michael Heilman, Brendan O’Connor, Chris Dyer, Bryan R. Routledge, and Noah A. Smith. Predicting a scientific community’s response to an article. In Proceedings of the Conference on Empirical Methods in Natural Language Processing, EMNLP ’11, pages 594–604. Association for Computational Linguistics, 2011.
Biographies

Takahiro Baba received the BSc and MSc degrees from Kyushu University in 2004 and 2011. From 2011 to 2016 he was a employee in the Lafla Inc. Currently, he is a doctoral student in Kyushu University.

Kensuke Baba received the BSc, MSc, and DSc degrees from Kyushu University in 1996, 1998, and 2002. From 2002 to 2003 he was a Research Fellow and from 2003 to 2009 an Assistant Professor in the Faculty of Information Science and Electrical Engineering, Kyushu University. From 2009 to 2015 he was an Associate Professor in the library of Kyushu University. Currently, he is a Research Fellow in the Artificial Intelligence Laboratory, Fujitsu Laboratories. His research interests include data mining, natural language processing, and machine learning. Dr. Baba is a member of the IEEE and IPSJ.

Daisuke Ikeda received his BSc, MSc, and DSc degree in science from Kyushu University in 1994, 1996, and 2004, respectively. He is currently an Associate Professor in the Department of Informatics, Kyushu University. Formerly, he worked at Computer Center, Kyushu University, and Kyushu University Library. His research interests include data analysis, such as data mining and machine learning, and data infrastructure, such as database and information retrieval.
Journal of Web Engineering, Vol. 18 1-3, 207–228.
doi: 10.13052/jwe1540-9589.18136
© 2019 River Publishers