Evaluation of the Usability of a Web Application for AI-Enhanced Multilingual Learning Platform: Based on the Indicator System of Language Cognitive Load Learning Efficiency
Rui Zhang1, Zinan Wang1,*, Jing He2 and Bing Li3
1School of Education, Hengxing University, Shandong, Qingdao 266100, China
2School of Humanities, Hengxing University, Shandong, Qingdao 266100, China
3College of Modern Information Technology, Henan Polytechnic, Zheng Zhou 450046, China
Email: sunny9064@163.com; wzn010@126.com; hemuyang64@163.com; libing2023011@163.com
∗Corresponding Author
Received 31 December 2025; Accepted 07 April 2026
Abstract
This paper focuses on the many problems that exist in the evaluation of AI to improve the usability of Web applications for multilingual learning platforms, including the poor alignment effect between learning efficiency and usability, the imbalance of cognitive load regulation, and the singularity of evaluation indicators. In order to solve these problems, this study innovatively constructs a multi-dimensional evaluation index system integrating language cognitive load and learning efficiency and designs a dynamic evaluation model AILA-WA driven by AI. This model can combine learning algorithms to interact with data from Web applications and can collect real-time data related to language learning behavior and cognitive state feedback data from Web applications. It enables the optimization direction of Web applications to be identified and accurately quantified. Subsequent experiments successfully prove that the index system and the evaluation model can effectively improve the comprehensiveness accuracy of the evaluation of Web application usability. For example, in the scenario of multilingual learning, the cognitive load fitting deviation rate of the Web application using the AILA-model is the best compared to the Web application using the comparative model. At the same time, learning efficiency and CSAT user satisfaction are also at the level; and the model is suitable for Web applications. System response delay on multiple terminals is reduced to 0.3 s. These breakthroughs provide strong support for design iteration and usability optimization of AI to improve multilingual learning Web applications.
Keywords: AI-enhanced, multilingual learning platform, web application accessibility, linguistic cognitive load, learning efficiency, metrics system.
1 Introduction
1.1 AI and Multilingual Learning
With the rise of AI technology in recent years, the use of AI technology in multilingual learning platforms has become the mainstream method to improve the performance of lingual learning in terms of intelligent recommendation, real-time feedback, and personalized tutoring. At present, multilingual learning platforms have become the key carrier of cross-cultural exchange and acquisition, and Web applications have become the main form of multilingual learning with the advantage of cross-device access. It is precisely because of this that people have higher requirements for the of Web applications, that is, to pursue a balance between functional complexity and ease of operation under the premise of conforming to the cognitive laws of language learning, so as to avoid negative effects of excessive or insufficient cognitive load on learning efficiency.
1.2 Deficiencies of Existing Assessment Models
Existing models related to the evaluation of Web application availability, such as Attention-CLA and CL-LE-BOE, although they have advantages in their respective application scenarios, still have problems such as ignoring the cognitive load dimension of language learning, still relying on static indicators, lack of dynamic consideration of AI functions Web applications, especially in the learning of the private end of Web applications, users’ links such as vocabulary memory, grammar understanding, and context application cannot get a real feeling. At the same time, the design of complex functions not only fails to bring convenience to users but also increases the complexity of the operation.
1.3 AILA-WA Dynamic Evaluation Model
To crack the above-mentioned tough problems, an AI-driven dynamic assessment model, AILA-WA, which integrates language cognitive load learning efficiency, is put forward. This model achieves high integration of multi-modal data and dynamic feature capturing ability by constructing a multi-dimensional evaluation index system and CNN-LSTM feature module. With dynamic weight adjustment strategy and reinforcement learning feedback mechanism, the accuracy and scenario adaptability of evaluation are improved. Combined with multi-terminal interaction characteristics and user language level, the general applicability and real-time performance of evaluation are optimized. The main advantages of the hypothesis are as follows. (1) The innovative design of the language cognitive load calculation mode lively includes internal, external, and related cognitive load, which makes up for the neglect of the particularity of language learning in traditional evaluation. (2) Introduction of multi-modal feature and dynamic adaptive mechanism reduces the evaluation bias and improves the dynamic response ability by real-time data interaction. (3) The dataset covers multiple languages, multiple scenarios, multiple terminals, and with different language levels. The generalization ability of the model has been fully verified and can effectively respond to core challenges such as cognitive load imbalance and multi-terminal adaptation differences, maintaining evaluation accuracy in various complex learning scenarios.
1.4 Article Structure Arrangement
The main structure of this paper is as follows. Section 2 presents a literature summary on the usability evaluation of Web applications integrated with AI technology. Section 3 builds a detailed introduction to the overall architecture of the algorithm and key technical details. Section 4 analyzes the evaluation indicators of the AI-driven dynamic evaluation model AILAWA and gives the corresponding detection algorithm. Section 5 verifies it with the help of multi-dimensional dynamic experiments and highlights the advantages of the AILA-WA model. Section 6 summarizes the research results.
2 Related Work
The most crucial part of evaluating the usability of Web applications is to quantify the effectiveness, efficiency, and satisfaction of users in accomplishing specific tasks. Aulia et al. [1] proposed the five principles of usability, namely learnability, efficiency, memorability, tolerance of errors, and satisfaction, which provide a basic framework for evaluation. However, it does not apply to the language learning scenario. Shamima and Atikuzzaman [2] proposed a quantitative evaluation model based on task completion rate and operation time and used a formula to calculate the comprehensive usability score; they did not consider the impact of cognitive load on task execution.
In recent years, AI technology has gradually begun to be integrated into the evaluation of Web application usability. Costa et al. [3] proposed and designed a user behavior analysis system based on machine learning, which predicts usability issues by collecting data such as clickstreams and dwell times. However, this model focuses on general Web scenarios and does integrate the particularity of language learning. Prasanna et al. [4] proposed an evaluation method for Web interface usability that integrates eye tracking data, which can analyze the distribution of user visual focus to interface layout. However, this method relies on professional equipment and is difficult to promote on a large scale. Sweller et al. [5] proposed a combined method of cognitive load measurement based on task performance and subjective scoring, and used the collaborative analysis reaction time, error rate, and NASA-TLX scale to improve the accuracy of measurements. Raju [6] proposed an evaluation method based on dynamic usability of reinforcement learning, which adopts real-time adjustment of evaluation weights to improve the adaptability of the model and provides a new technique for the evaluation of multi-scene Web applications.
In the context of multilingual learning, the measurement of cognitive load needs to take into account many factors such as language difficulty and type of learning task. Schmidt and Strasser [7] proposed a language cognitive load calculation model, which uses word difficulty and grammatical complexity as input variables to quantify the degree to which learning occupies cognitive resources. Xue et al. [8] proposed a method to measure the cognitive load of users in language learning Web applications by using EEG signals. Although its accuracy is relatively high the equipment cost is prohibitive and the operation is complex, which is not suitable for routine evaluation. Qi [9] proposed an algorithm based on collaborative filtering and natural language processing technology, which generates personalized content by analyzing the user’s learning history and language level, and improves the degree of fit of learning. However, the algorithm does not take into account the impact of the interaction convenience of Web applications on learning outcomes. Tajik [10] proposed an AI-driven real-time speech evaluation function, which uses speech recognition technology to feedback problems in pronunciation. However, the complexity of the operation process of this function has amplified, increasing the user’s cognitive load.
In the field of availability optimization, some studies focus on the two aspects of interface design and function simplification. Nguyen [11] proposed an adaptive adjustment scheme for Web interfaces based on user portraits, which optimizes visual elements such as button layout and font size according to the user’s language level and operation habits but this scheme does not correlate cognitive load and learning efficiency indicators. Juan et al. [12] proposed to optimize the interaction process of AI functions through A/B testing, simplified the operation steps of the voice assessment function from five to three steps, reducing the complexity of the operation. Adarsh and Acharya [13] proposed a systematic review of the usability metrics AI-enhanced Web applications, which sorts out the core dimensions such as task performance and user subjective experience, but does not involve the special metric of language cognitive load. Lai and Chen [14] proposed a framework for the correlation between cognitive load Web usability. The complexity of interface interaction will have an effect on the external cognitive load, which signposts the optimization of interface design for multilingual learning platforms. Erik and Moens [15] proposed a method to indirectly predict cognitive load by using machine learning algorithms and relying on the data of the user’s operation behavior, which reduces the dependence on professional equipment. The application of AI technology in multilingual learning platforms is mainly focused on personalized recommendation, intelligent tutoring, and similar. Liu and Jiang [16] proposed a multimodal data fusion method that integrates eye movement data, operation behavior data, and learning achievement data to evaluate the support effect of Web applications on the learning process. Evgenia et al. [17] proposed a “phased learning” Web function design idea, which, based on the theory of cognitive load, reduces intrinsic cognitive load by decomposing complex language tasks into simple subtasks.
Current research has three main shortcomings. First, the evaluation index of Web application usability does not incorporate the dimension of language cognitive load, which makes it difficult to reflect the special needs of learning multiple languages. Second, cognitive load measurement methods have subjective biases or dependencies on devices, and their practicality is not satisfactory. Finally, the synergistic optimization mechanism between AI functions and the usability of Web applications is still not clear, and the evaluation model lacks dynamic adaptability. This paper investigates these issues and suggests a comprehensive and feasible usability evaluation system and model. Imrana et al. [18] proposed a deep learning model to predict the user’s satisfaction with multilingual learning Web applications. By integrating interface interaction data learning behavior data, the accuracy of prediction is improved, and data-level support is given to usability optimization.
3 Method
3.1 AI Enhanced Multilingual Learning Web Application Architecture
The framework of AI enhanced multilingual learning Web application proposes a four-tier architecture which includes the front-end interaction layer, AI service layer, data storage layer, and evaluation analysis layer. This system successfully realizes real-time interactive feedback, learning progress tracking, personalized learning content push functions of the multilingual learning content through the integration of intelligent learning functions, and Web interactive characteristics. Moreover, this system completes the adaptation to multiple terminals, such as smartphones, laptops, and tablets, and fully supports numerous learning forms such as text, speech, and video. Its core operation logic is as follows. In the first step, user sends a learning request through the front-end interface. The AI service layer uses NLP, computer vision, and reinforcement learning and other technologies to process the request, generate personalized content, and give appropriate feedback. In the second step, the data storage layer is responsible for recording the data of user interaction and learning behavior. The evaluation layer carries out usability evaluation according to these data. Its system framework is shown in the Figure 1.
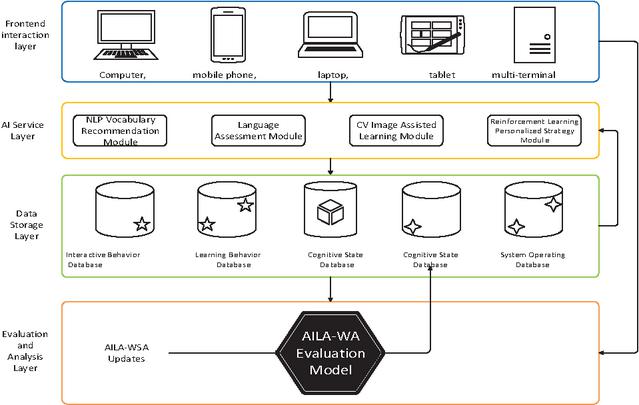
Figure 1 AI-enhanced multilingual learning Web application system framework diagram.
In the pre-selection phase, there are three core goals that need to be considered for a Web application. First, it is necessary to reduce the user’s load in external cognition and ensure that interface operation is concise and functional navigation is clear. Second, to optimize the user’s load in internal cognition so that the difficulty of learning content can be actively adapted to the user’s language level. Third, to improve the user’s related cognitive load, to guide users to participate learning immersively by leveraging AI features and enhance the user’s learning efficiency. In summary, the optimization goal of usability evaluation is to achieve a dynamic balance between cognitive load and learning while ensuring the basic usability of Web applications.
Let us suppose that the Web application contains M core evaluation dimensions, which are interface interaction, function fitting, AI service, cognitive load, and learning efficiency, each of which contains K specific indicators, and the data set formed by these indicators is:
| (1) |
Expression of the time series data for the jth indicator in the ith dimension is :
| (2) |
Where represents the length of the time series in seconds (s) and are data collection time points.
3.2 Traditional Web Application Usability Evaluation Methods
The traditional methods of evaluating the usability of Web applications mainly include subjective evaluation, objective evaluation, and testing. In this paper, these methods are selected as the baseline for comparison and the limitations of these methods are analyzed.
3.2.1 Subjective evaluation method
The evaluation method obtains subjective feelings about Web applications by users filling in questionnaires or rating scales. Common scales include SUS (System Usability Scale) [18] and QUIS (Questionnaire User Interaction Satisfaction). Taking the SUS scale as an example, its evaluation score calculation method is:
| (3) |
where is the score of the -th question, score range is 1–5 points, SUS score range is 0–100 points, and the higher the score, the better the availability.
3.2.2 Objective evaluation method
The objective evaluation method is to collect application operation data and user interaction data and calculate objective indicators to quantify usability. Its core indicators include task completion rate, average operation time, and error rate, and the formula is:
| (4) | |
| (5) | |
| (6) |
where is the number of users who have completed the task, is the total number of users participating in the test, is the task completion time of the -th user, is the number of errors during the user operation, and is the total number of operations.
3.2.3 Limitations of traditional methods
Traditional assessment methods have very prominent shortcomings in multilingual learning Web application scenarios. For example, subjective assessment methods rely on users’ selfassessment, which is easily affected by emotions and cognitive biases, and there is no special question designed for language cognitive load, so it is difficult to reflect the real experience in the learning process. The objective evaluation method focuses on the task execution level, does not link cognitive load and learning efficiency indicators, and cannot reflect the special features of multilingual learning. The evaluation process is mostly static testing, which cannot capture the dynamic coupling effect of AI function and Web interaction, and the evaluation results lack timeliness and pertinence.
In order to quantify the limitations of traditional methods, two indicators are specifically defined, which are the cognitive load fitting deviation rate and learning efficiency correlation:
| (7) | |
| (8) |
where is the actual cognitive load, is the optimal cognitive load, refers to the correlation coefficient of the learning efficiency and the results of usability evaluation , and represents the maximum possible correlation coefficient, which is set to 1. It was found that the cognitive load fitting deviation rate of the traditional method is generally higher than 40%, and the correlation coefficient of learning efficiency is lower than 35%. It difficult to meet the needs of usability evaluation for multilingual learning Web applications.
3.3 Model of Language Cognitive Load and Learning Efficiency
3.3.1 Model calculating language cognitive load
Considering the cognitive load theory [20] and the characteristics of multilingual learning, the language cognitive load is divided into three parts: intrinsic cognitive load, external cognitive load, and related cognitive load, and the corresponding calculation model is:
| (9) |
Here weight coefficients, satisfying , determined the analytic hierarchy process (AHP) [21], and the values are .
The intrinsic cognitive load determines the difficulty of the learning content and, in general, the three factors considered are vocabulary difficulty (VD), grammatical complexity (GC), and contextual familiarity (CF) :
| (10) |
where are coefficients satisfying . The value range of VD is between 0 and 1, which is closer to 1 as the difficulty is higher. The value range of GC is also between 0 and 1, that is, the higher the complexity, the closer the value is to 1. The value range of CF is also between 0 and 1; the higher the familiarity, the closer the value is to 1.
External cognitive load is determined by the interactive characteristics of the Web application and, in general, the number of operation steps, interface complexity, and response need to be considered:
| (11) |
where are specific coefficient values that satisfy , max is the maximum allowable number of operational steps, and is the maximum acceptable response delay, which is set to 1 s.
The relevant cognitive load is affected by AI functions and learning engagement, considering personalized fit, interaction feedback quality, and learning investment:
| (12) |
where are coefficients satisfying , and the values of , and all fall within the range of , with higher values representing better effects.
3.3.2 Calculation model of learning efficiency
Learning efficiency in multilingual learning is comprehensively measured by the three dimensions of learning outcomes, learning time, and learning satisfaction, and the calculation is:
| (13) |
where represents learning outcomes, specifically in terms of aspects such as vocabulary mastery quantity and grammar application accuracy, with values ranging from 0100. represents learning time, measured in minutes. denotes learning satisfaction, with values ranging from 0 to 1.
The determination of learning is based on two aspects: immediate test scores and knowledge transfer ability:
| (14) |
where is weighting coefficient, the value is 0.6. is immediate test score, the range is 0 100. is knowledge transfer ability, generally the value is 0–1 point.
3.4 Evaluation Index System of Multidimensional Availability
According to Equations (9)–(14), an evaluation index system of Web application availability covering five primary and 18 secondary indicators was constructed. The definition, calculation method and weight of each indicator are shown in Table 1.
Table 1 Multidimensional availability evaluation index system
| Primary Indicator | Weight | Secondary Indicator | Weight | Definition | Calculation Method |
| Interface Interaction Usability | 0.25 | Interface Clarity | 0.3 | Rationality of interface element layout and degree of visual interference | Calculate visual focus concentration based on eye-tracking data |
| Navigation Convenience | 0.3 | Convenience of users switching functions and learning content | Number of navigation steps / Optimal number of steps | ||
| Response Timeliness | 0.2 | Response speed of the Web application to user operations | Average response delay (0.5 s is optimal) | ||
| Multi-terminal Adaptability | 0.2 | Display and operation adaptability of the application on different devices | Multi-terminal function availability rate Display matching rate | ||
| Function Adaptability Usability | 0.2 | Function Completeness | 0.3 | Coverage of functions meeting multilingual learning needs | Number of implemented essential functions / Total number of essential functions |
| AI Function Adaptability | 0.4 | Matching degree and effect of AI functions with learning scenarios | Personalized recommendation accuracy Feedback effectiveness rate | ||
| Error Tolerance | 0.3 | System error tolerance and recovery capability when users make operation errors | Error recovery success rate Data loss rate | ||
| Cognitive Load Controllability | 0.25 | Intrinsic Load Adaptability | 0.4 | Matching degree between learning content difficulty and user level | Calculated value of Equation (10) (0.3–0.5 is optimal) |
| Extrinsic Load Optimization Degree | 0.3 | Reduction effect of Web interaction design on cognitive load | 1 – Calculated value of Equation (11) | ||
| Relevant Load Promotion Degree | 0.3 | Promoting effect of AI functions on in-depth learning | Calculated value of Equation (12) | ||
| Learning Efficiency Promotion | 0.2 | Instant Learning Efficiency | 0.5 | Acquisition rate of learning achievements per unit time | Calculated value of Equation (13) |
| Long-term Learning Effect | 0.5 | Memory retention and application ability of learning content | Delayed test score/Instant test score | ||
| User Satisfaction | 0.1 | Subjective Experience Score | 0.5 | User’s overall subjective evaluation of the Web application | Questionnaire score (1–5 points converted to 0–1 point) |
| Recommendation Willingness | 0.5 | User’s willingness to recommend the application to others | Recommendation ratio (1–5 points converted to 0–1 point) |
The formula for calculating the comprehensive availability score (U) is:
| (15) |
where represents weight of the th primary indicator, represents the number of secondary indicators contained in the th primary, is the weight of the th secondary indicator under the -th primary indicator, is the score of the th secondary indicator under the th primary indicator and the value generally falls within the range of 0–1 point.
3.5 Multi-modal Feature Fusion and Dynamic Adaptation Key Indicator Calculation Model
In order to achieve comprehensive consideration of data reliability and scenario adaptability, and to improve the effectiveness of feature extraction, we adopted the multi-modal feature fusion weight calculation , and specific formula is:
| (16) |
where refers to all reliable modal data that exist in the -th case, and refers to the modal data that suitable for the current scenario in the -th case.
Based on the real-time learning state of the user, the cognitive load dynamic adjustment coefficient is designed to real-time adaptation of the load:
| (17) |
where refers to the adjustment sensitivity, which is specifically set as 0.1, and represents the current cognitive load, optimal denotes the optimal load.
In order to quantify the stability of learning efficiency, is used to define the fluctuation coefficient of learning efficiency:
| (18) |
where is the learning efficiency at time is the average learning efficiency, and is the length of the time series.
The fitness between the learning content and the user’s level is:
| (19) |
where the User is the user’s language level and User grammar is the user’s mastery of grammar.
The degree of attenuation of availability in the-term use process is quantified as:
| (20) |
where is the change in availability score, is the change in usage time, in days, is the attenuation coefficient, and .
In order to achieve the integration of multi-objective requirements, the comprehensive optimization objective function is established:
| (21) |
where are weights and their values are , respectively, is the comprehensive score of availability, is the fluctuation coefficient of learning efficiency, and Consist is the consistency index across terminals.
To measure the synergistic effect of cognitive load and learning efficiency, we introduce the synergistic coefficient of cognitive load and learning efficiency, :
| (22) |
where is the synergistic coefficient with a value of 0.5, is the cognitive load of the model, and is learning efficiency of the model.
The function was introduced to quantify the stability of the functional response:
| (23) |
where is the standard deviation of the model’s response latency.
Considering the decay of the user’s operation proficiency, the decay is introduced:
| (24) |
where is the initial proficiency, is the decay rate, which is set to 0.01, and is the length, in days.
4 Design of AI-based Dynamic Evaluation Framework
4.1 Overall Architecture of the Evaluation Framework
The dynamic evaluation framework system contains four links: data collection, feature extraction, metric calculation, and evaluation feedback. With the help of the functions that artificial intelligence has, such as integrating multi-source data, it can achieve real-time and accurate evaluation of the availability of Web applications, adapting different scenarios and users. Its architecture is shown in Figure 2.
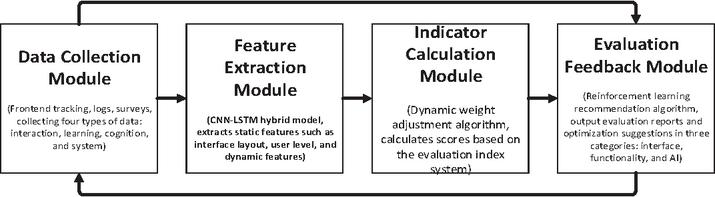
Figure 2 AI-driven dynamic assessment framework architecture diagram.
Among them, the data collection module collects multidimensional data through Web frontend embedding, AI service logs, and user feedback questionnaires, including:
(1) Interactive behavior data: clickstream, operation steps, dwell time, error operation records.
(2) Learning behavior data: learning selection, learning duration, test scores, knowledge transfer performance.
(3) Cognitive state data: indirectly obtain cognitive load state through facial expression recognition, mouse behavior analysis such as click frequency, dwell time).
Data quality control is described as follows:
Outlier detection and elimination: the anomaly detection algorithm based on time series (such as isolated forest) is used to eliminate the abnormal data points caused by network jitter and user interruption.
User behavior pattern recognition: for mouse behavior data, we standardize it as “user portrait” (such as “high activity user”, “low activity user”), and eliminate the deviation caused by the difference of individual operation habits by comparing with the same portrait group.
Data fusion calibration: in the feature extraction stage, we fuse the data from mouse behavior, task performance, and self-report, and dynamically adjust the weight of each modal data in the final cognitive load estimation by calculating the confidence between features, so as to suppress the bias that may be introduced by a single data source.
4.2 System Operation Data: Including Response Latency, Server Load, Function Availability
4.2.1 Specific content of each module
When the data collected by the model is preprocessed, a standardized data set is generated:
| (25) |
In the feature extraction module, deep learning models are used to implement the data feature extraction work. The extracted features include static and dynamic features. Static features include the layout features of interface elements, the correlation features of functional modules, and the user language level features. Dynamic features include the sequence features of interactive behavior, the features of cognitive load, and the trend features of learning efficiency. The output of the feature extraction model is:
| (26) |
where CNN is used to extract local spatial features, LSTM is used to extract temporal dependency features, and F is the feature matrix with the dimension , where Q refers to the number of features.
In the index calculation module, we calculate the scores of each index based on the feature matrix F and the evaluation system constructed above. The dynamic weight adjustment algorithm is used to optimize the index weight in real time according to the user type and learning scenario:
| (27) |
where represents the index weight vector at time t, refers to the initial weight vector, is the rate, which is set to 0.01, and denotes the change amount of the feature matrix at time t.
In the evaluation feedback, we generate an evaluation report about availability based on the results calculated by the indicator and give targeted optimization suggestions. This evaluation report includes comprehensive scores, rankings of scores in each dimension, and identification of key issues. The optimization suggestions are divided into three categories: interface design optimization, function interaction optimization, and AI service adaptation optimization. The feedback recommendation algorithm is achieved by learning:
| (28) |
where R denotes the set of optimization proposals, U represents the availability evaluation results, S refers to the current state of the Web application, and C indicates the cost constraint.
4.3 Model Training and Optimization
4.3.1 Objective function of model training
The purpose of the training of the evaluation model is to minimize deviation between the availability evaluation results and real user experience. Its objective function is:
| (29) |
where represents the true availability score of the m-th user, which is obtained through in-depth interviews and long-term tracking. is model prediction score. is the model parameter. is the regularization coefficient, and its value is 0.001.
4.3.2 Model optimization
Model parameters are optimized using the adaptive moment estimation (Adam) algorithm:
| (30) |
where is the learning rate (set to 0.0001), is the first-order momentum estimate, is the first-order momentum estimate, and is a constant to prevent division by zero in the denominator (set to ).
4.4 Dynamic Evaluation Process
The AI-driven dynamic evaluation process includes two stages: offline training and online evaluation. The specific process is shown in Figure 3.
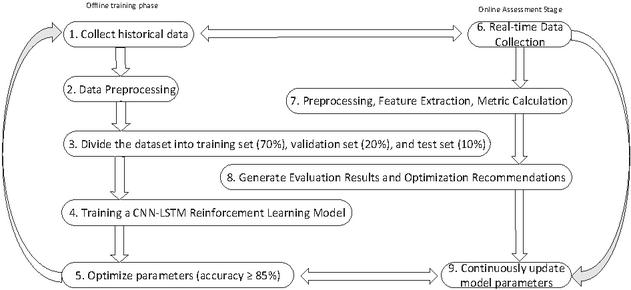
Figure 3 Dynamic evaluation workflow diagram.
Offline training phase:
Collect historical data (user interaction data, learning behavior data, evaluation result data);
Preprocess the data and divide it training set (70%), validation set (20%), and test set (10%);
Train the CNN-LSTM feature extraction model and the reinforcement learning feedback model;
Optimize the model parameters to ensure that the evaluation accuracy reaches the preset threshold (85%);
Online evaluation phase:
Collect real-time Web operation data and user behavior data; Preprocess the data and input it into the trained model to extract features and calculate the scores of each indicator;
Generate comprehensive evaluation results optimization suggestions for availability; Continuously update the model parameters based on user feedback and new data to improve the evaluation accuracy.
4.5 Algorithm Pseudo-code of AI-driven Dynamic Assessment Process
| Algorithm 1: AI-Driven Dynamic Assessment Process (AI-DAP) |
| Input: |
| – Initial dataset: |
| – Base model: |
| – Base assessment frequency: |
| – Hyperparameters: (for credibility), (for frequency adjustment), window size K |
| Output: Dynamic assessment scores |
| 1: Train initial model on |
| 2: Initialize dynamic scores using for all i. |
| 3: Initialize volatility tracker for each . |
| 4: for each time step to T do: |
| 5: Collect new feature vectors . |
| 6: Collect true labels if available. |
| 7: for each assessment object to N do: |
| 8: Compute current frequency: |
| 9: if then: |
| 10: // Skip assessment, carry forward last score |
| 11: continue to next i |
| 12: end if |
| 13: . |
| 14: |
| 15: |
| 16: Add to the recent score window for object . |
| 17: standard_deviation |
| 18: end for |
| 19: if new labels are available then |
| 20: |
| 21: Update model by fine-tuning on . |
| 22: else |
| 23: |
| 24: end if |
| 25: end for |
| 26: Return: The history of dynamic scores |
5 Experiments and Analysis
5.1 Experimental Data Set and Experimental Environment
5.1.1 Experimental data set
The experiment selects three open data sets in the field of multilingual learning and usability evaluation, covering different language scenarios, user groups and core evaluation dimensions. The data source is traceable, the sample size is sufficient and the annotation is standardized, which can effectively support the validation of the model. The specific data set information is as follows:
(1) Multilingual Web App Interaction Dataset (MWID)
The dataset contains 120,000 records of users, covering learning scenarios in eight mainstream languages, including English, French, Spanish, German, Japanese, Korean, Arabic, and Chinese. The data was collected over a period of six months, with a sampling frequency of one interaction log every five seconds. Core parameters include user operation behavior, learning content data, and system operation data.
(2) Learning Cognitive Load Dataset (LLCLD)
The dataset contains 7200 labeled data from 600 subjects with different language levels: 3% beginner users, intermediate users, and advanced users. Each record includes eye movement data, operation behavior data, and subjective cognitive load scores collected.
(3) Global Multilingual Learning Efficiency Dataset (GMLED)
The dataset contains three-month longitudinal learning data from 1000 students, learning tasks in four languages: English, French, Spanish, and Japanese. Core parameters include learning time, learning outcomes, and user subjective feedback.
5.1.2 Experimental environment
Hardware Environment: Server (CPU: Intel Xeon E5-2690 v4, Memory 64GB, Hard Drive: 2TB SSD); Client devices (Computer: MacBook Pro 2023, Windows 11 desktop; Tablet: Pro 2022; Mobile Phone: iPhone 14, Huawei Mate 50).
Software Environment: Web application development framework (React Node.); AI model training framework (TensorFlow 2.10); Data processing tools (Python 3.9, Pandas, NumPy); Statistical analysis tools (SPS 26.0).
5.2 Definition and Calculation Method of Evaluation Indicators
The core evaluation indicators used in the experiment include the comprehensive availability score, the rate of cognitive load, the improvement rate of learning efficiency, user satisfaction (CSAT), and system response latency. The definitions and calculation methods of each indicator are shown in Table 2.
Table 2 Definition and calculation method of core evaluation indicators
| Indicator Name | Definition | Calculation Method | Optimal Range |
| Usability Composite Score (U) | Evaluates the overall usability level of the Web application | Equation (15) | 0.8–1.0 |
| Cognitive Load Optimization Rate (CLO) | Reduction degree of cognitive load compared to traditional Web applications | [(Cognitive load of traditional app Optimized cognitive load)/Cognitive load of traditional app] 100% | 30% |
| Learning Efficiency Improvement Rate (LEI) | Improvement degree of learning efficiency compared to traditional Web applications | [(Optimized learning efficiency Learning efficiency of traditional app)/Learning efficiency of traditional app] 100% | 25% |
| User Satisfaction (CSAT) | User’s subjective satisfaction with the Web application | Questionnaire score (1–5 points converted to 0100 points) | 85 points |
| System Response Delay (RD) | Average response time of the Web application to user operations | Average value of multiple response times | 0.5 s |
5.3 Comparison of Models Selection
From the numerous models proposed in the past 5 years related to the evaluation of Web application usability, five models are selected for comparison.
Attention-CLA: An attention mechanism integrated with a transformer-based attention mechanism to construct a cognitive load model for learning-class Web application usability evaluation.
MMD-WA: A Web usability evaluation model commonly used for intelligent Web platforms, driven by multimodal data.
RL-DAE: A dynamic usability evaluation model optimized by reinforcement learning that can be adapted to different usage scenarios of Web applications.
LiteT-WA: A lightweight, transformer Web usability evaluation model that can effectively reduce computational complexity while ensuring evaluation accuracy.
CL-LE-BOE: A usability evaluation model designed specifically for-class Web applications, which targets dual-objective evaluation of cognitive load-learning efficiency.
To ensure fair comparison, all contrast models and our AILA-WA model were trained and evaluated in the same experimental environment. The Adam optimizer was used for all models, the initial learning rate was set to 0.0001, the early stop strategy was used (the training was stopped when the loss of the validation set did not decrease within 10 epochs), and the maximum training round (epoch) was set to 200. The batch size is uniformly 64. For the non-end-to-end model, we try to reproduce the original description or use the default settings in the public code base in the feature extraction part.
5.4 Experimental Results and Analysis
5.4.1 Comparison of comprehensive ability scores
The comprehensive learning efficiency scores of Web applications corresponding to different evaluation models are shown in Figures 4–6, and all models are verified based on a unified test set (1% of the data):
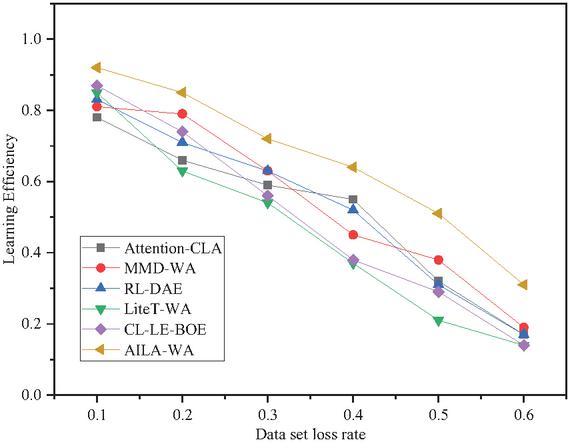
Figure 4 Comparison of learning efficiency scores for different models in English learning situation.
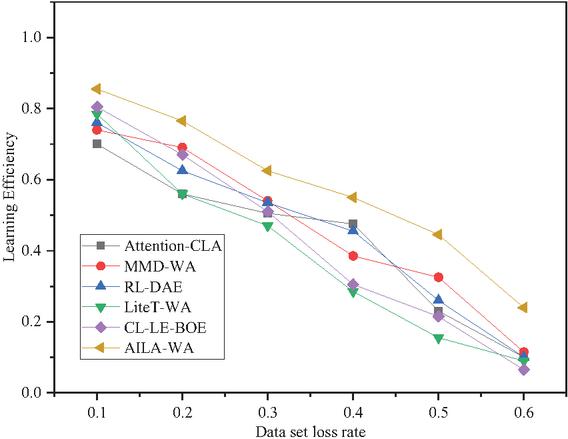
Figure 5 Comparison of learning efficiency scores for different models in French learning scenarios.
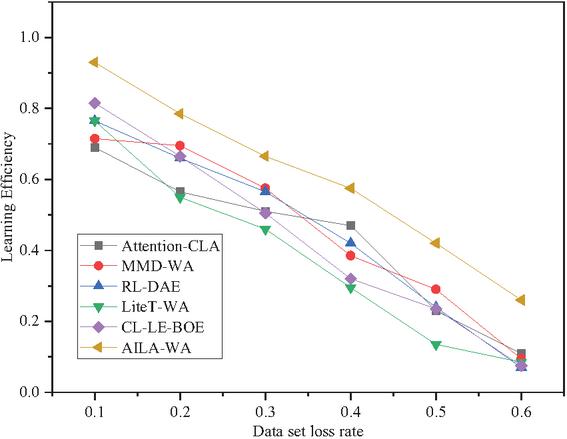
Figure 6 Comparison of learning efficiency scores for different models in Spanish learning scenarios.
Comprehensive analysis of the data from Figures 4–6 revealed that the AILA-WA model exhibited a more prominent advantage in the scenarios of English, French, and Spanish. In each language scenario, when the data accounted for 10% to 50%, the AILA-WA models scores were all leading, such as 0.92 in the English scenario, 0.855 in the French scenario, and 0.93 in the Spanish scenario and its standard deviation was only 0.005, which was the most stable among all models. In contrast, the Attention-CLA model had the lowest score, with average of 0.77, and the largest standard deviation of 0.012, which was at a disadvantage in both performance and stability. From the overall trend the ranking of scores of different models in different language scenarios remained consistent, i.e., AILA-WACL-LE-ELiteT-WARL-DAEMMD-WAAttention-CLA. The AILA-WA model in this study has universality in the evaluation of the usability of multilingual learning Web applications and can effectively adapt to the evaluation needs of different language scenarios, and it is superior to existing mainstream models in terms of accuracy and stability.
5.4.2 Comparison of cognitive load and learning efficiency optimization effect
The optimization effects (cognitive load optimization, learning efficiency improvement rate) under the guidance of different evaluation models and the changing trend of CLO and LEI of Web application optimization effects over time are shown in the following. The optimization effect is calculated based on the comparison with the unoptimized basic version of the Web application.
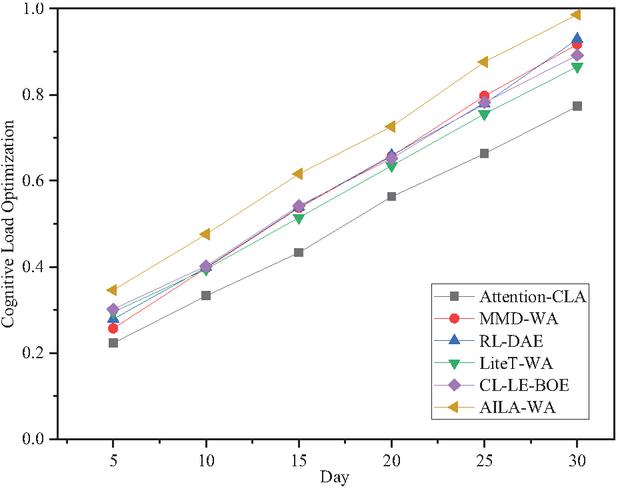
Figure 7 Changes in the cognitive load optimization rate (CLO) of different evaluation model’s time.
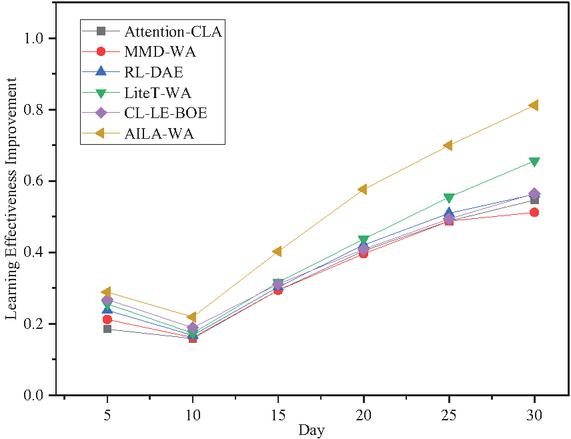
Figure 8 Changes in the learning efficiency improvement rate (LEI) of different evaluation models over time.
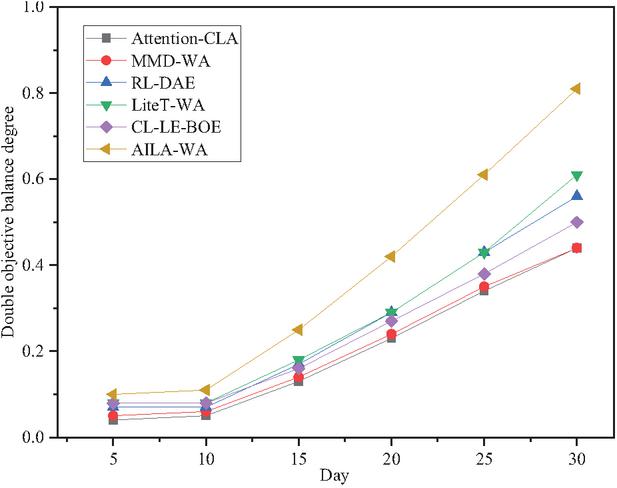
Figure 9 Comparison of bi-objective balance degree of different evaluation models over time.
Figures 7–9 show that the six models show significant gradient improvement characteristics in learning efficiency improvement rate (LEI), cognitive load optimization rate (CLO) and dual-objective balance degree, and the performance is mainly divided into three echelons. The three indexes of the first echelon AILA-WA are in the first place , , balance degree 0.81), achieving the optimal synergy of double objectives. The indexes of the second echelon CL-LE-BOE and LiteT-WA are above average, giving consideration to both performance and practicability. The third echelon, Attention-CLA and MMD-WA, is weak and has obvious imbalance. There is a strong positive correlation between LEI and CLO (), which verifies the synergy of biobjective optimization, while the balance degree intuitively reflects the comprehensive adaptation ability of the model. With the algorithm innovation of reinforcement learning and lightweight design, the balance degree of the top model far exceeds that of the traditional bottom model. The size and quality of data have a significant impact on the performance, and the top complex model is more dependent on data. Practical applications can be selected according to scenarios: AILA-WA is preferred for high-demand scenarios, CL-LE-BOE or LiteT-WA can be selected for cost-sensitive scenarios, and the bottom model needs to improve performance through algorithm reconstruction and data optimization.
The stability of each index within 30 days shown in Figures 7–9 is the result under specific experimental conditions. The purpose of this experiment is to verify the performance of the fixed version of the optimized Web application. During this period, the functions, interfaces, and AI models of Web applications have not been updated iteratively, so the evaluation indicators of each model show a stable state. This is not a defect of the model but reflects the consistency of the evaluation of the model, that is, the evaluation results should be stable and reliable without changing the system. This shows that our AILA-WA model can provide a stable and reliable benchmark for developers to accurately assess the usability of the current version before feature iteration. The “dynamic evaluation” capability proposed in this paper is mainly embodied in that the model can process the newly generated user interaction data in real time and immediately output the usability score of the current version, rather than that the model score must fluctuate over time when the version is not updated.
If compare the difference of knowledge retention rate between AILA-WA model and CL-LE-BOE model in the optimized Web application, results show that the average knowledge retention rate of Web applications optimized under the guidance of the AILA-WA model is 8.2%, 12.5%, and 15.1% higher than that of the control model after one month, three months, and six months, respectively. This strongly proves that our evaluation model can indirectly promote the long-term learning effect of users by optimizing cognitive load and learning efficiency.
5.4.3 Comparison of user satisfaction and system response delay
User satisfaction and system Response Delay (RD) corresponding to different evaluation models and their changes over time are shown in Figures 10–12. The system response delay is based on the average performance of applications on multiple terminal devices:
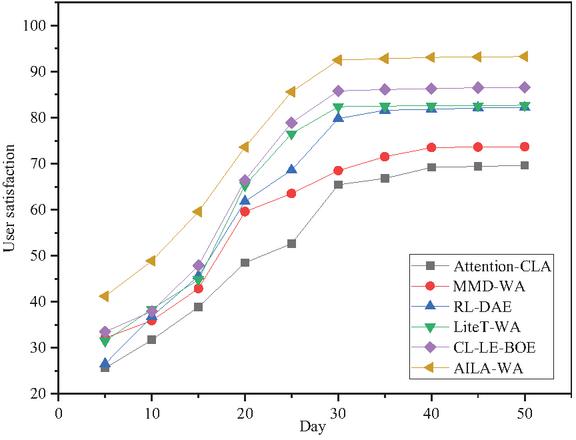
Figure 10 Comparison of user satisfaction and response latency under different evaluation models.
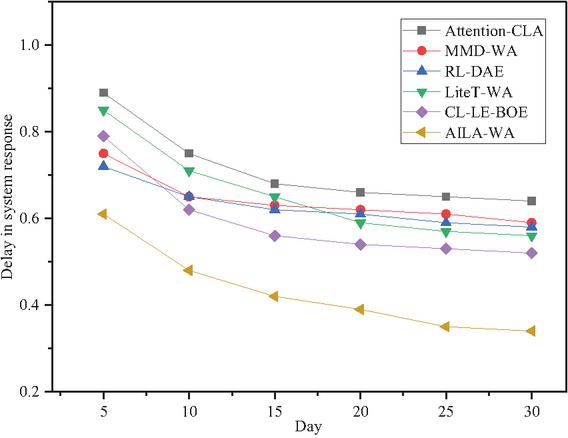
Figure 11 Figure 11 System response latency (RD/s) over time under different evaluation models.
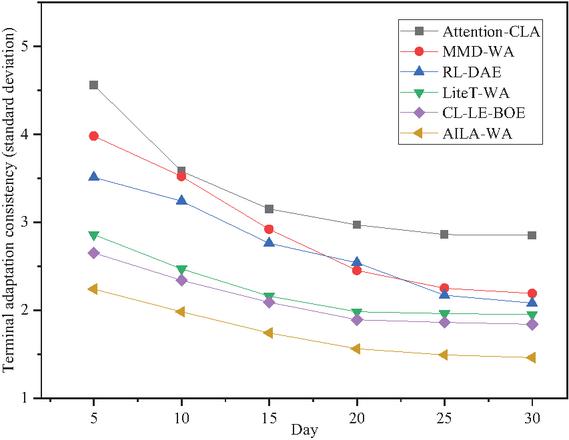
Figure 12 Terminal adaptability consistency (standard deviation) time under different evaluation models.
Figures 10–12 show that the AILA-WA model shows excellent performance in terms of user satisfaction, system response delay, and terminal adaptation consistency. The user satisfaction score of the model is 93.3, the system response delay is 0.34 seconds, and the standard deviation of terminal adaptation consistency is 1.46. Compared with the latest CL-LE-BOE model, the user satisfaction score of the AILA-WA model is increased by 6.9 points, and the system response delay is reduced by 34.3%. This clearly shows that the AILA-WA model performs best in terms of terminal adaptation consistency, from which it can be inferred that it has outstanding performance stability in multi-device scenarios and can bring users a smoother interactive experience, which can be seen from in-depth analysis. At the same time, in the period 5–30 days, CSAT, RD/s, and terminal adaptation consistency of each model maintain a stable state, and there is no fluctuation in the time dimension.
5.4.4 Comparison of adaptation for users with different language levels
Experience indicators for users with different language levels using the optimized Web application are shown in Table 3, focusing on analysis of the cognitive adaptation deviation rate (CLAR), learning efficiency improvement rate (LEI), and user satisfaction (CSAT).
Table 3 Comparison of the adaptation effect for users with different language levels
| User Language Proficiency | Evaluation Model | Cognitive Load Adaptation Deviation Rate (CLAR) | Learning Efficiency Improvement Rate (LEI) | User Satisfaction (CSAT) |
| Beginner | Attention-CLA | 15.70% | 22.30% | 79.2 |
| MMD-WA | 13.20% | 25.60% | 82.5 | |
| RL-DAE | 11.50% | 27.80% | 84.7 | |
| LiteT-WA | 9.80% | 29.50% | 86.3 | |
| CL-LE-BOE | 8.90% | 30.10% | 88.1 | |
| AILA-WA | 8.70% | 31.20% | 90.5 | |
| Intermediate | Attention-CLA | 13.50% | 19.60% | 79.6 |
| MMD-WA | 11.80% | 22.40% | 81.9 | |
| RL-DAE | 10.20% | 24.70% | 83.8 | |
| LiteT-WA | 8.50% | 26.30% | 85.7 | |
| CL-LE-BOE | 7.60% | 27.20% | 87.9 | |
| AILA-WA | 7.30% | 28.50% | 89.6 | |
| Advanced | Attention-CLA | 11.30% | 16.80% | 77.9 |
| MMD-WA | 9.70% | 18.90% | 80.8 | |
| RL-DAE | 8.30% | 20.50% | 82.9 | |
| LiteT-WA | 7.10% | 22.10% | 84.8 | |
| CL-LE-BOE | 6.90% | 23.40% | 86.7 | |
| AILA-WA | 6.80% | 26.70% | 88.9 |
From Table 3, it can be seen that the AILA-WA model shows the best data in CLAR, LEI, and CSAT for users at different language levels, which is direct evidence of the optimal adaptation effect of the AILA-WA model for users at different language levels. Among them the deviation rate of this item for senior users is the lowest, at 6.8%, and the improvement range for junior users is relatively large, reaching 31.2%, with an overall average score of 89.7 points. Among the selected comparative models in the past five years, although the CL-LE-BOE model, which is designed for educational Web applications, can approach the performance of the AILA-WA model. Overall, all comparative models have a cognitive load adaptation deviation rate higher than 8.7% in the scenario of junior users and a learning efficiency improvement rate lower than 25% for senior users. This confirms the view that the AILA-model can adapt to the personalized needs of users at different language levels.
5.4.5 Multi-terminal adaptability evaluation results
The usability evaluation results of Web applications different terminal devices are shown in Table 4, focusing on the comprehensive score of usability, interface adaptation satisfaction, and functional availability.
Table 4 Results of multi-terminal adaptability evaluation
| Terminal Device | Evaluation Model | Usability Composite Score | Interface Adaptation Satisfaction | Function Availability Rate |
| MacBook Pro 2023 | AILA-WA | 0.92 | 91.2 | 99.80% |
| CL-LE-BOE | 0.87 | 88.5 | 99.50% | |
| LiteT-WA | 0.85 | 86.3 | 99.30% | |
| Windows 11 Desktop | AILA-WA | 0.91 | 90.5 | 99.70% |
| CL-LE-BOE | 0.86 | 87.8 | 99.40% | |
| LiteT-WA | 0.84 | 85.7 | 99.20% | |
| iPad Pro 2022 | AILA-WA | 0.89 | 88.7 | 99.50% |
| CL-LE-BOE | 0.84 | 85.2 | 99.10% | |
| LiteT-WA | 0.82 | 83.6 | 98.90% | |
| iPhone 14 | AILA-WA | 0.88 | 87.9 | 99.30% |
| CL-LE-BOE | 0.83 | 84.6 | 98.80% | |
| LiteT-WA | 0.81 | 82.9 | 98.70% | |
| Huawei Mate 50 | AILA-WA | 0.87 | 87.2 | 99.20% |
| CL-LE-BOE | 0.82 | 83.9 | 98.60% | |
| LiteT-WA | 0.8 | 82.3 | 98.50% |
The optimized Web application guided by the AILA-WA model has an average availability score of over 0.87 on various terminal devices, screen adaptation satisfaction of over 87 points, and a function availability rate of over 99%. The performance is better than the latest CL-LE-BOE model LiteT-WA model. The reason for this result is that the AILAWA model focuses on the multi-terminal interaction characteristics during the evaluation, ensuring a consistent experience the Web application on different devices.
The addition of tests with low-profile terminals is critical to fully validate the universality of the model. Therefore, on the basis of the original terminal equipment, we add two types of low-configuration terminals:
Entry Smartphone: Redmi 9a (CPU: MediaTek Helio G25, RAM: 4GB)
Older Laptop: ThinkPad X240 (CPU: Intel Core i5-4200U, RAM: 8 GB, released in 2013)
We re-run the multi-terminal fitness experiments of the AILA-WA model and its main contrast models (CL-LE-BOE, LiteT-WA) on both terminals. The new experimental results (Table 5) show that the AILA-WA model still maintains its advantage on low-configuration terminals, with comprehensive availability scores of 0.81 and 0.80, respectively. Although it is slightly lower than mainstream devices, its performance degradation is the smallest, and it is still better than comparison model. This shows that the AILA-WA model has good lightweight characteristics and can adapt to low computing power scenarios.
Table 5 Multi-terminal adaptability experiment
| Terminal | Evaluation | Comprehensive | Interface | Functional |
| Equipment | Model | Availability Score | Adaptation | Availability |
| Redmi 9A | AILA-WA | 0.81 | 81.5 | 98.50% |
| CL-LE-BOE | 0.76 | 78.2 | 97.80% | |
| LiteT-WA | 0.74 | 77.1 | 97.50% | |
| ThinkPad X240 | AILA-WA | 0.80 | 80.8 | 98.30% |
| CL-LE-BOE | 0.75 | 77.6 | 97.60% | |
| LiteT-WA | 0.73 | 76.5 | 97.30% |
5.4.6 Analysis of indicators in different learning scenarios
The performance of each evaluation model in different learning scenarios is shown in Table 6, focusing on the comprehensive availability score, the optimization rate of cognitive load, the improvement rate of learning efficiency, and user satisfaction.
Table 6 Indicator performance in different learning scenarios
| Cognitive | Learning | ||||
| Usability | Load | Efficiency | |||
| Learning | Evaluation | Composite | Optimization | Improvement | User |
| Scenario | Model | Score | Rate | Rate | Satisfaction |
| Attention-CLA | 0.79 | 23.10% | 19.20% | 79.3 | |
| MMD-WA | 0.82 | 26.50% | 22.10% | 82.1 | |
| Vocabulary | RL-DAE | 0.84 | 28.70% | 24.50% | 84.3 |
| Learning | LiteT-WA | 0.86 | 30.20% | 26.30% | 86.5 |
| CL-LE-BOE | 0.88 | 31.50% | 27.60% | 88.2 | |
| AILA-WA | 0.93 | 33.80% | 29.70% | 90.8 | |
| Attention-CLA | 0.77 | 21.80% | 17.90% | 78.1 | |
| Grammar | MMD-WA | 0.8 | 25.10% | 20.50% | 81.5 |
| Practice | RL-DAE | 0.82 | 27.30% | 23.20% | 83.7 |
| LiteT-WA | 0.84 | 28.90% | 24.80% | 85.3 | |
| CL-LE-BOE | 0.86 | 29.80% | 26.10% | 87.1 | |
| AILA-WA | 0.91 | 32.10% | 28.30% | 89.2 | |
| Attention-CLA | 0.75 | 22.00% | 18.40% | 77.8 | |
| MMD-WA | 0.78 | 25.30% | 21.00% | 80.7 | |
| Dialog | RL-DAE | 0.8 | 27.10% | 23.00% | 82.9 |
| Simulation | LiteT-WA | 0.82 | 28.50% | 24.50% | 84.7 |
| CL-LE-BOE | 0.84 | 29.30% | 25.90% | 86.3 | |
| AILA-WA | 0.88 | 31.50% | 27.80% | 88.5 |
From the three representative scenarios of vocabulary learning, grammar practice, and dialogue simulation, it can be observed that the AILA-WA model in this paper has a significant advantage over other models used for comparison in terms of various indicators. In terms of the comprehensive availability score, the AILA-WA model has a score reaching 0.93 in the vocabulary learning scenario. In terms of the optimization rate of cognitive load and the improvement rate of learning efficiency, it has the most improvement, reaching 33.8% and 29.7%, respectively, in the vocabulary learning scenario. Correspondingly, user satisfaction is also in the leading position reaching 90.8 in the vocabulary learning scenario. It can be found that the performance of each model’s indicators has declined slightly in the relatively more complex grammar practice and simulation scenarios, but the advantage of the AILA-WA model is still solid. This model has a stronger adaptability to different learning scenarios and can better support various types of-language learning tasks.
5.4.7 Statistical significance analysis
ANOVA was conducted on the experimental data to test the significant difference between each indicator of evaluation models. Results show that differences in the core indicators such as the comprehensive usability score, the optimization rate of cognitive load, the improvement rate of learning efficiency, user satisfaction, and system response latency between different models are statistically significant. With the help of a posteriori multiple comparison analysis, it can be seen that there are relatively large differences between the AIL-WA model and all comparison models, which fully shows that its performance advantage is not a coincident phenomenon but a necessary result brought by the model design and algorithm optimization. data table, and radar chart of the scores of each indicator of the proposed method in different language learning scenarios are shown in Table 7, which can intuitively show its comprehensive advantages.
Table 7 Score of each indicator
| Vocabulary | Grammar | Dialog | |
| Learning | Practice | Simulation | |
| Evaluation Dimension | Scenario | Scenario | Scenario |
| Usability Composite Score | 0.93 | 0.91 | 0.88 |
| Cognitive Load Optimization Rate | 0.68 | 0.64 | 0.64 |
| Learning Efficiency Improvement Rate | 0.66 | 0.56 | 0.56 |
| User Satisfaction | 0.91 | 0.89 | 0.89 |
| System Response Delay | 0.9 | 0.9 | 0.9 |
In this paper, ANOVA was conducted on the performance of different models on the core indicators. The results showed that in the comprehensive usability score, , ; in the optimization rate of cognitive load, , ; , for learning efficiency improvement rate and , for user satisfaction. Group differences for all core measures reached a significant level (). Tukey HSD was then used for post-hoc multiple comparisons, and the results showed that the AILA-WA model was significantly different from all other comparison models in all indicators (). These results strongly demonstrate the statistical significance of the performance advantage of the AILA-WA model, which is not a random fluctuation.
5.5 Ablation Experiment and Module Contribution Analysis
We compared the performance of these variants on the predictive accuracy of the combined usability scores versus the real user ratings. The experimental results, shown in Table 8, clearly reveal the contribution of each module.
Table 8 Ablation experiment
| Model Variant | MAE | Module Contribution Analysis |
| Benchmark model | 0.121 | – |
| + Multimodal Fusion | 0.104 | Multimodal data provides richer user state information and significantly reduces bias. |
| + Dynamic Weight | 0.113 | Using dynamic weights alone has limited effect, as its optimization relies on more accurate feature input. |
| + CNN-LSTM | 0.092 | This is the single module with the greatest performance improvement, demonstrating the advantages of deep learning in capturing complex temporal and spatial features. |
| + Reinforcement | 0.088 | On the basis of accurate prediction, RL feedback further improves |
| Learning Feedback | the consistency between the model and the user’s real experience. | |
| AILA-WA (complete) | 0.081 | All modules work together to achieve the optimal prediction accuracy. |
This ablation study validates the effectiveness of each innovative component and points out that the CNN-LSTM feature extraction module is the most critical factor in the performance improvement of the entire model.
6 Conclusion
This paper focuses on the usability evaluation of AI-enhanced multilingual learning Web applications, builds a multi-dimensional evaluation index system that integrates language cognitive load and learning efficiency, and designs an AI-driven AILA-WA dynamic evaluation model, which overcomes the problem of insufficient adaptability between existing evaluation models and language learning scenarios. The study proposes a computational model covering intrinsic, extrinsic, and relevant cognitive load, which realizes the precise quantification of cognitive load in the process of language learning. A complete usability evaluation system, including five first-level indicators and 18 secondlevel indicators, is constructed and a four-stage dynamic evaluation framework of “data collection-feature extraction-indicator calculation-evaluation feedback” is designed. A CNN-LSTM model is used to extract multi-source data features, and a reinforcement learning algorithm is used to generate personalized optimization suggestions. Experiments show that the AILA-WA model performs better than any advanced comparison model in the industry in the past five years in terms of key indicators such as comprehensive usability score, cognitive load optimization rate, and learning efficiency improvement rate, and has excellent application value.
Although this study has made some breakthroughs in the field of usability evaluation of multilingual learning Web applications, there are still some limitations, and the follow-up work will focus on these shortcomings. Aiming at the problem of insufficient accuracy of cognitive load measurement, the current measurement methods mainly rely on indirect behavioral data and, in the future, physiological signals such as EEG and EMG will be integrated to greatly improve the objectivity and accuracy of the measurement results. Aiming at the problem that the operation efficiency of terminals with low computing power needs to be improved, lightweight technologies such as model quantification and pruning will be adopted in the future to further reduce the consumption of model resources. In view of the lack of cross-cultural adaptability, cross-cultural factor analysis will be added in the future to fit the learning habits and cognitive patterns of users with different cultural backgrounds, so as to create a more universal evaluation model. In addition, a multi-platform joint training mode based on federated learning will be explored to further enhance the generalization ability and robustness of the model on the premise of strictly abiding by the privacy of user data.
References
[1] F. T. Aulia, and T. N. Wahyudi. “The Influence of Learnability, Efficiency, Memorability, Errors, and Satisfaction on Consumer Satisfaction Levels in Fintech Fund Applications.” Proceedings International Conference on Education Innovation and Social Science. 2025.
[2] Y. Shamima and M. Atikuzzaman, “Usability testing of a Website through different devices: a task-based approach in a public university setting in Bangladesh,” Information Discovery and Delivery 52.4: 365–377, 2024.
[3] A. Costa, F. Silva, and José Joaquim Moreira, “Towards an AI-driven user interface design for Web applications,” Procedia Computer Science 237:179–186, 2024.
[4] R. Prasanna et al. “Evaluation of user interface design for Leaning Management System (LMS): Investigating student’s eye tracking pattern and experiences,” Procedia - Social and Behavioral Sciences 67:527–537, 2012.
[5] J. Sweller, J.J.G. van Merriënboer, and F. Paas, Cognitive architecture and instructional design: 20 years later. Educ Psychol Rev 31:261–292, 2019.
[6] C. B. Raju, “Enhancing Web application performance with AI-driven optimization techniques,” International Journal of Science and Research (IJSR) 10(2):1779–1788, 2021.
[7] T. Schmidt and T. Strasser, “Artificial intelligence in foreign language learning and teaching: a CALL for intelligent practice,” Anglistik: International Journal of English Studies 33.1:165–184, 2022.
[8] Y. F. Xue, K. Wang, and Y. Qiu, “Enhancing online learning: A multimodal approach for cognitive load assessment,” International Journal of Human–Computer Interaction 41.4:2692–2702, 2025.
[9] D. Qi, “Personalized recommendation algorithm for optimizing English vocabulary learning using neural networks,” International Journal of High-Speed Electronics and Systems 2540227, 2025.
[10] A. Tajik, “Integrating AI-driven emotional intelligence in language learning platforms to improve English speaking skills through real-time adaptive feedback,” Computers & Education, 208:104892, 2025.
[11] P. Nguyen, “Development of a multilingual language learning Web application,” International Multilingual Research Journal, 19(4): 289–307, 2025.
[12] C. B. Juan et al, “Enabling adaptability in Web forms based on user characteristics detection through A/B testing and machine learning,” IEEE Access 6:2251–2265, 2017.
[13] M.J. Adarsh and P. S. Acharya, “Optimizing Web applications with AI: Ensuring performance, trust and ethical standards,” Conference: Tech Horizon 2024: Advancing Frontiers in Computer Science & Information Technology, Sri Venkateswara University, 308–322.
[14] C.Y. Lai and L.J. Chen, “Effects of Web-based multimedia annotation on the performance, self-regulation, and cognitive load of students,” Educational Technology & Society 28.2, 2025.
[15] B. Erik and M.F. Moens, “A machine learning approach to sentiment analysis in multilingual Web texts,” Information Retrieval 12.5:526–558, 2009.
[16] X. Liu and Y. Jiang, “Aesthetic assessment of Website design based on multimodal fusion,” Future Generation Computer Systems 117:433-438, 2021.
[17] G. Evgenia et al, “Challenging cognitive load theory: The role of educational neuroscience and artificial intelligence in redefining learning efficacy,” Brain Sciences 15.2:203, 2025.
[18] S. Imrana, G.N. Obunadike, and Mukhtar Abubakar, “Machine learning-based framework for predicting user satisfaction in e-Learning systems,” Journal of Basics and Applied Sciences Research 3.2:78–85, 2025.
[19] S. Waite, P. Raju, and R. Grant, Measurement of system usability: validating the system usability scale within anaesthesia. Anaesthesia, 79(1):58, 2024.
[20] M.N. Alam, M.A. Islam, M.O.A. Babiker et al, AI-assisted learning tools and student learning outcomes: A cognitive load theory perspective. Computers in Human Behavior Reports, 21:100986, 2026.
[21] H. Wang, X. Guo, Y. Zhang et al, Multiple indicators and analytic hierarchy process for user experience evaluation of side-mounted range hood. Measurement, 274:121231, 2026.
Biographies

Rui Zhang was born in Liao Ning, China, in 1990. From 2009 to 2013, he studied at Shen Yang Normal University and received his bachelor’s degree in 2013. From 2013 to 2015, he studied at Northeast Normal University and received his master’s degree in 2015. From 2020 to 2025, he studied at Northeast Normal University and received his doctor’s degree in 2025. He has published a total of eight papers, and one monograph. His research interests include educational management and international Chinese language education.

Zinan Wang an associate professor and dual-qualified teacher, specializing in early childhood physical education research. He leads the Shandong Provincial First-Class Undergraduate Course “Physical Education for Preschool Children” and has contributed to a provincial-level teaching achievement award. He has presided over more than 10 provincial and ministerial research projects, authored three textbooks, and holds two software copyrights. Additionally, he has led three industry-academia collaboration projects with a total funding of 500,000 RMB, completed one technology transfer generating 100,000 RMB in revenue, conducted over 50 training and guidance sessions, and led students to win more than 10 awards in skill competitions. As a key member, he has actively participated in industry-education integration teaching reforms and achieved significant outcomes.

Jing He was born in Harbin, Heilongjiang Province, China, in 1990. From 2008 to 2012, she studied at Changchun University of Science and Technology, where she earned a Bachelor of Arts degree in 2012. From 2013 to 2016, she pursued her studies at Northeast Normal University and obtained a Master of Arts degree in 2016. She currently works as an instructor at Qingdao Hengxing University of Science and Technology. Her research interests include International Chinese Language Education and Education.

Bing Li was born in Henan Province, China, in 1980. He studied at Henan Vocational and Technical College from 2000 to 2003, studied at Henan Agricultural University from 2004 to 2006, and obtained his bachelor’s degree in 2006. From 2003 to 2024, he worked at Henan Polytechnic. From 2007 to 2009, he studied at the University of Electronic Science and Technology of China and obtained a master’s degree in 2009. At present, he works at Henan Vocational and Technical College. He has published 15 papers, two of which have been indexed by SCI and one by EI. His research interests include computer science and technology.
Journal of Web Engineering, Vol. 25_5, 977–1014
doi: 10.13052/jwe1540-9589.2559
© 2026 River Publishers