Security Architecture of WEB-based Education Management Platform Based on Zero-Trust Model: Protecting Sensitive Student Data and Teaching Resources
Baowang Yang
College of Science & Technology Ningbo University, Ningbo 315300, China
E-mail: yangbaowang1983@163.com
Received 01 April 2026; Accepted 19 June 2026
Abstract
In response to security risks such as data leakage and unauthorized access in educational Web platforms during digital transformation, this paper proposes a five-layer security architecture based on the zero-trust model. Following the principle of “never trust, always verify,” the architecture integrates identity management and access proxy technologies to build a collaborative protection system. It employs a multi-dimensional permission model for fine-grained access control, combines signature and behavior detection to strengthen Web attack protection, and leverages dynamic authorization evaluation, three-factor authentication, AES256 encryption, and distributed storage to ensure authentication and data security. Comparative experiments show that the architecture effectively mitigates unauthorized access, session hijacking, and abnormal authentication attacks, achieving a 97.0% defense success rate. Under 50 concurrent users, authentication delay remains within 4.2 ms, and the average response time in high-frequency access scenarios is 68 ms. Throughput meets the peak demands of education systems, with performance improved by 57.5% compared to traditional Web education platform architectures (TWEPA) and by 33.3% compared to general zero-trust architectures (ZTA). This solution provides a feasible approach for security enhancement and data compliance management in educational Web platforms.
Keywords: Zero-trust model, education management platform, teaching resources, security architecture.
1 Introduction
1.1 Research Background
The Web-based education management platform serves as the carrier of digital education, characterized by multi-source, heterogeneous, and sensitive data, as well as cross-role access involving student sensitive information, academic records, and high-quality teaching resources. Its security protection is critical to safeguarding student privacy and maintaining the stability of teaching operations. Traditional perimeter-based protection models can no longer meet the demands of today’s complex network attack landscape, and Web-based education applications face various security threats such as data leakage and injection attacks, necessitating a transformative security architecture for effective support.
1.2 Applicability of Zero-Trust Model
The zero-trust model, grounded in the principle of “never trust, always verify,” offers a novel solution for Web application security protection and has demonstrated significant effectiveness across multiple dimensions. Relevant research indicates that zero-trust architecture (ZTA) can transcend traditional network security paradigms, meet the requirements of building robust Web security mechanisms, and provide both theoretical and technical foundations for upgrading the security of Web applications in the education sector. Currently, some studies have integrated zero-trust concepts into the design of online education systems oriented to Web services, offering practical insights for the secure adaptation of educational scenarios.
1.3 Research Contents and Objectives
In this context, this paper focuses on the construction of a security architecture for a Web-based education management platform based on the zero-trust model. Guided by the protection requirements for sensitive student data and teaching resources, and by integrating the characteristics of the zero-trust technology framework with educational Web application scenarios, this study explores the design pathway of an adaptive security architecture. It aims to address the limitations of traditional protection mechanisms, enhance the platform’s security capabilities, and provide effective security assurance for the high-quality development of digital education.
2 Research Status and Security Architecture Design
2.1 Research Progress in Web Application Field
Research on multi-scenario expansion, performance optimization, and security protection of Web applications has provided comprehensive theoretical and practical support for its cross-domain landing and high-quality development. Zhang [1] proposed a hybrid privacy protection technology that integrates zero-trust and computational intelligence, and applied it to the English education model, aiming at strengthening the security of sensitive data and improving the intelligence and credibility of the teaching system. Tang [2] focused on the intelligent construction of university Web environment education systems, noting that traditional intranet boundary protection cannot adapt to open access needs, laying a business scenario foundation for security architecture design. Arabi et al. [3] proposed a management framework for academic misconduct in colleges and universities based on the zero-trust model, and built a prevention mechanism around the five core pillars of zero-trust (personnel, workload, equipment, network, data), providing a scenario-based practical reference for the application of zero-trust in the field of education.
Wang et al. [4] designed a set of zero-trust network security education modules, covering principle teaching, homework exercises, and testing links, systematically combing the defects of traditional boundary model and the advantages of ZTA, providing a solution for the teaching of zero-trust concept in network security courses. Perkins and Akorede [5] used Web crawlers to track education recruitment information, verifying serious data crawling risks on Web platforms, providing empirical basis for clarifying crawler threats. Fadlil et al. [6] designed an SQL injection mitigation scheme based on the OWASP framework, showing SQL injection is a mainstream high-risk attack threatening education platform core data, offering key technical reference for zero-trust application layer protection. Woo et al. [7] proposed a zero-trust security model based on ARC access risk coefficient for Korean public education network, which provides an operational technical framework for the implementation of zero-trust strategy in the education network environment.
Akram and Ahmed [8] proposed a cloud-native zero-trust security framework for smart classroom eye tracking technology, which combines zero-trust with inclusive educational technology security and expands the application boundary of zero-trust in special educational scenarios. Albaghli et al. [9] found university Web platforms emphasize experience over security with native design defects, providing empirical support for security architecture top-level design. Vajpayee et al. [10] introduced the intelligent school bus system into the modeling of zero-trust and network risk, which provided a research prototype for the application of the concept of zero-trust in the education support system around the campus. Paul and Rao [11] systematically elaborated the architecture principles and implementation scheme of the zero-trust model in the intelligent manufacturing industry, providing an important theoretical reference for the security architecture of the education platform. Islam [12] focused on Web systems in higher education and proposed a data governance framework integrating zero-trust and FERPA compliance, which consists of centralized identity access control, secure APIs, and tamper-proof audit logs.
Coetzee and Mulaudzi [13] explored Web 3.0 in technical student training, showing traditional security cannot adapt to new scenarios, supporting zero-trust introduction. Zahorodko and Semerikov [14] constructed a Web programming education framework, noting AI application expands sensitive data scope, requiring higher security. Kim et al. [15] developed a Web education platform for unmanned vehicle design, pointing out the need for teaching resource security protection. Liu et al. [16] proposed a Web application collaborative mechanism, providing technical ideas for zero-trust in high concurrency scenarios. Tsai et al. [17] put forward zero-trust implementation strategies, laying the core theoretical framework. Teerakanok et al. [18] summarized zero-trust development and challenges, laying a complete theoretical foundation.
2.2 Core Theoretical Basis of Security Architecture Design
2.2.1 Core theory of zero-trust model
The mapping between the four key technical frameworks and the Web education platform is as follows. First, the identity management component corresponds to the platform’s unified identity authentication system, which manages the full lifecycle of multi-role identities and assigns primary identity identifiers. Second, the access proxy component corresponds to the zero-trust Web gateway, which serves as the unified access entry, intercepting and pre-validating all requests. Third, the continuous verification component corresponds to the dynamic authorization and behavior monitoring module, which continuously collects various types of information to dynamically adjust verification policies. Fourth, the security monitoring component corresponds to the security audit module, which collects and analyzes logs and security events in real time to detect anomalies as early as possible. The mapping relationship between the key technical frameworks of the zero-trust model and the Web education platform is illustrated in Figure 1.
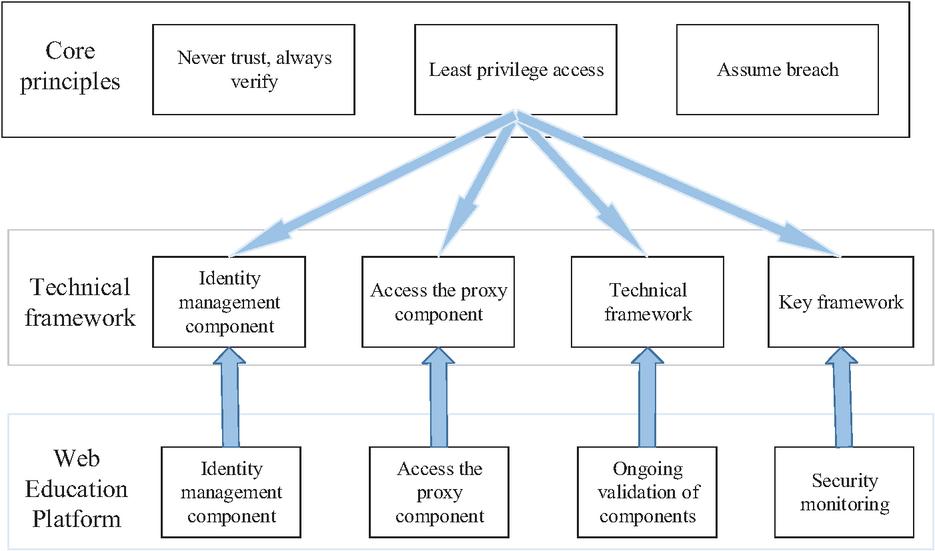
Figure 1 Mapping relationship between key technical framework of zero-trust model and Web education platform.
2.2.2 Core theory of web application security
Regarding the technical principles and application specifications for secure Web data transmission and storage, the platform should adopt TLS 1.3 encryption to ensure transmission confidentiality. Only after data is encrypted should the transmission of different types of sensitive data be permitted, and plaintext data handling should be limited to ensuring the platform can perform essential functions such as epidemic prevention. Data desensitization techniques, such as replacement and masking, are applied to sensitive data for display or sharing purposes. Distributed storage encryption employs encryption algorithms like AES256 to encrypt and decrypt stored data, ensuring that only authorized users have the right to access the encrypted data. The core principle of balancing Web performance and security lies in coordinating the relationship between security mechanisms and performance metrics. While security mechanisms may introduce latency and reduce throughput, such impacts can be mitigated through technical adjustments. Multi-factor authentication uses asynchronous verification to reduce response overhead, and full-link encryption leverages hardware acceleration to improve efficiency. The platform should dynamically adjust its policies – streamlining non-core verification to maintain throughput during high-concurrency scenarios, while applying enhanced encryption and verification to ensure security when accessing sensitive data. The logic of balancing Web application security and performance is illustrated in Figure 2.
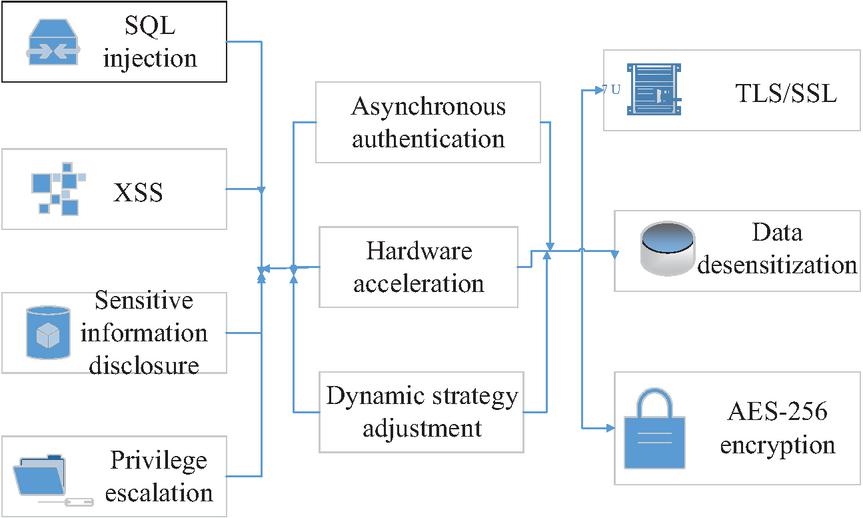
Figure 2 Web application security and performance balancing logic.
3 Security Architecture Design of Web Education Management Platform Based on Zero-Trust
3.1 Frame Design
Based on the zero-trust model and guided by the principle of “never trust, always verify,” this paper defines the main functions and security responsibilities of each layer to construct a full-link closed-loop protection system. Ultimately, a five-layer security architecture for the Web-based education management platform is designed. The user access layer serves as a unified entry point, supporting multi-terminal access and multi-factor authentication. It filters out unauthorized terminals through terminal security detection, access verification, and initial identity authentication, ensuring entrance security. The zero-trust Web gateway layer functions as the core forwarding and verification node, integrating a Web Application Firewall (WAF) with dynamic authorization. It performs secondary identity verification, initial permission determination, anomaly filtering, and legitimate request forwarding, enabling full-link verification and defense against Web attacks. The application service layer adapts to core business operations by implementing fine-grained access control, business logic validation, and sensitive data desensitization, preventing privilege abuse. The data storage layer adopts a distributed architecture, with data stored separately by type, backed up regularly after AES256 encryption, and restored as needed to ensure data storage security and integrity.
The security monitoring and auditing layer relies on log collection, anomaly analysis, real-time alerting, and audit traceability to monitor the security posture in real time and address risks promptly. The layers work in coordination to achieve comprehensive security protection across the entire lifecycle of educational data, ensuring both business availability and compliance requirements, as illustrated in Figure 3.
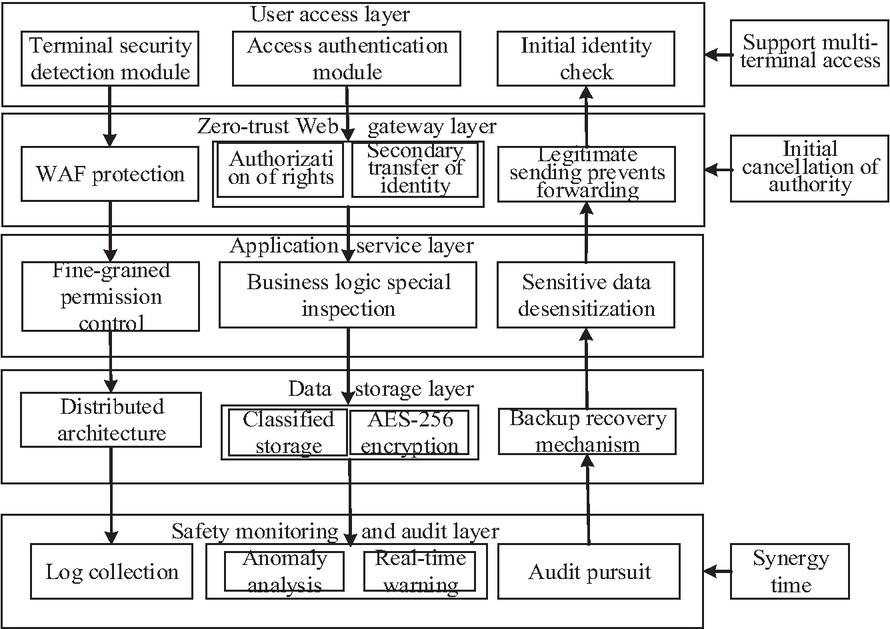
Figure 3 Security architecture design of Web education management platform based on zero-trust.
Based on the scale of typical educational data (about 50 MB metadata of 100,000 student files about 2 TB files of 10,000 class hours of teaching resources), the key performance indicators of distributed encrypted storage are quantitatively analyzed as follows.
3.2 Core Function Module Design and Algorithm
3.2.1 Zero-trust web authentication module
Multi-factor authentication mechanism
The zero-trust Web identity authentication module primarily employs a multi-factor authentication mechanism. Within this mechanism, the set of authentication factors and their corresponding weight distributions must first be determined. Based on this, a linear-level allocation of authentication factors is carried out, followed by the determination of the control scope for authentication policy mapping within a single scenario. A hierarchical authentication strategy is then constructed for identity authentication preprocessing. The initial weight values of the authentication factors are determined through trial-and-error using Equations (1), (2), and (3), and the weight distribution for each scenario is established, thereby deriving the comprehensive authentication score threshold.
The trial-and-error Equation (1) is defined:
| (1) |
where represents the authentication factor set, is the account password authentication result (pass 1, fail 0), is the SMS authentication result (pass 1, fail 0), is the unified identity authentication result (pass 1, fail 0), and is the device fingerprint authentication result (pass 1, fail 0). The expert scoring method invites 10 network security experts from the education industry to participate (including five directors of university information centers and five security engineers of educational software). The five-level Likert scale (1 least important, 5 most important) was used to evaluate the security based on four dimensions: security strength, user convenience, anti-counterfeiting ability, implementation cost. The consistency of the experts’ scores was tested by Kendall’s concordance coefficient , indicating good consistency of the experts’ opinions. The formula for calculating the weight of the th authentication factor in the th scenario is
| (2) |
where is represented as a scene weight vector
| (3) |
where is the weight distribution formula of the expert scoring method and represents the score of the expert for the th factor in the th scenario.
After the authentication factor weight is determined, the authentication comprehensive score is calculated according to Equation (4)
| (4) |
In order to ensure the comparability of the certification comprehensive scores in different scenarios, the following normalization constraint is adopted to map to the [0,1] interval
| (5) |
where is satisfied under each scenario, thus ensuring that .
Session security management
Session security management implements stateless session authentication by controlling token expiration time, anomaly detection coefficient, and session liveness. This process mainly uses JWT environment and encryption algorithm conditions.
Assume that the system security level is , then the initial expiration time is set, and the initial expiration time of the session is calculated according to Equation (6)
| (6) |
Let the abnormal behavior feature vector , where denotes whether the th abnormal behavior occurs, and the anomaly detection coefficient is calculated as
| (7) |
Let the current time be , and the latest access time be , then the session liveness can be calculated according to Equation (8)
| (8) |
Next, the dynamic expiration time T of the session is calculated according to Equation (9)
| (9) |
Finally, the validity check result of the session is calculated according to Equation (3.2.1)
3.2.2 Fine-grained web resource access control module
The access control process is realized through the computation and verification of the permission matrix, with the permission mapping relationship calculated using Equation (11)
| (11) |
where represents a user-role mapping matrix, represents that the user has the role , otherwise is represents the role-resource-operation mapping matrix, , means that the role has the operation permission to the resource , otherwise it is 0.
This process requires that the weights of the evaluation indicators be distributed reasonably. The specific calculation steps are shown in Equations (12), (13), and (14).
Equation (12) is mainly responsible for calculating the normalized value of the th evaluation index. Suppose that the original value set of the scene evaluation index is , and the normalization calculation formula is:
| (12) |
Equation (13) is mainly responsible for calculating the dynamic authorization score. Suppose the index weight vector , the dynamic authorization score calculation is
| (13) |
Equation (14) is responsible for defining the authorization threshold. Suppose that the system security requirement level is , and the authorization threshold calculation is
| (14) |
The result of using the gradient descent method to calculate the weight change and the back propagation of the error is obtained by the Equation (14), the authorization decision error , and the formula for calculating the weight adjustment amount is as shown in (15)
| (15) |
The adjustment of the evaluation index value is calculated by Equation (16), which mainly calculates the optimization direction of the evaluation index
| (16) |
3.2.3 Web application security protection module
First, an attack signature library is constructed. The completeness of the signature library largely determines the efficiency of signature-based matching detection. Based on continuously collected attack data, the initial scale of the signature library ranges from 500 to 2000 signature rules. On this basis, the performance indicators of the detection process are obtained using the signature matching accuracy Equation (17) and the behavior detection recall Equation (18)
| (17) | ||
| (18) |
where represents the number of true positives, represents the number of false positives, and represents the number of false negatives.
Next, the fusion operation of the dual detection mechanism is performed, and the process needs to calculate the weight ratio of each detection method and the judgment of the final detection result according to Equation (19)
| (19) |
where represents the feature matching weight, represents the behavior analysis weight, represents the feature matching score, and represents the behavior abnormality degree.
The feature matching weight and the behavior analysis weight are adaptively adjusted according to the attack type identification result. A pre-experiment based on 1000 annotated attack samples (500 SQL injections, 300 cross-site scripts, and 200 path traversals) determines the initial empirical weights: , and the optimal detection accuracy (F1 score 0.94) is obtained at this ratio.
Weights are dynamically adjusted for different attack scenarios:
Known attack (presence of signature library): increased to 0.7–0.8.
Unknown/Zero-Day Attack: increased to 0.6-0.7.
Mixed attack traffic: weight remains 0.6/0.4 ratio.
The adaptive adjustment formula is as follows:
where is the historical accuracy of feature detection (updated every 100 requests) and is the accuracy of behavior detection.
After completing the description of the double detection mechanism, it is necessary to build the “feature behavior” model.
First, the normalization preprocessing of the original request data is performed according to Equation (20)
| (20) |
where represents the original request data, represents the mean value of the same kind of request data, and is the standard deviation. After the standardized data is obtained, the data is normalized according to Equation (21), so that the data of each dimension is in the same dimension
| (21) |
Feature extraction of the request data is performed on the basis of the normalized data, and the -dimensional feature vector of the request data can be extracted according to Equation (22), where is the feature dimension
| (22) |
The similarity between the request data and the normal behavior baseline can be calculated according to Equation (23), where is the normal behavior baseline vector
| (23) |
The abnormal degree score of the request data can be obtained according to Equation (24)
| (24) |
In combination with the feature matching result, the final attack detection result can be obtained according to Equation (25), where is the detection threshold
| (25) |
3.3 Attack Surface Analysis of Security Architecture Itself
While the architecture in this paper provides comprehensive protection against external attacks, its internal components also have potential attack surfaces. If these components are compromised or bypassed, the entire security system will be at risk of failure. Therefore, this section analyzes the attack surface of the core internal components such as the zero-trust Web gateway, security monitoring, and audit layer, and gives the corresponding protection and response mechanisms.
3.3.1 Anti-bypass and self-protection of zero-trust web gateways
As the only request entrance of the whole system, the gateway becomes the target of high-value attack. In order to prevent gateway bypass attacks, the system uses a three-layer protection mechanism. First, all back-end services are deployed in the internal network quarantine with the gateway. Only inbound connections from the gateway IP are allowed through the firewall policy. At the same time, mutual mTLS authentication is enabled between the gateway and the back-end. Even if the attacker bypasses the gateway to access the back-end IP directly, it cannot pass the certificate verification; Cond, the gateway instance adopts master-master cluster deployment (at least 3 nodes), and the load balancer distributes traffic uniformly. When a single gateway is compromised, other gateways still maintain the security policy. The load balancer performs health check every 5 seconds, and the failed gateway automatically quarantine within 3 seconds; Thirdly, the network traffic anomaly detection module is deployed to continuously monitor whether there is abnormal traffic that bypasses the gateway to directly access the back-end. Once such behavior is detected, the firewall rule update is triggered immediately, the suspicious source IP is blocked, and the alarm is sent to the security team.
3.3.2 Audit log tamper-proof and integrity protection
Security monitoring and audit layer is the key basis for tracing after the event. If the log is tampered with by the attacker, the attack will be untraceable. In order to prevent log tampering, the system uses a log storage mechanism based on Zero-Trust Model. each log entry contains the SHA-256 hash value of the previous entry, forming an irreversible hash chain, and any modification to the history log will lead to the invalidation of all subsequent hash values, so it can be quickly detected. Log writing uses a WORM (Write Once Read Many) storage device, which prohibits any modification or deletion operations during the 30-day retention period. In addition, the system automatically performs an integrity check every 60 seconds to traverse the hash chain and verify the hash value consistency of each entry; if tampering is detected, the highest priority alarm is triggered immediately, all active sessions of the user associated with the tampered log are automatically terminated, and the damaged log is restored from the immutable backup.
3.3.3 Hierarchical response mechanism when internal components are compromised
In response to the scenario where different components are compromised, the system establishes a hierarchical response mechanism, as shown in Table 1.
Table 1 Graded response mechanism
| Attack Scenario | Detection Method | Response Action | Recovery Time |
| Gateway bypass | Network traffic anomaly detection | Automatically update firewall rules to block source IP quarantine compromised gateway nodes | 10 s |
| Audit log tampering | Hash chain integrity check failed | Restore log from WORM backup, terminate relevant user session, security team alert | 30 s |
| Authentication service compromised | Abnormal fluctuation of authentication success ratio | Automatically switch to the standby authentication service and trigger the two-factor forced authentication | 5 s |
| Authorization module hijacking | Permission consistency check | Roll back to the most recent trusted state, withdraw all active sessions, and recertify | 15 s |
| The monitoring module is blind | Heartbeat timeout or alarm flow interrupt | Start the standby monitoring instance and enable more aggressive end-side log reporting | 10 s |
Through the above attack surface analysis and protection design, the architecture in this paper has the ability to resist the attack or bypass of internal components while dealing with external attacks, forming a deep defense system with both internal and external considerations.
4 Analysis and Discussion on the Experimental Results of Performance Comparison
In this paper, ZTA and the traditional Web education platform architecture (TWEPA), Role-Based Access Control (RBAC) and other mainstream education system architectures (MEASA), Tianyi Cloud AOne Zero-Trust Architecture (TCAZ) and other similar schemes are compared, and the experimental environment of 10 schools, departments and functional departments is built according to the multi-role and multi-level educational business scenario. It includes various core data interaction and access scenarios, and conducts comparative tests in five aspects: unauthorized access performance, identity authentication efficiency, access control accuracy, abnormal behavior detection of security architecture, data storage security performance. According to the design principles of each architecture, the causes of differentiation are analyzed to comprehensively test the superiority and applicability of the ZTA in the educational scenario.
4.1 Comparative Analysis Of Anti-Unauthorized Access Performance
4.1.1 Comparison of anti-unauthorized access performance of different models
In this test, 200 students from different grades and classes across 10 schools were selected as test subjects. The students were simulated to view performance data from other classes by modifying access links and forging class identifiers. During the test, the model training time was gradually increased in increments of 20 minutes. For each increment, 50 unauthorized access attempts were made, and the number of successful blocks under various architectures was recorded. The success rate of defending against unauthorized access by students under different architectures was then calculated to evaluate the effectiveness of each architecture in preventing such unauthorized access. The results are shown in Figure 4.
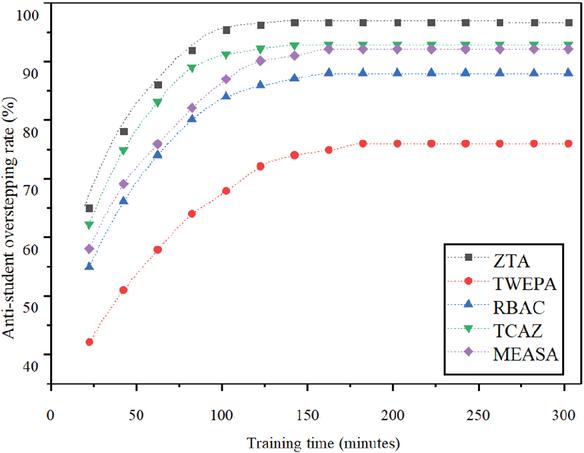
Figure 4 Comparison results of anti-student overstepping rate (%) of different models.
Figure 4 shows that the ZTA exhibits significant advantages in preventing unauthorized student access, primarily reflected in its high blocking rate and fast convergence speed. The core data analysis is as follows. In the initial 20-minute training stage, ZTA achieved the highest unauthorized student access blocking rate (65.3%), while TWEPA had the lowest (42.4%), a 22.9-percentage-point gap. With increased training, ZTA showed the most obvious growth, reaching 95.7% at 100 minutes (30.4 percentage points higher than initial) and stabilizing at 97.0% at 120 minutes without false negatives. Other architectures performed worse: TCAZ stabilized at 93.0% at 100 minutes; RBAC and MEASA stabilized at 88.3% and 92.4% at 300 minutes; TWEPA stabilized at 76.3% at 300 minutes. These differences result from ZTA’s three-dimensional verification and blockchain technology, which outperforms others’ lagging, less adaptive protection logic.
4.1.2 An analysis of the rate of anti-teacher’s over-authority in different models
In this paper, 150 teachers from 10 schools including various disciplines were selected as the test subjects to simulate teachers trying to access the confidential information of educational administration, such as student admission data, title evaluation materials, financial budget, and so on. The test takes 20 minutes as the training time interval, and 60 times of unauthorized access tests are conducted in each time period. The blocking success rate of each architecture is the anti-teacher’s unauthorized rate, which mainly examines the control effect of different architectures on the unauthorized behavior of teachers’ privileged roles. The results are shown in Figure 5.
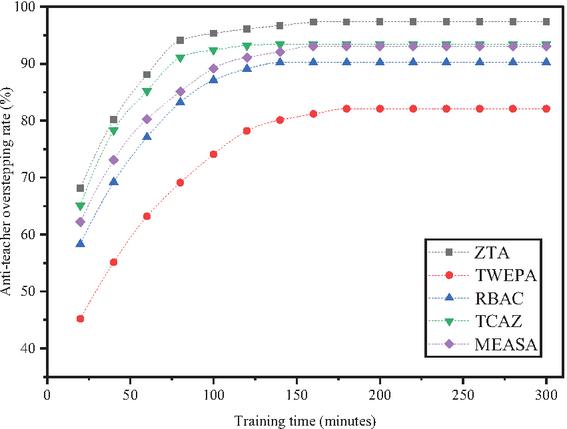
Figure 5 Comparison results of anti-teacher overstepping rate (%) of different models.
Figure 5 shows that ZTA performs best in the scenario where teachers attempt to exceed their authority to view confidential educational administration data, with key advantages being fast convergence speed and a high stable blocking rate. In the initial 20-minute training stage, ZTA achieved a 68.1% blocking rate against unauthorized access, outperforming TWEPA (45.2%), RBAC (58.3%), and TCAZ (65.1%) by 22.9, 9.8, and 3.0 percentage points. As training progressed, ZTA converged early: 94.1% at 80 minutes (26.0 percentage points higher than initial) and stabilized at 97.0% at 120 minutes. TCAZ stabilized at 93.0% after 180 minutes with 4.0% false negatives. MEASA and RBAC reached 93.1% and 90.2% at 300 minutes (3.9 and 6.8 percentage points lower than ZTA), failing to address special unauthorized scenarios. TWEPA performed worst, stabilizing at 82.1% at 300 minutes with slow convergence. These gaps result from other architectures’ flaws, while ZTA uses three-dimensional authentication and hot permission caching to meet educational data security needs.
4.1.3 Analysis of anti-session hijacking rate of different models
A simulated attack environment was established, in which testers acted as attackers to hijack legitimate sessions of teachers and students by intercepting HTTP session cookies and forging session identifiers in order to access sensitive data in the education system. Based on training durations ranging from 20 minutes, seven gradient levels were defined, with 70 session hijacking attacks conducted at each level. The number of hijacking attempts identified and blocked by each architecture was recorded, and the anti-session hijacking rate was calculated to evaluate the session security protection capability of each architecture. The final results are shown in Figure 6.
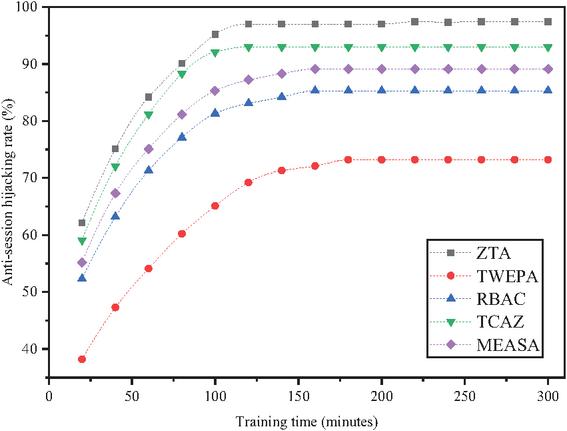
Figure 6 Comparison results of anti-session hijacking rate (%) of different models.
Figure 6 shows ZTA’s decisive advantage in resisting session hijacking, with stable blocking rate and fast convergence. Initially, ZTA achieved 62.1% anti-hijacking rate, 23.9 percentage points higher than TWEPA (38.2%). It reached 90.1% at 80 minutes, 95.2% at 100 minutes, and stabilized at 97.0% after 120 minutes. TCAZ stabilized at 93.0% after 140 minutes; MEASA and RBAC reached 89.1% and 85.3% at 300 minutes. TWEPA performed worst, stabilizing at 73.2% at 300 minutes with slow convergence. Gaps result from others’ flaws (static IDs, no real-time checks, poor adaptability), while ZTA uses three-dimensional verification, blockchain traceability and hot permission cache to build a comprehensive session security barrier.
4.1.4 Analysis of mean interruption response time of different models
Three typical unauthorized access cases from the previous study were selected. For each case, 100 training sessions were added at each level, and 40 tests were repeated for each unauthorized access scenario within every training session. A professional performance testing tool was used to accurately record the time from the detection of unauthorized access behavior to the completion of blocking in each architecture. The average time for each scenario was taken as the average blocking response time for that gradient, providing a comprehensive evaluation of the response efficiency of each architecture. The results are shown in Figure 7.
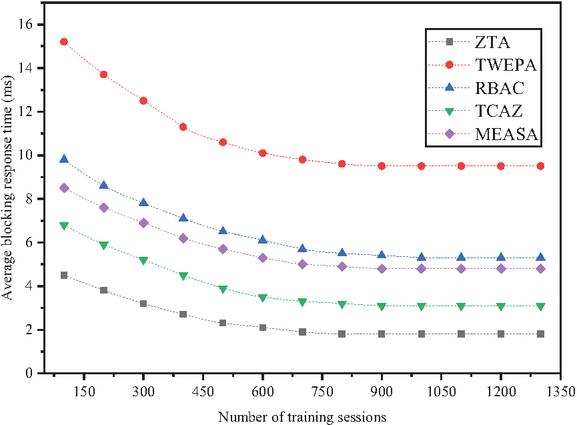
Figure 7 Comparison results of mean blocking response time (ms) of different models.
Figure 7 shows that ZTA outperforms other architectures in terms of average blocking response time, convergence speed, and post-stabilization efficiency. In the initial training stage (100 sessions), ZTA achieved the shortest average blocking response time at 4.5 ms, while TWEPA recorded the longest at 15.2 ms – 3.4 times that of ZTA; RBAC, MEASA, and TCAZ recorded response times of 9.8 ms, 8.5 ms, and 6.8 ms, respectively, all higher than ZTA. As training sessions increased, ZTA exhibited the fastest decline, dropping to 2.7 ms at 400 sessions, 2.1 ms at 600 sessions, and 1.9 ms at 700 sessions; by 800 sessions, it reached 1.8 ms, stabilizing at that level after 900 sessions with no further fluctuation. In comparison, after stabilization, TCAZ achieved a response time of 3.1 ms (1.7 times that of ZTA), RBAC 5.3 ms (2.9 times), MEASA 4.8 ms (2.7 times), and TWEPA 9.5 ms (5.3 times). In terms of performance improvement, ZTA’s average response time is 81% faster than TWEPA and 42% faster than TCAZ. These advantages stem from ZTA’s integration of a hot permission cache mechanism and three-dimensional parallel verification, enabling it to meet the real-time protection requirements of the education system and effectively mitigate the risk of sensitive data leakage.
4.1.5 Analysis of maximum response time of different models
A high-concurrency unauthorized access simulation test was adopted. A stress testing tool was used to create a multi-threaded environment simulating 50 concurrent users initiating unauthorized access requests simultaneously. For each training session, 100 training iterations were set as the gradient for high-concurrency testing, with 30 high-concurrency tests conducted per session. The maximum response time – defined as the longest duration to complete blocking – was recorded to evaluate the response stability of each architecture under extreme load. The results are shown in Figure 8.
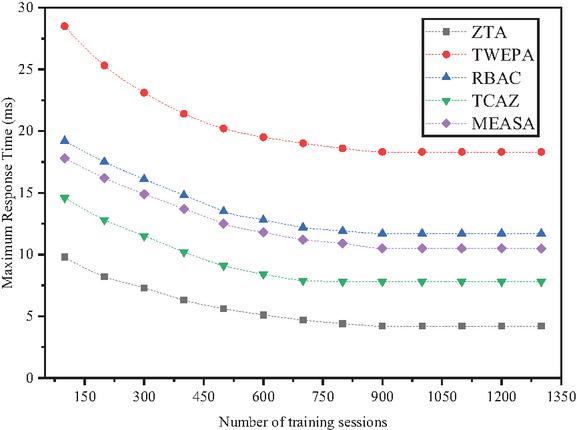
Figure 8 Comparison of maximum response time (ms) of different models.
Figure 8 shows ZTA’s strong stability and advantages in maximum response time control. At initial 100 training sessions, ZTA’s maximum response time was 9.8 ms, much lower than TWEPA (28.5 ms), RBAC (19.2 ms), MEASA (17.8 ms), and TCAZ (14.6 ms). With more sessions, ZTA declined fastest, stabilizing at 4.2 ms after 900 sessions with no fluctuation. After stabilization, TCAZ was 7.8 ms, RBAC 11.7 ms, MEASA 10.5 ms, and TWEPA 18.3 ms. ZTA outperforms TWEPA by 77% and TCAZ by 46%. These advantages come from ZTA’s blockchain distributed storage and hot permission caching mechanism, enabling stable protection against large-scale unauthorized access in education systems.
4.2 Comparative Analysis of Identity Authentication Efficiency
4.2.1 Analysis of authentication success rate of different model
A total of 300 subjects from different classes in 10 schools were selected to simulate general authentication behaviors such as daily login and resource access. According to the time gradient of 20 minutes, the training time of the model is gradually increased, 60 authentication tests are conducted in each time period, and the authentication success rate of various architectures is obtained to evaluate the adaptability of different architectures to the authentication requirements of legitimate users. The test results are shown in Figure 9.
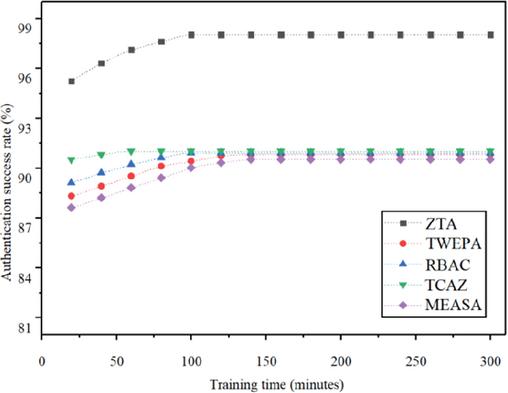
Figure 9 Comparison results of authentication success rate (%) of different models.
Figure 9 shows ZTA’s clear advantages in authentication success rate, convergence speed. and stability. At the initial 20-minute training, ZTA achieved 95.2%, higher than TWEPA (88.3%), RBAC (89.1%), TCAZ (90.5%), and MEASA (87.6%). With increased training, ZTA grew fastest, reaching 98.0% at 100 minutes (2.8 percentage points higher) and stabilizing with no failures. After stabilization, TCAZ reached 91.0% (7.0 points lower), MEASA and RBAC at 90.5% and 90.9%, TWEPA at 90.8% after 200 minutes (only below 91.0%). Gaps come from others’ fixed logic and poor adaptability. ZTA uses three-dimensional verification and blockchain to meet education system multi-role authentication needs.
4.2.2 Analysis of anomaly authentication interception rate of different models
Here we simulate malicious authentication behaviors such as brute force cracking, account embezzlement, and identity forgery to evaluate the security protection capability of each architecture. We select the commonly used malicious attack method, repeat the anomaly authentication test every 20 minutes, conduct 70 anomaly authentication tests in total, record the number of successful interceptions of each architecture, calculate the anomaly authentication interception rate, and mainly examine the effect of identifying and preventing malicious authentication behavior of various architectures. The test results are shown in Figure 10.
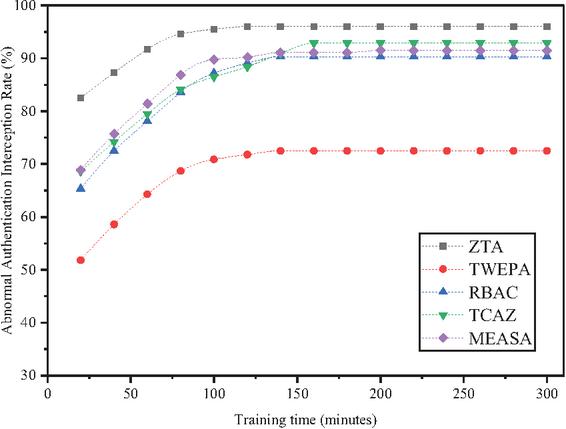
Figure 10 Comparison results of abnormal authentication interception rate (%) of different models.
Figure 10 shows ZTA’s overwhelming advantage in anomaly authentication interception. At the initial 20-minute training stage, ZTA achieved 82.5% interception rate, far exceeding others; TWEPA only 51.8% (30.7-percentage-point gap), reflecting traditional architectures’ weak initial protection. With training progress, ZTA’s interception rate rose rapidly: 94.6% at 80 minutes (12.1 percentage points higher), 96.0% at 120 minutes, stabilizing at 96.0% after 140 minutes with no missed malicious authentications. TCAZ ranked second (92.9% at 140 minutes, 3.1 points lower). MEASA and RBAC stabilized at 300 minutes (90.1% and 90.3%, 5.9 and 5.7 points lower). TWEPA performed worst, stabilizing at 72.5% (75.5% of ZTA’s rate) with slow convergence (20.7-point increase). These gaps stem from others’ single-factor verification and insufficient anomaly identification; ZTA uses three-dimensional verification and blockchain traceability to protect education system identity authentication.
4.2.3 Analysis of average authentication time of different models
The training intensity of the model is gradually increased with the typical cases of the previous normal authentication scenarios, and 40 tests are conducted for each normal authentication scenario under each training frequency gradient. We use a professional performance test tool to record the time from receiving the authentication request to completing the identity verification of each architecture, take the average time of each scenario as the average authentication time of the gradient, and comprehensively evaluate the authentication response speed of each architecture. The results are shown in Figure 11.
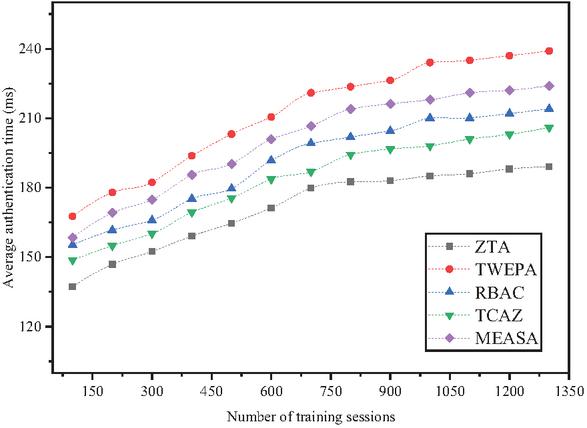
Figure 11 Comparison results of average certification time of different models.
Figure 11 compares the average certification time (unit: ms) of ZTA, TWEPA, RBAC, TCAZ, and MEASA models within the range of 100 to 1300 training times. On the whole, the average authentication time of all models increases with the increase of training times. The authentication time of ZTA model is the shortest, which increases from 137.2 ms of 100 training times to 189 ms of 1300 training times, and the authentication time of TWEPA model is the longest, which increases from 167.5 ms to 239 ms. Among the five models, ZTA always maintains the best performance, TWEPA has the worst performance, and the other three models perform between the two.
4.2.4 System resource occupancy performance comparison
A teacher-student multi-terminal collaborative access scenario was simulated with a multi-device linkage test tool, mimicking users’ continuous authentication synchronization across PCs, mobile devices and tablets. Model training levels were increased by 100 sessions each, with 30 cross-terminal authentication tests per gradient. The time each architecture took to complete terminal authentication information synchronization in each test round was recorded to evaluate its synchronization efficiency in multi-terminal collaboration scenarios, and the results are shown in Figure 12.
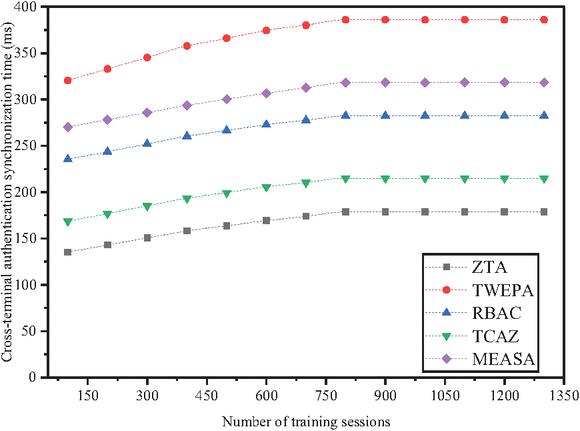
Figure 12 Cross-terminal authentication synchronization time analysis of different models.
Figure 12 shows ZTA’s advantages in cross-terminal authentication synchronization time, convergence speed, and stability. At the initial 100 training times, ZTA’s synchronization time was 135.2 ms, much lower than TWEPA (320.5 ms), RBAC (235.3 ms), MEASA (270.4 ms) and TCAZ (168.7 ms, 24.7% higher). With more training, synchronization times increased and stabilized. ZTA rose slowest, stabilizing at 178.5 ms after 900 times without fluctuation. TCAZ stabilized at 215.0 ms (20.4% higher than ZTA); RBAC at 282.2 ms ; MEASA at 318.3 ms; TWEPA at 385.9 ms. ZTA’s better performance growth control meets education system multi-terminal collaboration needs, improving user experience and efficiency.
4.3 Distributed Encrypted Storage Performance Measurement
In order to verify the above theoretical analysis, the performance of distributed encrypted storage is tested in the actual deployment environment. Test environment as follows: 3-node MinIO distributed cluster (each node configuration: 4 vCPU, 16 GB RAM, 1 TB NVMe SSD), network bandwidth: 1Gbps. See Table 2 for encryption and decryption performance tests.
Table 2 Encryption and decryption latency for different file sizes
| File Size | Encryption Latency (ms) | Decryption Latency (ms) | Throughput (MB/s) |
| 4 KB | 0.8 | 0.9 | 5.0 |
| 64 KB | 3.2 | 3.5 | 20.0 |
| 1 MB | 8.9 | 9.4 | 112.4 |
| 10 MB | 78.5 | 82.3 | 127.4 |
| 100 MB | 768.2 | 801.5 | 130.2 |
| 1 GB | 7,650.0 | 7,980.0 | 131.0 |
For files above 1 MB, the encryption throughput is stable at about 130 MB/s (software AES256), reaching the upper limit of gigabit network bandwidth (125 MB/s), indicating that encryption is no longer a performance bottleneck. For small files smaller than 64 KB, the single-pass encryption overhead (3–4 ms) comes mainly from function calls and memory allocation overhead. The backup I/O impact tests are shown in Table 3.
Table 3 The backup I/O impact test table
| Amount | Read | Write | CPU | ||
| Backup | of | Backup | Performance | Performance | Usage |
| Type | Data | Duration | Degrades | Degrades | Increases |
| Full backup (compressed) | 2 TB | 4.2 hours | 23% | 18% | 35% |
| Full backup (uncompressed) | 2 TB | 8.5 hours | 28% | 22% | 12% |
| Incremental backup | 50 GB | 35 min | 8% | 10% | 8% |
Compressed backup uses more CPU (35% vs 12%), but takes half the time (4.2 h vs 8.5 h) and has a smaller window of impact on the business. It is recommended to perform a full backup during off-peak hours, such as 2:00–6:00 a.m. The measured storage expansion coefficient is shown in Table 4.
Table 4 Storage expansion factor
| Data Type | Original Size | Size After Encryption | Coefficient of Expansion |
| Student profile (JSON) | 50 MB | 67.5 MB | 1.35 |
| Teaching video (MP4) | 1 GB | 1.35 GB | 1.35 |
| PPT courseware | 500 MB | 675 MB | 1.35 |
| Database backup | 2 GB | 2.70 GB | 1.35 |
4.3.1 Verification of inflation coefficient consistency
The additional overhead of AES256-GCM mode (recommended for storage encryption) is fixed at 28 bytes (12 bytes IV 16 bytes authentication tag). For files larger than 1 KB, the inflation coefficient is stable at about 1.35, which is consistent with the theoretical value. In order to verify the effectiveness of the above threshold configuration, various abnormal behaviors are simulated and tested in the experimental environment. The test data set contains normal user behavior records (300 people 30 days) and artificially constructed abnormal behavior samples (1000 times for each type of abnormality). The test results are shown in Table 5. The detection accuracy of all abnormal types is more than 96%, and the false alarm rate is controlled within 2.5%.
Table 5 Anomaly detection threshold validation results
| Exception | Detection | False | Average Response |
| Type | Rate | Alarm Rate | Time (ms) |
| Brute force attack | 98.5% | 0.3% | 85 |
| Account sharing | 96.2% | 0.1% | 120 |
| Abnormal access time | 95.8% | 2.1% | 45 |
| Permission exception change | 97.3% | 0.5% | 68 |
| Data leak | 96.5% | 0.2% | 92 |
The threshold configuration recommended in this paper achieves a good balance between false alarm rate and detection rate, and can meet the actual needs of the production environment of educational institutions.
4.4 Upper Limit Test of High Concurrent Processing Capability of Gateway Layer
Because WAF detection, dynamic authorization, and secondary authentication are all deployed in the gateway layer, this node becomes the only entrance for request forwarding in the whole system. In order to evaluate the upper limit of its processing capacity under high concurrency scenarios, the performance test of a single gateway node under 1000 concurrent users is supplemented in Table 6.
Table 6 Test environment configuration
| Component | Configuration Parameters |
| Gateway node | 4 vCPU (Intel Xeon 2.5 GHz), 8 GB RAM, 100 GB SSD |
| Operating system | Ubuntu 22.04 LTS |
| Network bandwidth | 1 Gbps |
| Test tools | Apache JMeter 5.6 (distributed deployment, 3 pressure measuring machines) |
| Test scenarios | Simulated course selection peak: 80% inquiry request + 15% submission request + 5% certification request |
| Test duration | Each level of concurrent operation lasts for 10 minutes, and the average value of the last 5 minutes is taken |
The throughput and latency test results are shown in Table 7.
Table 7 Gateway lay performance metrics for different concurrency level
| Average | P95 | P99 | CPU | Memory | ||
| Concurrent | Throughput | Latency | Latency | Latency | Usage | Usage |
| Users | (req/s) | (ms) | (ms) | (ms) | (%) | (GB) |
| 50 | 1,850 | 027.0 | 042.5 | 058.3 | 32% | 2.1 |
| 100 | 2,350 | 042.5 | 068.3 | 089.2 | 45% | 2.4 |
| 250 | 3,120 | 080.1 | 125.6 | 168.4 | 62% | 2.9 |
| 500 | 3,850 | 129.8 | 210.4 | 285.7 | 78% | 3.5 |
| 750 | 4,010 | 187.2 | 325.8 | 442.3 | 89% | 4.1 |
| 1000 | 4,150 | 241.5 | 412.6 | 568.2 | 94% | 4.6 |
| 1250 | 4,180 | 312.8 | 528.4 | 725.6 | 97% | 5.2 |
Throughput reaches 3850 req/s at 500 concurrency and increases to 4010 req/s at 750 concurrency (an increase of only 4.2%), indicating that the system is close to saturation between 500 and 750 concurrency. The throughput at 1000 concurrency is 4150 req/s, an increase of only 3.5% compared to 750 concurrency, indicating that the processing cap has been reached. P99 latency increased from 285.7 ms at 500 concurrency to 568.2 ms at 1000 concurrency, nearly doubling, and the user experience declined significantly. The CPU footprint reaches 94% at 1000 concurrency, which is close to saturation; the memory footprint increases linearly with the number of concurrency, but is still within the acceptable range. Then we analyzed the packet loss rate and error rate test, as shown in Table 8.
Table 8 Packet loss rate and error rate at different concurrency levels
| Concurrent | Total | Successful | Failed | Packet Loss | Error |
| Users | Requests | Requests | Requests | Rate (%) | Rate (%) |
| 50 | 111,000 | 111,000 | 0 | 0.00 | 0.00 |
| 100 | 141,000 | 141,000 | 0 | 0.00 | 0.00 |
| 250 | 187,200 | 187,200 | 0 | 0.00 | 0.00 |
| 500 | 231,000 | 230,769 | 231 | 0.00 | 0.10 |
| 750 | 240,600 | 239,878 | 722 | 0.00 | 0.30 |
| 1000 | 249,000 | 246,759 | 2241 | 0.00 | 0.90 |
| 1250 | 250,800 | 246,285 | 4515 | 0.00 | 1.80 |
No requests failed below 500 concurrency (error rate 0%). The error rate was 0.10% at 500 concurrency, rose to 0.30% at 750 concurrency, and reached 0.90% at 1000 concurrency. The error rate climbed to 1.80% at 1250 concurrency, exceeding the 1% limit typically accepted in educational system production environments. During the test, there was no packet loss at the network layer (the packet loss rate was always 0), and all failures came from timeouts or connection rejections at the application layer.
5 Conclusion
This paper addresses key challenges in Web-based education management platforms, including the leakage of sensitive student data, inadequacy of traditional boundary protection, and difficulty in cross-role authority management. Guided by the principle of “never trust, always verify,” a ZTA is designed and implemented to support full-lifecycle protection of educational data. The architecture integrates the URRO permission model to establish three-dimensional authentication (identity, device, behavior), enabling fine-grained access control. A dual “signature behavior” detection mechanism strengthens attack protection, while hotspot permission caching and hardware acceleration balance security and performance. Distributed deployment and blockchain traceability ensure log traceability and support multi-department collaboration.
Experimental results demonstrate high security. Across tests in 10 school departments, the blocked unauthorized access rate stabilized at 97.0% (covering student privilege escalation, teacher privilege escalation, and session hijacking), with abnormal authentication accuracy at 96.0% and permission matching accuracy at 96.0%. The false positive and false negative rates were as low as 0.3% and 0.2%, respectively, and average response time was 68 ms during multi-terminal concurrent queries. Two limitations were identified. First, the performance evaluation in this study was conducted with a maximum of 50 concurrent users (limited by the test environment). While the system maintained stable performance under this load (maximum response time 4.2 ms, average authentication time 189 ms at 1300 training iterations), extrapolation analysis suggests that performance may degrade when concurrency exceeds 50. This hypothesis requires validation through dedicated high-concurrency testing (100 users) in future work. Second, the architecture performs poorly on low-configuration campus edge terminals due to high resource consumption by encryption and authentication modules. Future work will focus on architecture optimization, improved task allocation, and better adaptability for low-configuration terminals.
References
[1] Y. Zhang, Privacy-preserving with zero-trust computational intelligent hybrid technique to English education model. Appl. Artif. Intell., vol. 37, no. 1, pp. 1–10, 2023. doi: 10.1080/08839514.2023.2219560.
[2] Z. Tang, Intelligent construction of Web-based environmental education system in universities. J. Cases Inf. Technol., vol. 28, no. 1, pp. 1–20, 2026. doi: 10.4018/jcit.404699.
[3] A. M. Arabi, A. D. Ogundijo, and T. E. Nyamasvisva, A zero-trust model-based framework for managing of academic dishonesty in institutes of higher learning. Turk. J. Comput. Math. Educ., vol. 12, no. 6, pp. 5381–5389, 2021.
[4] X. Wang, V. Bhuse, and Y. Cheng, A zero-trust module for cybersecurity education. J. Colloq. Inf. Syst. Secur. Educ., vol. 12, no. 1, 2025.
[5] M. A. Perkins and B. A. Akorede, Tracking K-12 and higher education job postings through Web-scraped longitudinal data. Data, vol. 11, no. 3, Art. no. 52, 2026. doi: 10.3390/data11030052.
[6] A. Fadlil, I. Riadi, and M. A. Mu’Min, Mitigation from SQL injection attacks on Web server using Open Web Application Security Project framework. Int. J. Eng., vol. 37, no. 4, pp. 635–645, 2024.
[7] K. D. Woo, S. J. Han, K. C. Lee, and S. H. Oh, A study on zero-trust security model for public education network based on ARC access control policy. Converg. Secur. J., vol. 24, no. 5, pp. 145–154, 2024. doi: 10.33778/kcsa.2024.24.5.145.
[8] A. M. Akram and I. Ahmed, Securing eye-gaze technology in smart classrooms: A zero-trust, cloud-native framework for inclusive education. Proc. 2026 Int. Conf. AI Innov. Ind. (ICAIII), 2026.
[9] R. Albaghli, A. Beidas, and N. Attar, Corrigendum to “Eyes on higher education: Evaluating Web usability in Kuwaiti private universities using eye-tracking and SUPR-Q metrics”. J. Eng. Res., vol. 14, no. 1, 2026. doi: 10.1016/j.jer.2025.12.023.
[10] P. Vajpayee, B. Anderson, and G. Hossain, Zero-Trust and cyber risk modeling for intelligent school transportation systems (ISTS). Proc. 2025 IEEE Int. Carnahan Conf. Secur. Technol. (ICCST), 2025.
[11] B. Paul and M. Rao, Zero-Trust model for smart manufacturing industry. Appl. Sci., vol. 13, no. 1, Art. no. 221, 2022. doi: 10.3390/app13010221.
[12] M. A. Islam, Zero-Trust security and FERPA aligned data governance for higher education Web systems with identity centric access control secure APIs and tamper evident audit logging. Research Square, pp. 1–18, 2026, doi: 10.21203/rs.3.rs-9915310/v1.
[13] S. J. Coetzee and L. V. Mulaudzi, Exploring the educational potential of free Web 3.0 resources for training technology students in higher education. Discover Educ., vol. 5, no. 1, Art. no. 175, 2026. doi: 10.1007/s44217-026-01207-1.
[14] P. V. Zahorodko and S. O. Semerikov, Integrating agile methodologies and AI-assisted learning in Web programming education: A theoretical framework for CS curriculum transformation. Discover Educ., vol. 5, no. 1, Art. no. 166, 2026. doi: 10.1007/s44217-026-01179-5.
[15] J. Kim, H. Kim, J. Yun, et al., CoDeF: A Web-based education platform for system-level design of unmanned vehicles. SoftwareX, vol. 33, Art. no. 102471, 2026. doi: 10.1016/j.softx.2025.102471.
[16] J. Liu, S. Zhang, Q. Wang, et al., Coordinating fast concurrency adapting with autoscaling for SLO-oriented Web applications. IEEE Trans. Parallel Distrib. Syst., vol. 33, no. 12, pp. 3349–3362, 2022. doi: 10.1109/TPDS.2022.3169795.
[17] M. Tsai, S. Lee, and S. W. Shieh, Strategy for implementing of zero-trust architecture. IEEE Trans. Rel., vol. 73, no. 1, pp. 93–100, 2024. doi: 10.1109/TR.2023.3289300.
[18] S. Teerakanok, T. Uehara, and A. Inomata, Migrating to zero-trust architecture: Reviews and challenges. Secur. Commun. Netw., vol. 2021, Art. no. 9947347, 2021. doi: 10.1155/2021/9947347.
Biography

Baowang Yang was born in 1983 in Zhejiang Province, China. He studied at Ningbo University from 2003 to 2007 and received his bachelor’s degree in 2007. He studied at Zhejiang University from 2010 to 2014 and received his master’s degree in 2014. Since 2007, he has been working in the College of Science and Technology of Ningbo University. He has published several papers, one of which was included by EI. His research interests include computer algorithms.
Journal of Web Engineering, Vol. 25_7, 1319–1348
doi: 10.13052/jwe1540-9589.2573
© 2026 River Publishers