Applying Importance-Performance Analysis (IPA) to Interpret the Results of the User Experience Questionnaire (UEQ)
Andreas Hinderks1,*, Anna-Lena Meiners2, Francisco José Domínguez-Mayo1 and Jörg Thomaschewski2
1Department of Computer Languages and Systems, University of Seville, Seville, Spain
2University of Applied Sciences Emden/Leer, Germany
E-mail: andreas.hinderks@iwt2.org; meiners@ux-researchgroup.com; fjdominguez@us.es; joerg.thomaschewski@hs-emden-leer.de
* Corresponding Author
Received 19 December 2019; Accepted 14 April 2020; Publication 03 June 2020
Abstract
In recent years, user experience questionnaires have established themselves to measure various aspects of User Experience (UX). In addition to these questionnaires, an evaluation tool is usually offered so that the results of a study can be evaluated in the light of the questionnaire. As a rule, the evaluation consists of preparing the data and comparing it with a benchmark. Often this interpretation of the data is not sufficient as it only evaluates the current User Experience. However, it is desirable to determine exactly where there is a need for action. The User Experience Questionnaire (UEQ) is a common and valid questionnaire with an evaluation tool to measure and analyse the User Experience for a product or service. In our article we present an approach that evaluates the results from the User Experience Questionnaire using the importance-performance analysis (IPA). The aim is to create another possibility to interpret the results of the UEQ and to derive recommendations for action from them. In a study with 467 participants, we validated the approach presented with YouTube, WhatsApp, and Facebook. The results show that the IPA provides additional insights from which further recommendations for action can be derived.
Keywords: Importance-performance analysis, IPA, user experience, UX factors, User Experience Questionnaire, UEQ.
1 Introduction
Today’s users expect a high level of satisfaction while interacting with a product. Users expect to be able to use the product without any major effort to solve their tasks in a quick and efficient manner. Questionnaires are used to measure and evaluate the user experience of products and services, because UX questionnaires are a common quantitative way to measure of user experience [17]. There are numerous UX questionnaires in the literature, such as the Visual Aesthetics of Websites Inventory (VisAWI) [19], Standardized User Experience Percentile Rank Questionnaire (SUPR-Q) [25] or the User Experience Questionnaire (UEQ) [16]. One aim of using a UX questionnaire is the request to derive recommendations for development in order to improve the product.
A well-known definition of user experience is given in ISO 9241-210 [14]. Here user experience is defined as “a person’s perceptions and responses that result from the use or anticipated use of a product, system or service”. Thus, user experience is seen as a holistic concept that includes all types of emotional, cognitive or physical reactions concerning the concrete or even only the assumed usage of a product formed before, during and after use. However, the standard does not provide a definite list of factors or methods to measure user experience.
A different interpretation is to define user experience as a set of distinct quality criteria [24] that includes classical usability criteria or pragmatic qualities such as efficiency, controllability or learnability; and non-goal directed or hedonic quality criteria [9] such as stimulation, fun-of-use, novelty, emotions [20], or aesthetics [29]. This has the advantage that it splits the general notion of user experience into a number of simple quality criteria, which describe distinct and relatively well-defined aspects of user experience that can be measured independently.
Questionnaires that measure the user experience take into account this complexity, since they usually compute values on different UX scales. A scale corresponds to a content-delimited quality characteristic of user experience, e.g. efficiency or originality. Depending on the questionnaire, different combinations of quality characteristics are measured. Standardized questionnaires are not a more or less random or subjective collection of questions, but result from a careful construction process. This process guarantees accurate measuring of the intended UX qualities. But on the other hand, in [13] we have been able to show that none of the established questionnaires can measure user experience to its full extent, and that employing the studied questionnaires is not equally reasonable for all products. A standardized questionnaire is always limited to the factors it measures.
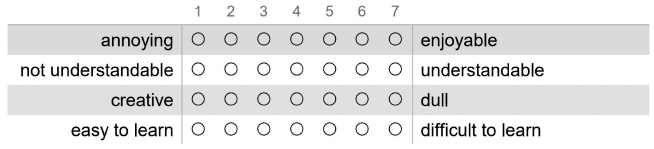
Figure 1 User Experience questionnaire – item example.
The method presented in this paper is based on the User Experience Questionnaire (UEQ) [16] and shows how to interpret the results from the UEQ by conducting an importance-performance analysis. The UEQ is a frequently used questionnaire to measure the subjective user experience of interactive products. Each item of the UEQ consists of a pair of antonyms (see Figure 1).
Participants can rate each item on a 7-point Likert scale. The answers are scaled from −3 (fully agree with negative term) to +3 (fully agree with positive term). Half of the items start with the positive term, the others with the negative term (in randomized order).
We decided to use the UEQ because it is a well-known UX questionnaire and it is available in more than 20 languages, an Excel sheet for data analysis, and the UEQ Handbook are available free of charge.1 The objective of the UEQ is to allow a quick assessment done by end users covering a preferably comprehensive impression of user experience. It allows the users to express feelings, impressions, and attitudes that arise when experiencing the product under investigation in a very simple and immediate way. It consists of 26 items that are grouped into six scales (Attractiveness, Perspicuity, Efficiency, Dependability, Stimulation, and Novelty). Each scale represents a distinct UX quality aspect. A modular extension of the ‘User Experience Questionnaire’ is the UEQ+ [26]. This new version of the UEQ (called UEQ+2) has a modular structure so that the UX scales can be selected individually from a list for each test object. In this paper, we use the UEQ and UEQ+ with a selected list of UX factors that fits to the test objects.
The UEQ offers various options for interpreting the data. For example, the scales as well as the associated items can be interpreted individually. For each scale, there is also a benchmark that allows comparison with other data [27].
Another approach is the importance-performance analysis (IPA) [18]. An IPA measures customer satisfaction and presents it graphically so that recommendations for action can be made. Customer satisfaction is determined by querying the perceived importance and performance for a set of attributes. The result is displayed graphically in a plot. The recommendations for action are derived from the arrangement in the plot.
In this article, we present an additional study based on our method and first study [12] to interpret the results from the UEQ by conducting an importance-performance analysis (IPA). We want to determine whether the use of the importance-performance analysis can be repeated in principle.
Section 2 surveys the background and related work regarding the IPA. Section 3 outlines our method to interpret the results from the UEQ by conducting an IPA. Furthermore, we describe a first study to validate our method. In Section 4 we present the results of our study. Section 5 discusses the results of our study.
2 Background and Related Work
As already described in the introduction, the importance-performance analysis (IPA) is one way of graphically representing the relationship between importance and performance for a set of attributes in a plot [18].
There is no prescribed list of attributes for performing an IPA. The list of attributes must be determined during the concrete study [18]. In the literature, there are already proposals for selected products, for instance, Websites for airline companies [22] or Internet stores [23]. Another approach is to extract the items or scale from an existing questionnaire. Tontini [28] has taken the items from the questionnaire e-SERVQUAL and used them as a set of attributes to evaluate online shopping sites. Also, there are various ways of creating a list of attributes.
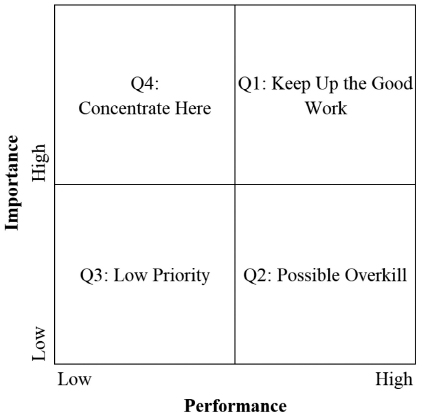
Figure 2 The Quadrants of the IPA Plot [18].
The measurement of importance and performance is usually performed by directly putting the attributes on a seven-point rating scale, one item for importance, and one item for performance [1, 2]. There are other methods that derive importance indirectly from the results of performance [3], for example, through multivariate regression analysis [7] or a conjoint analysis [6]. This would have the advantage that only one item would have to be queried for importance and performance. The disadvantage, however, is the more reduced data quality [3]. In practice, direct measurement with two items per attribute has mostly established itself [3].
The values from the items for each attribute are displayed in the IPA plot (Figure 2), where each attribute is assigned a point. The point is calculated by the value of the performance (x-axis) and importance (y-axis). The aim is to derive recommendations for action for each quadrant. The recommendation for action is derived from the relationship between importance and performance [18]. The underlying assumption is that a user is satisfied if his perceived importance is fulfilled. A measure of fulfilment is the value of performance.
The plot is typically divided into four quadrants (Figure 2) [18]:
- Q1: “Keep Up the Good Work”
- Q2: “Possible Overkill”
- Q3: “Low Priority”
- Q4: “Concentrate Here”
Figure 2 shows the four quadrants of the original IPA plot [18]. There are some illustrations in the literature where the axes are not in the same position. In this paper, we use the original usage of the axes of the IPA.
The first quadrant (“Keep Up the Good Work”) represents great strengths and potential competitive advantages of a product or service. The user rates both the importance and the performance of the product equally highly. This means that there is no need for action for these attributes as they are balanced between importance and performance.
Attributes from quadrant 2 (“Possible Overkill”) are rated relatively low by the user in the case of importance compared to performance. So importance is below performance, which means that the attributes are sufficiently developed. Further development of these attributes is, therefore, not necessary and would be inefficient since importance was more than fulfilled [8].
Attributes that fall under quadrant 3 (“Low Priority”) are rated relatively low by the user both in terms of importance and performance. This means that no action is required for these attributes since both are balanced.
The fourth quadrant (“Concentrate Here”) is the most important. Attributes from this quadrant are considered relatively important while performance is rated below average. These attributes offer the highest potential for perceptible improvement of the product. Further development of the product should, therefore, concentrate on these attributes.
3 Research Methodology
In this section, we will describe our approach in detail. The main idea behind our approach is to collect an additional dataset with the UEQ+ and then conduct an IPA with this dataset. In summary, we can use the results from both studies (the study from [12] and the new study from this paper) and we use the IPA to interpret the datasets. Our approach is divided into three different steps:
- Step 1: Determine the attributes of the IPA.
- Step 2: Selection of the questionnaire to gather the dataset for the IPA.
- Step 3: First evaluation of the method from Step 2 by conducting a study with YouTube, WhatsApp, and Facebook.
The different steps are explained in more detail in the next three paragraphs.
3.1 Determine the attributes
There are no specifications as to how the attributes should be determined or selected (Section 2). Attributes should only represent quality criteria for the product [18]. For this reason, we have decided to use the UX scales of the UEQ as attributes for IPA.
For the IPA plot, data for the importance and performance for the particular set of attributes are required. The UEQ collects both the performance and importance. The performance is the actual value of the particular scale of the UEQ. The importance is additionally queried for each scale to calculate a UX KPI [11].
3.2 Selection of the questionnaire
The original UEQ consists of six UX scales Attractiveness, Perspicuity, Efficiency, Dependability, Stimulation, and Novelty [16]. A modular extension of the ‘User Experience Questionnaire’ is the UEQ+ [26]. This new version of the UEQ (called UEQ+) has a modular structure so that the UX scales can be selected individually from a list for each test object. Step 1 is thus fulfilled. In the first evaluation, we used both questionnaires, which are described in the next section.
3.3 First evaluation
The following study is intended to provide fundamental insights into our approach. We evaluated three products (YouTube, WhatsApp and Facebook) with two different versions of the UEQ (UEQ+ and UEQ) (Figure 3).
For the UEQ+ we selected the following scales from the proposed list Intuitive Use, Quality of Content, Reliability of Content, Trust, and Stimulation. The two versions of the UEQ (UEQ+ and UEQ) measure both performance and importance.
3.3.1 Object of study
In this study, products with a high level of awareness were evaluated to ensure that the participants could assess the products. The test objects selected were YouTube, WhatsApp, and Facebook.
3.3.2 Purpose
The purpose of this study is to validate the use of IPA using the results from UEQ (UEQ and UEQ+). The results should provide an understanding of the implementation of the IPA and the UEQ. It is to be determined whether the implementation of an IPA with the data of the UEQ provides good and interpretable results.
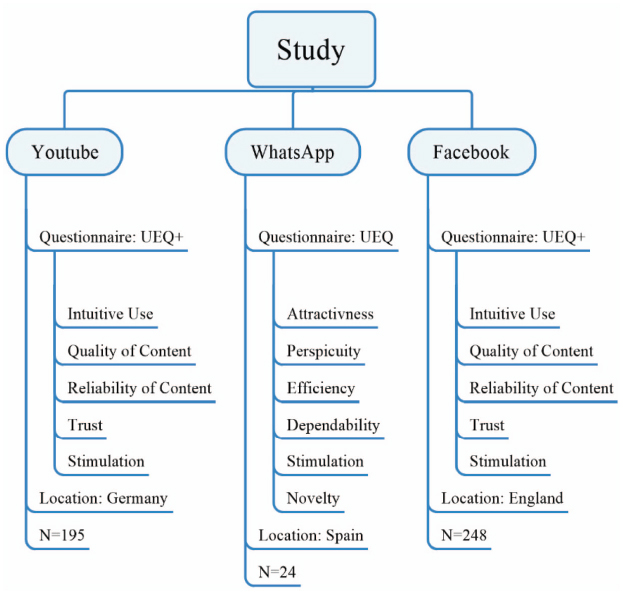
Figure 3 Overview of the study.
3.3.3 Quality focus
The main focus of the study is on validating the method by evaluating YouTube, WhatsApp and Facebook. Here two specific aspects are emphasized. The choice is to focus on the confidence and scale consistency for every scale.
3.4 Context
The study was been conducted in Germany for YouTube, in Spain for WhatsApp, and England for Facebook through online and paper versions of the questionnaire. We collected the German dataset from the University of Applied Sciences Emden/Leer. For the English dataset, we have choosen a social panel (Prolific Academic13) to collect the data. A total of 467 participants took part in the study. In addition to the UEQ, we also asked for their age and gender. Furthermore, we asked how often they use the YouTube, WhatsApp, or Facebook. We wanted to determine whether the intensity of use affects the result.
Table 1 Number of participants
| Test Object | Country | Total | |
| YouTube | Germany | 195 | (65 females, 123 males) |
| Spain | 24 | (5 females, 18 males) | |
| England | 248 | (132 females, 112 males) | |
| Total | 467 |
Table 2 Results from the UEQ+ for YouTube (Germany) [12]
| Performance |
Importance |
|||||
| Scale | UEQ+ | Std.D. | Conf. | IMP | Std.D. | Conf. |
| Intuitive Use (INU) | 1.736 | 1.388 | 0.195 | 0.933 | 1.639 | 0.230 |
| Quality of Content (QOC) | 1.249 | 1.377 | 0.193 | 1.267 | 1.509 | 0.212 |
| Reliability of Content (ROC) | 0.542 | 1.266 | 0.178 | 0.897 | 1.495 | 0.210 |
| Trust (TRU) | −0.363 | 1.594 | 0.224 | 1.077 | 1.549 | 0.217 |
| Stimulation (STI) | 0.854 | 1.388 | 0.195 | 0.938 | 1.354 | 0.190 |
Moreover, the participants assured us that they had used the product at least once a month. The remaining answers were divided into 195 for YouTube, 24 for WhatsApp, and 248 for Facebook (Table 1).
The average age is 32 years (31 for woman, 32 for men) for the German dataset, 23 years (22 for woman, 23 for men) for the Spanish dataset, and 30 years (32 for woman, 28 for men) for the English dataset.
4 Results
Thus, overall the participants had a slightly positive (> 1) or neutral (> −1 and < 1) impression concerning the user experience of YouTube (Table 2), WhatsApp (Table 3) and Facebook (Table 4). During the evaluation, we did not find any significant differences between men and women.
In Tables 2–4 the values for each scale are performance (UEQ value), and estimated importance, respectively. For each scale, the standard deviation and confidence are added.
Table 3 Results from the UEQ for WhatsApp (Spain) [12]
| Performance |
Importance |
|||||
| Scale | UEQ+ | Std.D. | Conf. | IMP | Std.D. | Conf. |
| Attractiveness (ATT) | 1.722 | 0.553 | 0.221 | 1.875 | 1.154 | 0.462 |
| Perspicuity (PER) | 1.813 | 0.805 | 0.322 | 1.958 | 1.459 | 0.584 |
| Efficiency (EFF) | 1.635 | 0.516 | 0.206 | 2.375 | 1.096 | 0.438 |
| Dependability (DEP) | 1.267 | 0.651 | 0.260 | 2.083 | 0.881 | 0.352 |
| Stimulation (STI) | 1.000 | 0.699 | 0.280 | 1.375 | 1.583 | 0.633 |
| Novelty (NOV) | 0.281 | 1.025 | 0.410 | 1.292 | 1.429 | 0.572 |
Table 4 Results from the UEQ+ for Facebook (England)
| Performance |
Importance |
|||||
| Scale | UEQ+ | Std.D. | Conf. | IMP | Std.D. | Conf. |
| Intuitive Use (INU) | 1.391 | 1.551 | 0.193 | 0.980 | 1.635 | 0.203 |
| Quality of Content (QOC) | 0.770 | 1.588 | 0.198 | 0.976 | 1.665 | 0.207 |
| Reliability of Content (ROC) | 0.129 | 1.648 | 0.205 | 1.419 | 1.629 | 0.203 |
| Trust (TRU) | −0.664 | 1.770 | 0.220 | 1.657 | 1.434 | 0.178 |
| Stimulation (STI) | 0.530 | 1.450 | 0.180 | 0.278 | 1.601 | 0.199 |
The confidence (alpha = 0.05) is derived from the sample size and the standard deviation so that we will only consider the confidence at this point. The confidence for YouTube is between 0.178 and 0.224 and Importance between 0.190 and 0.230, for WhatsApp between 0.206 and 0.410 and Importance between 0.352 and 0.633, for Facebook between 0.180 and 0.220 and Importance between 0.178 and 0.207.
The values for the confidence of the three studies correspond to our experience and are mostly dependent on the sample size. For WhatsApp, the sample size with N = 24 is rather small, resulting in higher confidence. Figures 4–6 are the graphical interpretation of the values from Tables 2–4. The red bar (left) for each scale denotes performance and the blue bar (right) importance. The error bar represents confidence.
4.1 Reliability
Reliability is typically estimated using the standardized Cronbach Alpha coefficient [21]. The Cronbach’s Alpha is a measure of the internal consistency of a questionnaire dimension [5]. An analysis of the Cronbach Alpha coefficient showed that the single scales showed high consistency values for YouTube (INU: 0.93, QOC: 0.81, ROC: 0.89, TRU: 0.91, STI: 0.84). This is an indicator that the scales are sufficiently consistent [5]. For WhatsApp, the Cronbach’s Alpha coefficient showed high consistency values except Efficiency, Dependability, and Stimulation (ATT: 0.75, PER: 0.75, EFF: 0.35, DEP: 0.41, STI: 0.27, NOV: 0.74). Due to the small group of participants for WhatsApp, the result was as expected. For Facebook, the Cronbach’s Alpha coefficient showed consistency for every single scale (INU: 0.79, QOC: 0.85, ROC: 0.91, TRU: 0.95, STI: 0.89). There is no general rule about how large the value should be. In practice, however, a value of > 0.7 has proved to be sufficient [15].
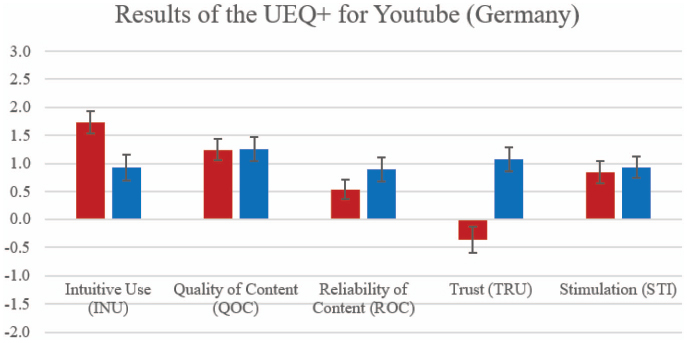
Figure 4 Results from the UEQ+ for YouTube (Germany).
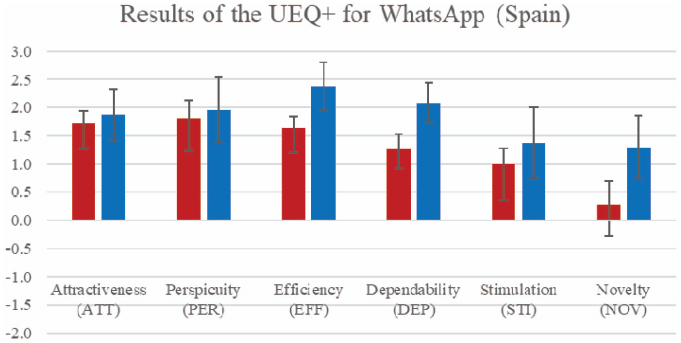
Figure 5 Results of the UEQ for WhatsApp (Spain).
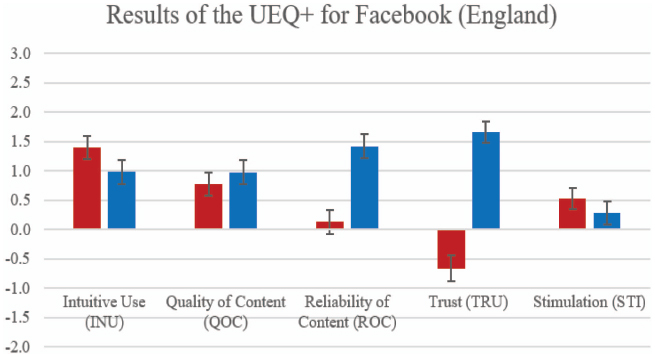
Figure 6 Results of the UEQ+ for Facebook (England).
4.2 Importance-performance analysis
Our approach presented in Section 3 was used to conduct an IPA. Figures 7–9 show the IPA plot for YouTube, WhatsApp and Facebook. Each point in the IPA plot represents a scale calculated from the values for performance and importance. The coordinate axes with the dotted line have the coordinate origin in the scale centre (0,0). On the other hand, the solid coordinate axes have their coordinate origin in the mean value of all displayed scales. The coordinate axes are necessary for the interpretation of the scales to form the corresponding quadrants. From the IPA plot, the scales can be assigned to the respective quadrant. The overview of the assignment is shown in Tables 5–7.
For each scale, the corresponding quadrants were determined from the IPA evaluations. Values touching an axis were printed in italics. In this case, the determined quadrant can change. A different quadrant can also be determined to take into account the confidence interval. This is not part of the analysis.
4.3 Analysis of intensity of use
An analysis of the intensity of use was carried out based on statements made by the participants on the question of how often they use the product. Since the dataset for WhatsApp is quite small with N = 24, we did not carry out an analysis with this dataset. The YouTube dataset did not differ from the individual user groups. There are minimal shifts, all of which are within the confidence interval.
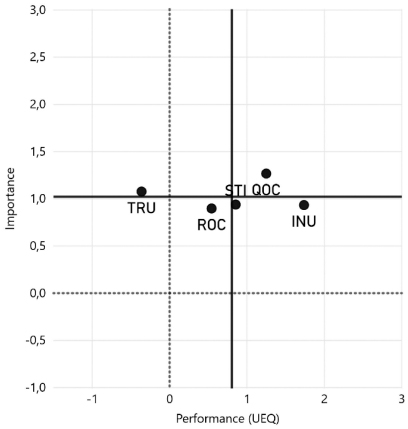
Figure 7 Results from the IPA for YouTube (Germany) [12].
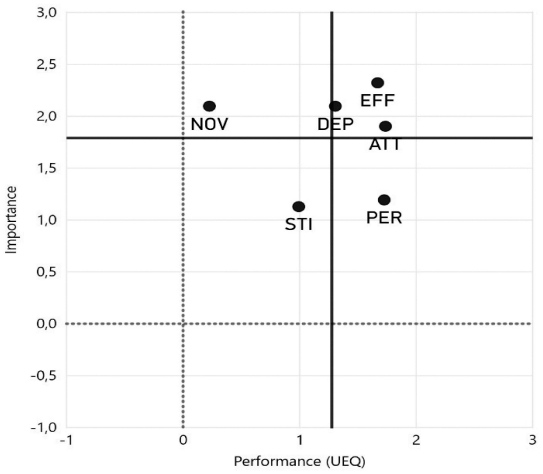
Figure 8 Results of the IPA for WhatsApp (Spain) [12].

Figure 9 Results of the IPA for Facebook (England).
Table 5 Assignment Scales to IPA Quadrants for YouTube (Germany) [12]
| Scale | Scale Centre (0,0) | Scale Centre Avg |
| INU | Q1: Keep Up the Good Work | Q2: Possible Overkill |
| QOC | Q1: Keep Up the Good Work | Q1: Keep Up the Good Work |
| ROC | Q1: Keep Up the Good Work | Q3: Low Priority |
| TRU | Q4: Concentrate Here | Q4: Concentrate Here |
| STI | Q1: Keep Up the Good Work | Q2: Possible Overkill |
Table 6 Assignment Scales to IPA Quadrants for WhatsApp (Spain) [12]
| Scale | Scale Centre (0,0) | Scale Centre Avg |
| ATT | Q1: Keep Up the Good Work | Q1: Keep Up the Good Work |
| PER | Q1: Keep Up the Good Work | Q1: Keep Up the Good Work |
| EFF | Q1: Keep Up the Good Work | Q1: Keep Up the Good Work |
| DEP | Q1: Keep Up the Good Work | Q1: Keep Up the Good Work |
| STI | Q1: Keep Up the Good Work | Q3: Low Priority |
| NOV | Q1: Keep Up the Good Work | Q4: Concentrate Here |
Table 7 Assignment Scales to IPA Quadrants for Facebook (England)
| Scale | Scale Centre (0,0) | Scale Centre Avg |
| INU | Q1: Keep Up the Good Work | Q2: Possible Overkill |
| QOC | Q1: Keep Up the Good Work | Q2: Possible Overkill |
| ROC | Q1: Keep Up the Good Work | Q4: Concentrate Here |
| TRU | Q4: Concentrate Here | Q4: Concentrate Here |
| STI | Q1: Keep Up the Good Work | Q2: Possible Overkill |
Table 8 t-test (alpha level 0.5) Facebook – performance
| Scale | t | Category |
| Intuitive Use (INU) | 0.00000 | Significant Difference |
| Quality of Content (QOC) | 0.00001 | Significant Difference |
| Reliability of Content (ROC) | 0.00004 | Significant Difference |
| Trust (TRU) | 0.00001 | Significant Difference |
| Stimulation (STI) | 0.00000 | Significant Difference |
Table 9 t-test (alpha level 0.5) Facebook – importance
| Scale | t | Category |
| Intuitive Use (INU) | 0.00000 | Significant Difference |
| Quality of Content (QOC) | 0.00309 | Significant Difference |
| Reliability of Content (ROC) | 0.67955 | No Significant Difference |
| Trust (TRU) | 0.50248 | No Significant Difference |
| Stimulation (STI) | 0.00042 | Significant Difference |
The Facebook dataset, on the other hand, consists of two different datasets. The first dataset consists of participants who use Facebook every day (N = 188). While the second dataset consists of participants who use Facebook several times a week, several times a month or less (N = 60). To determine that the two data sets can also be viewed independently of each other, a t-test was carried out.
The t-test (alpha-level 0.5) was used to test the independence of both the performance (Table 8) and importance (Table 9) of the two datasets [10]. The results show that all the scales measuring the performance are independent of each other (t < 0.00005). The scale reliability of content (ROC) and trust (TRU) from the important values is not independent (t > 0.5). All other scales, however, are independent (t < 0.004).
The IPA plot has shown that the two datasets differ from each other. Figure 10 shows the IPA plot for the participant who use Facebook every day, while Figure 11 displays the participants who do not use Facebook every day.
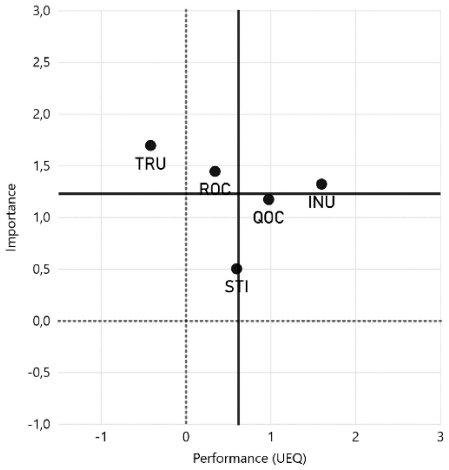
Figure 10 Results of the IPA for Facebook – uses Facebook every day.
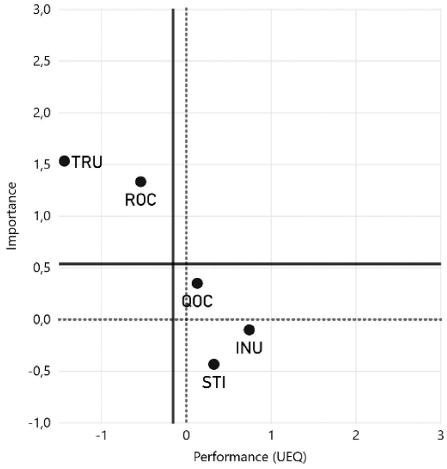
Figure 11 Results of the IPA for Facebook – uses Facebook not every day.
Table 10 Assignment Scales to IPA Quadrants for Facebook
| Scale | Scale Centre Avg Uses Facebook every day | Scale Centre Avg Uses Facebook not every day |
| INU | Q1: Keep Up the Good Work | Q2: Possible Overkill |
| QOC | Q2: Possible Overkill | Q2: Possible Overkill |
| ROC | Q4: Concentrate Here | Q4: Concentrate Here |
| TRU | Q4: Concentrate Here | Q4: Concentrate Here |
| STI | Q3: Low Priority | Q2: Possible Overkill |
In Table 10 the for each scale, the corresponding quadrants were determined from the IPA plot Figures 10 and 11.
5 Discussion
The idea behind the IPA is to assign the individual scales to four different quadrants. Each quadrant then provides a recommendation for action for the respective scale (Section 2). In practice, there are two established methods for defining the quadrants [3].
- Method 1: Differentiation by the coordinate origin at (0,0) (dotted line in Figures 7–9).
- Method 2: Differentiation by the coordinate origin in the mean value of all scale values. (solid line in Figures 7–9).
According to Method 1, there is potential for improvement in the scale Trust for YouTube (Q4: Concentrate Here). All other scales have been classified on YouTube in such a way that there is no need for action (Q1: Keep Up the Good Work). For WhatsApp, there is no need for action on any scale (Q1: Keep Up the Good Work). Regarding Facebook, there is a potential for improvement in the scale Trust (Q4: Concentrate Here).
In our analysis, we determined that classification according to Method 1 is not optimally usable for our approach. Method 1 assumes that participants will give a neutral rating of 0 (in the value range -3 and 3). It has been shown that in practical use, a neutral rating is more likely to be above 0, as the UEQ benchmark shows [27]. In this respect, the usability of Method 1 is limited.
When using Method 2, the scales Intuitive of Use (INU) and Stimulation (STI) on YouTube are exceeded (Q2: Possible Overkill). The same applies to the scales Intuitive of Use (INU), Quality of Content (QOC), and Stimulation (STI) at Facebook. This means that there is no potential for improvement for these scales, as the expectations of the users are more than fulfilled.
For the scales Reliability of Content (ROC) at YouTube and Stimulation (STI) at WhatsApp, the scales are balanced so that there is no need for action (Q3: Low Priority). For these scales, the value for performance and importance are low. The same applies to the scales Quality of Content (QOC) for YouTube and Attractiveness (ATT), Perspicuity (PER), Efficiency (EFF), and Dependability (DEP) for WhatsApp (Q1: Keep Up the Good Work). The only difference is that the performance and importance were relatively highly rated. After all, these scales are also balanced.
The scales Trust (TRU) at YouTube, Novelty (NOV) at WhatsApp, and Reliability of Content (ROC) and Trust (TRU) at Facebook were ranked relatively low in terms of importance compared to the performance (Q4: Concentrate Here). This means that the user feels that these two scales are important, but are currently not being satisfactorily met. As a recommendation for action, it can be recommended that these factors have to be improved.
In summary, it can be pointed out that Method 2 can give better statements regarding options for action in connection with the UEQ.
The results of the intensity of the use analysis showed that the dataset from Facebook consists of two sub-datasets. The two sub-datasets are not the same, except for the importance of Trust (TRU) and Reliability of Content (ROC). So, there are no differences depending on the intensity of use in evaluating the importance of Trust (TRU) and Reliability of Content (ROC). This is also in line with the results of [4].
The evaluation of the importance of Trust (TRU) is similarly high for both sub-datasets (everyday 1.70, not everyday 1.53), whereas the evaluation of performance differs significantly (everyday −0.42, not everyday −1.44). A similar result can also be derived from the values for Reliability of Content (ROC) with regard to importance (everyday 1.45, not everyday 1.33) and performance (everyday 0.3, not everyday −0.54). Obviously, both groups rate the importance similarly high, but the performance differs strongly from each other. One explanation is that a positive evaluation or perception of the other scales like Quality of Content (QOC), Stimulation (STI), or Intuitive Use (INU) outweigh the negative influence of perceived Trust (Chang 2017). In further studies, it should be checked whether the present correlation of the scales is generally valid and repeatable.
5.1 Comparing UEQ analysis and IPA
The analyses by the UEQ do not offer any recommendations for action. However, it is a good idea to compare the values for performance and importance directly. If the importance is higher than the performance, this scale should be improved. If this approach is applied to our studies, the Reliability of Content (ROC) and Trust (TRU) scale on YouTube should be improved. At WhatsApp, the scales Efficiency (EFF), Dependability (DEP), Stimulation (STI) and Novelty (NOV) should be improved. And at Facebook, the scales Quality of Content (QOC), Reliability of Content (ROC), and Trust (TRU) should be improved.
Comparing the results from Methods 1 and 2 with these results, there are differences, which can be traced back to the IPA method itself. IPA considers the results from the UEQ relative to each other. This means that it is not the absolute difference between performance and importance that is relevant, but the relative difference to each other.
5.2 Enhancement of our approach
The results from Section 4 suggest that the IPA can be used with the results from the UEQ. In principle, this approach should also work for other questionnaires, which contain several scales clearly separated from each other in content. However, the UX questionnaire must measure both performance and importance. Otherwise our approach with the questionnaire is not usable. Alternatively, other methods that device importance indirectly from the results of performance [3], for example, through multivariate regression analysis [7] or a conjoint analysis [6], can be used.
5.3 Limitations
The approach presented in this paper could be validated in a study with three different products. Further studies with other products should confirm the validity. In the study, it could not be validated whether the derived recommendations for action are suitable for practical use. This should be verified in further studies.
6 Conclusion and Future Work
In this paper, we presented an approach that analyses results from the User Experience Questionnaire (UEQ) using the importance-performance analysis (IPA). Our approach assigns the different scales of the UEQ to four different quadrants of the IPA plot. Each quadrant is assigned to a recommended course of action: Q1: ‘Keep Up the Good Work’, Q2: ‘Possible Overkill’, Q3: ‘Low Priority’, Q4: ‘Concentrate Here’. We were able to validate this method in a study, in three countries, with a total of 467 participants, by evaluating YouTube, WhatsApp and Facebook.
Our approach offers, in addition to the UEQ, another possibility to interpret the results of the UEQ. This can be useful for practical purposes and provides additional support for UEQ users. Furthermore, the IPA offers the possibility to visualize the relation between the performance (UEQ value) and its importance for each scale. On this visualization, it is possible to divide the IPA into the four quadrants as mentioned above. During the evaluation of the study with three products, Method 2—i.e. the centre of the coordinate system—must not be placed in the scale cent (0.0), but in the scale centre average. The resulting IPA plot shows a result that can be interpreted in a better way.
Besides, the IPA could be used to determine sub-datasets from the Facebook dataset. This added value to the existing IPA analysis. In practice, it must be shown whether additional insights can be gained with the IPA.
Further research could examine whether our approach can be implemented in an organization. However, it is necessary to validate our approach and implement it in a company in a real situation. Interpretability and acceptance should be emphasized. Also, it could determine whether our approach meets all requirements for practical usage.
1www.ueq-online.org
2http://ueqplus.ueq-research.org/
3https://www.prolific.co/
References
[1] Abalo J, Varela J, Manzano V (2007) Importance values for Importance-Performance Analysis: A formula for spreading out values derived from preference rankings. Journal of Business Research 60(2): 115–121. doi: 10.1016/j.jbusres.2006.10.009
[2] Azzopardi E, Nash R (2013) A critical evaluation of importance-performance analysis. Tourism Management 35: 222–233. doi: 10.1016/j.tourman.2012.07.007
[3] Bacon DR (2003) A Comparison of Approaches to Importance-Performance Analysis. International Journal of Market Research 45(1): 1–15. doi: 10.1177/147078530304500101
[4] Chang SE, Liu AY, Shen WC (2017) User trust in social networking services: A comparison of Facebook and LinkedIn. Computers in Human Behavior 69: 207–217. doi: 10.1016/j.chb.2016.12.013
[5] Cronbach LJ (1951) Coefficient alpha and the internal structure of tests. Psychometrika 16(3): 297–334. doi: 10.1007/BF02310555
[6] Danaher PJ (1997) Using conjoint analysis to determine the relative importance of service attributes measured in customer satisfaction surveys. Journal of Retailing 73(2): 235–260. doi: 10.1016/S0022-4359(97)90005-1
[7] Danaher PJ, Mattsson J (1994) Customer Satisfaction during the Service Delivery Process. European Journal of Marketing 28(5): 5–16. doi: 10.1108/03090569410062005
[8] Dwyer L, Cvelbar LK, Edwards D et al. (2012) Fashioning a destination tourism future: The case of Slovenia. Tourism Management 33(2): 305–316. doi: 10.1016/j.tourman.2011.03.010
[9] Hassenzahl M (2001) The Effect of Perceived Hedonic Quality on Product Appealingness. INTERNATIONAL JOURNAL OF HUMAN-COMPUTER INTERACTION(13(4)): 481-499
[10] Hinderks A (2016) UEQ – User Experience Questionnaire. http://www.ueq-online.org. Accessed 24 Mar 2016
[11] Hinderks A, Schrepp M, Mayo FJD et al. (2019) Developing a UX KPI based on the User Experience Questionnaire. Computer Standards & Interfaces. doi: 10.1016/j.csi.2019.01.007
[12] Hinderks A, Meiners A-L, Mayo F et al. (2019) Interpreting the Results from the User Experience Questionnaire (UEQ) using Importance-Performance Analysis (IPA). In: Proceedings of the 15th International Conference on Web Information Systems and Technologies. SCITEPRESS – Science and Technology Publications, pp 388–395
[13] Hinderks A, Winter D, Schrepp M et al. (2020) Applicability of User Experience and Usability Questionnaires. Journal of Universal Computer Science(25): 1717–1735
[14] ISO9241-210 (2010) Ergonomics of human-system interaction – Part 210: Human-centred design for interactive systems (ISO 9241-210:2010)
[15] Landauer TK, Galotti KM, Hartwell S (1983) Natural command names and initial learning. A study of text-editing terms. Commun. ACM 26(7): 495–503. doi: 10.1145/358150.358157
[16] Laugwitz B, Held T, Schrepp M (2008) Construction and Evaluation of a User Experience Questionnaire. In: Holzinger A (ed) HCI and Usability for Education and Work, vol 5298. Springer Berlin Heidelberg, Berlin, Heidelberg, pp 63–76
[17] Lazar J, Feng JH, Hochheiser H (2010) Research methods in human-computer interaction. Wiley, Chichester, West Sussex, U.K
[18] Martilla JA, James JC (1977) Importance-Performance Analysis. Journal of Marketing Management 1977(41): 77–79
[19] Moshagen M, Thielsch MT (2010) Facets of visual aesthetics. International journal of human-computer studies 68(10): 689–709. doi: 10.1016/j.ijhcs.2010.05.006
[20] Norman DA (2007) Emotional Design. Why We Love (or Hate) Everyday Things. Basic Books, New York
[21] Nunnally JC, Bernstein IH (2010) Psychometric theory, 3. ed., Tata McGraw-Hill ed. McGraw-Hill higher education. Tata McGraw Hill Education Private Ltd, New Delhi
[22] Öz M (2012) A research to evaluate the airline companies’ websites via a consumer oriented approach. Afr. J. Bus. Manage. 6(14). doi: 10.5897/AJBM11.2145
[23] Pokryshevskaya E, Antipov E (2013) Importance-Performance Analysis for Internet Stores: A System Based on Publicly Available Panel Data. SSRN Journal. doi: 10.2139/ssrn.2257770
[24] Preece J, Rogers Y, Sharp H (2015) Interaction design. Beyond human-computer interaction, 4. ed. Wiley, Chichester
[25] Sauro J (2015) SUPR-Q: A Comprehensive Measure of the Quality of the Website User Experience. Journal of Usability Studies 2015(10): 68–86
[26] Schrepp M, Thomaschewski J (2019) Design and Validation of a Framework for the Creation of User Experience Questionnaires. IJIMAI InPress(InPress): 1. doi: 10.9781/ijimai.2019.06.006
[27] Schrepp M, Hinderks A, Thomaschewski J (2017) Construction of a Benchmark for the User Experience Questionnaire (UEQ). International Journal of Interactive Multimedia and Artificial Inteligence 4(4): 40–44. doi: 10.9781/ijimai.2017.445
[28] Tontini G (2016) Identifying opportunities for improvement in online shopping sites. Journal of Retailing and Consumer Services 31: 228–238. doi: 10.1016/j.jretconser.2016.02.012
[29] Tractinsky N (1997) Aesthetics and apparent usability. In: Pemberton S (ed) the SIGCHI conference, pp 115–122
Biographies

Andreas Hinderks holds a diploma in Computer Science and is Master of Science in Media Informatics by University of Applied Science Emden/Leer. He has worked in various management roles as a Business Analyst and a programmer from 2001 to 2016. His focus lay on developing user-friendly business software. Currently, he is a freelancing Product Owner, Business Analyst and Senior UX Architect. Also, he is a Ph.D. student at the University of Seville. He is involved in research activities dealing with UX questionnaires, measuring user experience and User Experience Management since 2011.

Anna-Lena Meiners holds a bachelor degree in Theatre Studies, Philosophy and Dutch Language and Literature from Freie Universität Berlin. Currently, she is completing her bachelor degree in Computer Science and Digital Media at University of Applied Sciences Emden/Leer and working as a project manager in web development. In her research she is focussing on different quality aspects of UX factors and metrics.

Francisco José Domínguez-Mayo received the Ph.D. degree in computer science from the University of Seville, Seville, Spain, in July 2013. He is currently an associate professor with the Department of Computing Languages and Systems, University of Seville. He collaborates with public and private companies in software development quality and quality assurance. His lines of interesting research are plotted in the areas of continuous quality improvement and quality assurance on software products, and software development processes.

Jörg Thomaschewski received a Ph.D. in physics from the University of Bremen (Germany) in 1996. He became a Full Professor at the University of Applied Sciences Emden/Leer (Germany) in September 2000. His teaching and research focus is on Human-Computer Interaction, UX-Management, Agile Software Development, and Requirements Engineering. Since 2012 he is the head of the research group “Agile Software Development and User Experience”. Dr. Thomaschewski has extensive experience in user experience training, UX questionnaires, agile methods, IT analysis, and consulting.
Journal of Web Engineering, Vol. 19_2, 243–266.
doi: 10.13052/jwe1540-9589.1926
© 2020 River Publishers