Rice Disease Recognition Using Effective Deep Neural Networks
S. Mathulaprangsan1, S. Patarapuwadol2, K. Lanthong1, D. Jetpipattanapong1 and S. Sateanpattanakul1,*
1Department of Computer Engineering, Faculty of Engineering at Kamphaeng Sean, Kasetsart University, Thailand
2Department of Plant Pathology, Faculty of Agriculture at Kamphaeng Saen, Kasetsart University, Thailand
E-mail: fengssmt@ku.ac.th; agrsujp@ku.ac.th; ksn.lt.cpe@gmail.com; fengdpj@ku.ac.th; fengsds@ku.ac.th
*Corresponding Author
Received 15 June 2020; Accepted 01 March 2021; Publication 02 June 2021
Abstract
Rice is the most important grain in Thailand for both consuming and exporting. One of the critical problems in rice cultivation is rice diseases, which affects directly to the yield. Early disease recognition is handled by a human, which is difficult to achieve high accuracy and the performance depends on the farmer’s experience. To overcome this problem, we did three folds of contributions. First, an infield rice diseases image dataset, named K5RD, was created. Second, a number of additional techniques to enhance the classification scores including data augmentations and learning rate adjustment strategies were carefully surveyed. Third, a set of selective deep learning models including ResNets and DenseNets were applied to classify such rice diseases. The experimental results reveal that the proposed framework can achieve high performance, which its F1 score is higher than 98% on average, and has the potential to be implemented as a practical system to provide to Thai farmers in the future.
Keywords: Rice disease recognition, deep neural network, ResNet, DenseNet, image recognition, image augmentation.
1 Introduction
As a mainly economic grain of the country, rice is cultivated in all regions of Thailand [1]. To achieve higher rice production, efficient disease control is needed [2, 3]. Early recognition of the disease in the field is the essential step in managing the detection and spread of rice diseases. However, recognizing the rice disease is a difficult task and the identification accuracy depends on the experience of plant pathologists or farmers.
In the past few decades, there are several studies that focused on recognizing cereal crop diseases, especially rice disease recognition, by using artificial intelligence (AI) techniques such as machine learning and deep learning with image data [4–8]. A study in [4] reveals that using deep neural networks (DNNs) on grain crop disease recognition problem becomes a research trend because of their impressive performance. Consequently, many studies focused on discovering or creating an appropriate DNN model to recognize rice diseases. Liang et al. [9] applied a convolutional neural network (CNN) to classify rice blast disease. Their experimental results showed that CNN can extract the features and classify the blast disease better than the traditional methods, e.g., local binary patterns histograms (LBPH) with support vector machine (SVM). Singh et al. [10] used genetic algorithm (GA) to segment the disease area and use the co-occurrence methodology to extract the features in the problem of leaf disease detection. Shrivastava et al. [11] used a transfer learning of CNN to extract the features and then used SVM to classify the four classes of rice images including three kinds of rice diseases and a healthy class.
Using rice images to infield classify rice diseases is challenged due to the performance of the recognition system depends not only on selecting the proper AI model, which matches the stated problem, but also the quantity and quality of the used data to train such a model. However, currently available infield rice disease datasets are usually small and do not contain enough images of different plant stages. Besides, rice is a kind of grass species, which its image contains a lot of details inside, and the difference between the foreground and the background is slight. Therefore, theoretically, recognizing rice disease images cannot achieve a good result by using a general deep learning model such as a convolutional neural network (CNN), which is proper to recognize an object that has distinct detail from the background.
In this study, we propose a practical framework to recognize five diseases of rice, which are devastating in many regions of Thailand. The contributions of this work can be divided into three folds as follows.
(1) A practically infield rice disease image dataset, named K5RD, was created. This dataset is designed for the single-label multi-class classification and covers five rice diseases that are the most frequently found in all regions of Thailand, which are blast, bacterial blight, brown spot, narrow brown spot, and bacterial leaf streak.
(2) A set of additional techniques to boost the classification performance including image augmentations and learning rate adjustment strategy were applied.
(3) Two kinds of shortcut connection networks including residual neural networks (ResNets) and densely connected convolutional neural networks (DenseNets) were adopted to classify such rice diseases.
The rest of the paper is organized as follows: Section 2 presents the related deep learning works. Then, the proposed framework is introduced in Section 3. After that, the experimental results are presented in Section 4. Finally, Section 5 exhibits our conclusion.
2 Related Works
The related works of this research have two folds: rice disease recognition and shortcut connection networks. The former is the previous studies of rice disease recognition. The latter is the special type of deep neural networks, which is our assumption that they can be the proper classifier for this problem.
2.1 Rice Disease Recognition
As we mentioned in the previous section, there are a lot of studies focused on recognizing rice diseases by using AI technique in the past decade. These studies can be divided into three categories in term of AI algorithms: (1) none deep neural network (2) deep neural networks and (3) a mix of both. In the first category, SVM plays an important role as a default classifier for this problem. SVM is originally designed for binary classification. It can be applied to multiclass problem by using one-versus-one or one-versus-all strategy. SVM cannot classify well when at least two classes are overlapping. In rice disease recognition, there are a lot of classes that intersect with each other, e.g., brown spot and narrow brown spot. As a result, its classification performance is limited. Yao et al. [7] extracted features from shape, color, and texture of rice images. Then, the features were classified by SVM. Shrivastava et al. [12] also used color feature extracted from various color space models. The features then were classified by a set of traditional classifiers in machine learning such as SVM, k-nearest neighbors (KNN), decision tree, etc.
Deep neural network is originally designed for multiclass classification problem by creating the network architecture according to the problem. Unlike SVM and other machine learning classifiers, DNN itself can do both feature extraction and classification. The feature extracted by DNN, called feature map, is achieved from the output of CNN layers inside the network architecture. Therefore, we can feed rice images directly to the DNN model. In the second category, there are two sub-groups depended on preprocessing techniques. The studies in the first sub-group use DNN with slightly preprocessing to make the recognition system less complex and less computation cost. Moreover, there are some rice diseases that affect the whole plant, e.g., stem rot. Therefore, segmentation strategy cannot carry out in this case. Liang et al. [9] proposed the method of using CNN to recognize rice blast disease as binary classification problem. They compared their method with the SVM classifier using various types of features, which are local binary pattern histogram (LBPH), Haar wavelet transform (Haar-WT), and CNN feature map. The second sub-group is using DNN with image segmentation. The idea of this strategy is that segmentation of the disease area of a rice image can reduce the background noise. Thereby, the recognition performance should be higher. Phadikar et al. [5] segmented the images in the area of rice blast using a zooming algorithm. Then the segmented images were performed binary classification by a neural network. Kiratiratanapruk et al. [13] used a set of pre-trained CNN models including faster R-CNN, RetinaNet, YOLOv3, and mask R-CNN to detect the infield rice diseases. In this work, they started by segmenting the disease area. Then, the marked area was fed into the CNN models to identify rice diseases.
In the last category, Jiang et al. [8] performed CNN as feature extractor. The feature map was classified by SVM with radial basis kernel function (RBF). Moreover, they explored three types of image color space models, which are RGB (red, green, blue), HSI (hue, saturation, intensity), and YCbCr (luma signal, blue and red difference of chroma components). Their experimental results show that using R, B, I, and Cr channels to extract features can achieve higher mean accuracy than the rest channels. Xiao et al. [14] also used color features from HIS and YCbCr color space model along with morphological features and texture features. These complicated features were analysed the correlation by regression analysis and were reduced the dimensionality by principal component analysis (PCA). After that, the final features were classified by backpropagation DNN.
2.2 Shortcut Connection Networks
As we mentioned above, technically, the challenge of the rice disease classification problem is that the general CNN model cannot achieve good performance according to the very high detail of the images. Therefore, we surveyed deeper networks and scoped down to find out suitable architectures. Recently, shortcut connection networks [15] are becoming more popular and used widely in many research areas. This kind of network has more discriminative power than the traditional convolutional neural networks because they can go deeper with more hidden layers. Generally, the effect when we add more hidden layers into the deep neural network is the gradient vanishing problem, which makes the adjusted weight in the deeper layers closed to zero. This phenomenon decreases the classification performance since the very-close-to-zero weight makes the network cannot extract the feature well. However, the strategy of the shortcut connection network is making a by-pass weight between each block of their architecture. Thereby, the model can be deeper without gradient vanishing.
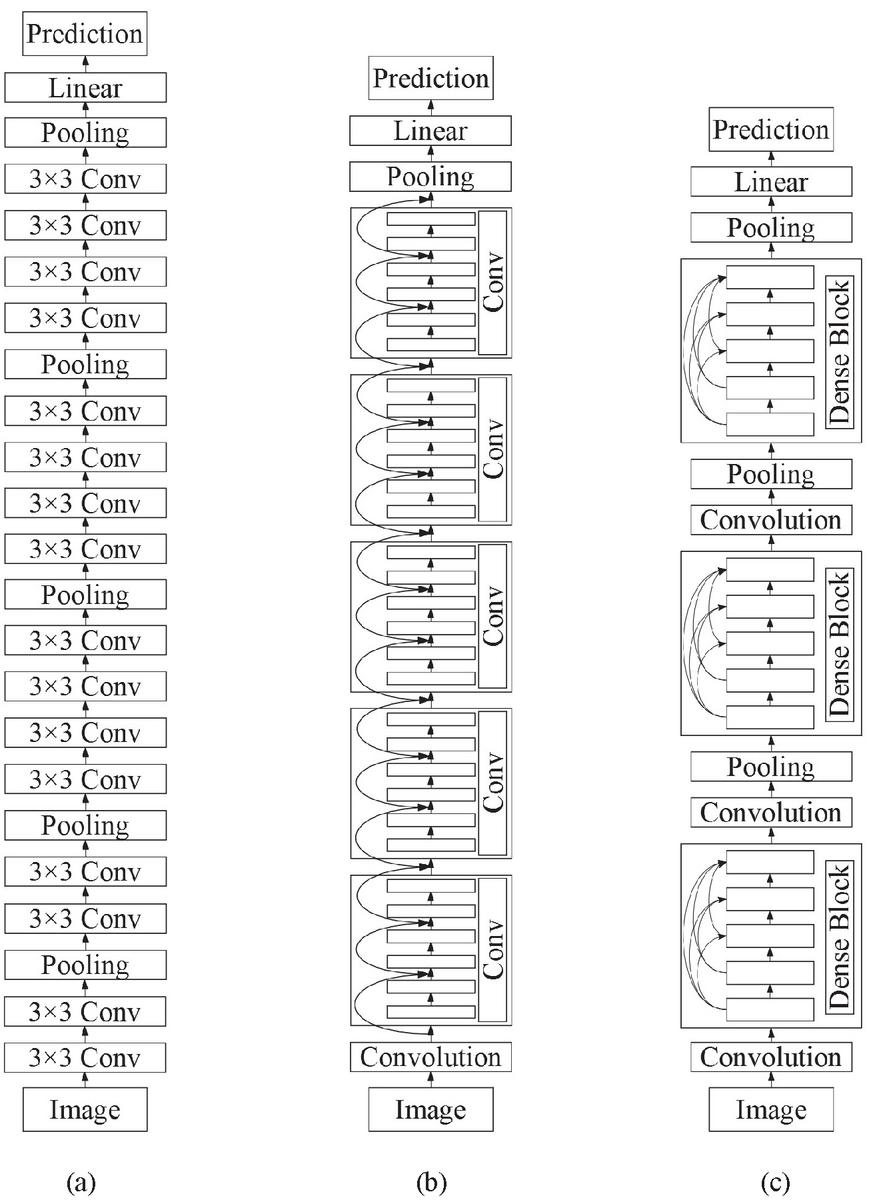
Figure 1 Comparison of the Architectures between a General Convolutional Neural Network and Shortcut Connection Networks: (a) No-shortcut Connection Network, (b) ResNet, and (c) DenseNet.
In the category of shortcut connection networks, there are two outstanding models, which are ResNet and DenseNet. The difference between them is their by-pass connection approach. (a) no-shortcut network (in this paper, we pick the model VGG16 as an example of a general CNN), (b) ResNets, and (c) DenseNets. In Subsections 2.1 and 2.2, those shortcut connection DNN models are briefly demonstrated.
2.2.1 Residual neural networks
ResNet [16] is one of the most popular DNN models nowadays and its architecture is based on CNN network. This network was used in various problems of image processing including image recognition [17–19]. Generally, for CNN architecture, the strategy to improve the performance is to go deeper by increasing the hidden layers. However, as previously mentioned, this approach leads to the vanishing exploding gradients problem. ResNet can solve such a problem by the use of shortcut connection as its residual blocks, which are identity mapping added the output from the previous layer (see Figure 1(b)). Because this architecture can use the advantage of going deeper without the disadvantage of the aforementioned vanishing gradient, there are many developed models of ResNet and used in diverse kinds of problems. In this paper, we use ResNet50 and ResNet101 to evaluate the 5-disease rice dataset.
2.2.2 Densely connected convolutional neural networks
Huang et al. [20] proposed a DNN architecture named DenseNet, which also uses the benefit of the shortcut connection to overcome the problem of vanishing gradient. Same as ResNet, this network was employed in diverse image recognition problems [21–23]. In this model, the input of each layer is a collection of feature maps of all previous layers. On the other hand, the output is sent to each subsequent layer (see Figure 1(c)). DenseNet has a dense block group of layers connected to all their previous layers. Each dense block has fully connected to other blocks and updates feature maps to reduce its convolutional parameters. Consequently, it can promote the network to be high parameter efficient. In the proposed framework of this study, we carried out two models of DenseNet including DenseNet161 and DenseNet169.
3 The Proposed Framework
This section illustrates the framework of this study. As shown in Figure 2, the system overview consists of two parts, which are the training module and the test module. In the training module, input rice images from K5RD dataset are fed into the system. Then, they are resized to pixels. After that, the resized images are augmented and fed to the training models. In the test module, a test rice disease image is fed into the trained modelled to get the predicted result. The following sub-sections are described more details. The information on the data acquisition step is presented first. Then, the techniques of image augmentations used in the framework are described. After that, two kinds of learning rate adjustment strategies are reviewed. Finally, the practical DNN models that are selected to evaluate the dataset are following presented.

Figure 2 System overview of the proposed rice disease recognition system.
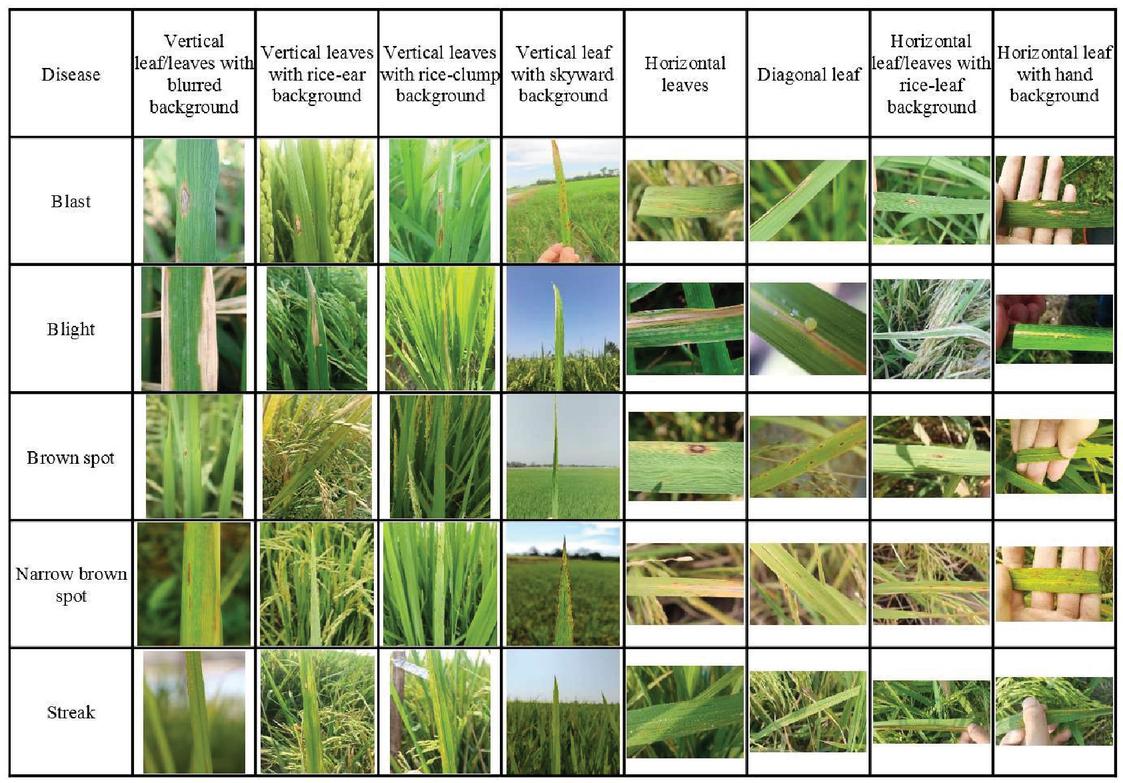
Figure 3 Examples of K5RD rice diseases dataset.
3.1 The K5RD Rice Disease Dataset
The first contribution of this study is the dataset of rice disease images named the K5RD dataset. This dataset is designed for the single-label multi-class classification. Since the long-term goal of this research is to create the rice disease recognition system in an easy-to-use platform, e.g., mobile app or line bot. The disease classes of the dataset should cover all of the important rice diseases in Thailand, which have 18 crucial disease classes and total 23 disease classes [24]. However, for the first phase, we start with the five rice diseases that are the most frequently found in all regions of Thailand. These rice diseases include blast, bacterial blight, brown spot, narrow brown spot, and bacterial leaf streak. To create the five-class image dataset of those rice diseases, images of infected leaves of each disease classes were taken from the rice fields in six provinces from two regions of Thailand, which are the northern region, i.e., Chiang Rai, Nan, and Phayao, and the central region, i.e., Pathum Thani, Nakhon Pathom, and Ayutthaya.
Table 1 Number of samples per each class in K5RD rice diseases dataset
| Disease | Number of Samples |
| Blast | 3040 |
| Bacterial blight | 3396 |
| Brown spot | 1735 |
| Narrow brown spot | 2114 |
| Bacterial leaf streak | 1938 |
| Total | 12223 |
Since we also planned to extend the dataset to cover more kinds of diseases in the future by the cooperation of rice farmers and plant pathologists, the created recognition framework should be compatible with any size, any setting, and a wide range of environmental conditions such as illumination and brightness. Therefore, a number of digital and mobile phone cameras with various settings, e.g., resolution, photo mode, ISO, aperture, were used to capture disease symptoms for each disease. Finally, all of the images were checked and confirmed correctness by the plant pathologists. As shown in Figure 3, the images from each class in the K5RD dataset cover a huge variance of practical in-field photoshoot condition, i.e., vertical leaf/leaves with blurred background, vertical leaves with rice-ear background, vertical leaves with rice-clump background, vertical leaf with skyward background, horizontal leaves, diagonal leaf, horizontal leaf/leaves with rice-leaf background, and horizontal leaf with hand background. Hence, the K5RD dataset is proper to be assessed in a practicable rice disease recognition system. Concludingly, the names and number of samples of each rice disease class are presented in Table 1.
3.2 Learning Adjustment Strategy
To tune the deep learning model in the training step, learning rate is an important hyperparameter that lets the optimizer controls the step size of weight adjustment to minimize the loss function in each iteration of training process [25]. The improper value of learning rate leads to decrease the performance score or take longer training time. On one hand, too-small learning rate makes the training more reliable but the optimizer will take a lot of time to converge the learning process. On the other hand, too-large learning rate makes the optimizer cannot reach the minimum loss and then fail to converge.
In this study, we compared two strategies of learning rate adjustments including static learning rate and discriminative fine-tuning. Static learning rate [26] is a simple method, in which the model is learned by using the selected value of learning rate for the whole training process without changing. While discriminative fine-tuning strategy [27] is more complex processing. This tuning allows the network to learn each layer with different learning rates. Practically, this method can be carried out by dividing the network to layer groups. Then, each group is assigned a different learning rate descending from an input (largest value) to an output layer (smallest value), for example, three layer groups with learning rates as 0.001, 0.0001, 0.00001, respectively.
3.3 Image Augmentation
Augmentation is one of preprocessing strategies to enhance the learning efficiency of the deep learning models [28] because this approach produces more information to the original data. Consequently, this additional data increase the possibility of the learning model to extract more information in its feature map. In image-oriented deep learning tasks, there are two folds of data augmentation: basic image manipulations and deep learning approaches [29]. The first fold bases on basic computational functions, which compose of kernel filters, color space transformations, random erasing, mixing images, and geometric transformation; the second fold bases on the deep learning methodologies, which consist of adversarial training, neural style transfer, and generative adversarial network (GAN) data augmentation.
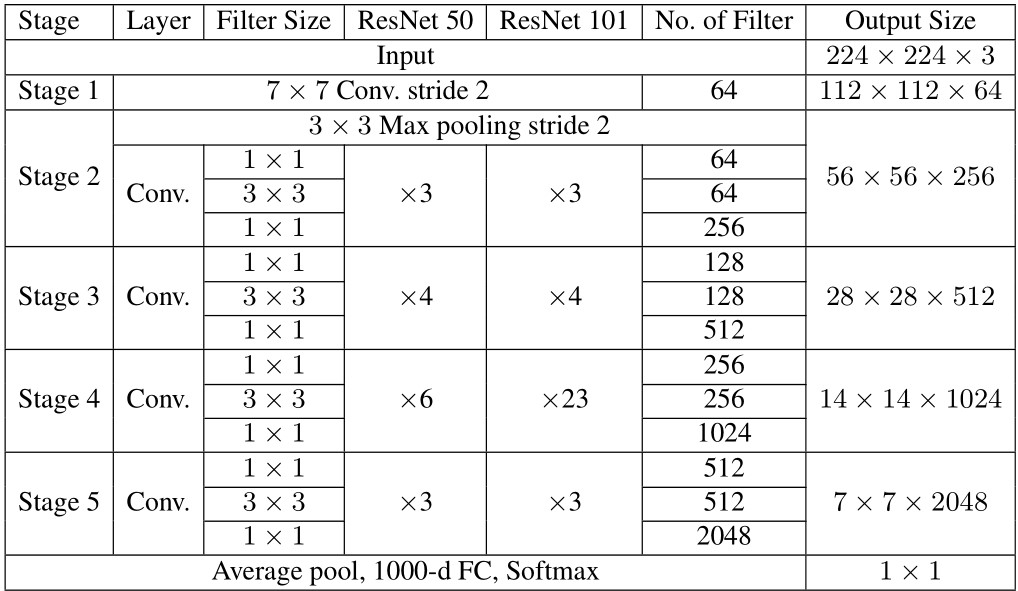
Table 2 ResNet50 and ResNet101 architectures
In this study, we focus on geometric transformations, which belongs to the basic image manipulations since they consume slightly computation, which is good for the practical recognition system. Therefore, we reviewed methods of this fold including rotation and flip.
3.4 Selected Deep Learning Models
As aforementioned, the DNN architecture that can solve the image recognition problem composed of high detail images is the model with a package of convolutional layers with the shortcut connections. In this category, there are two proper models, i.e., ResNet and DenseNet, which are proved to solve this challenge of recognition problem with high performance compared to general CNN models.
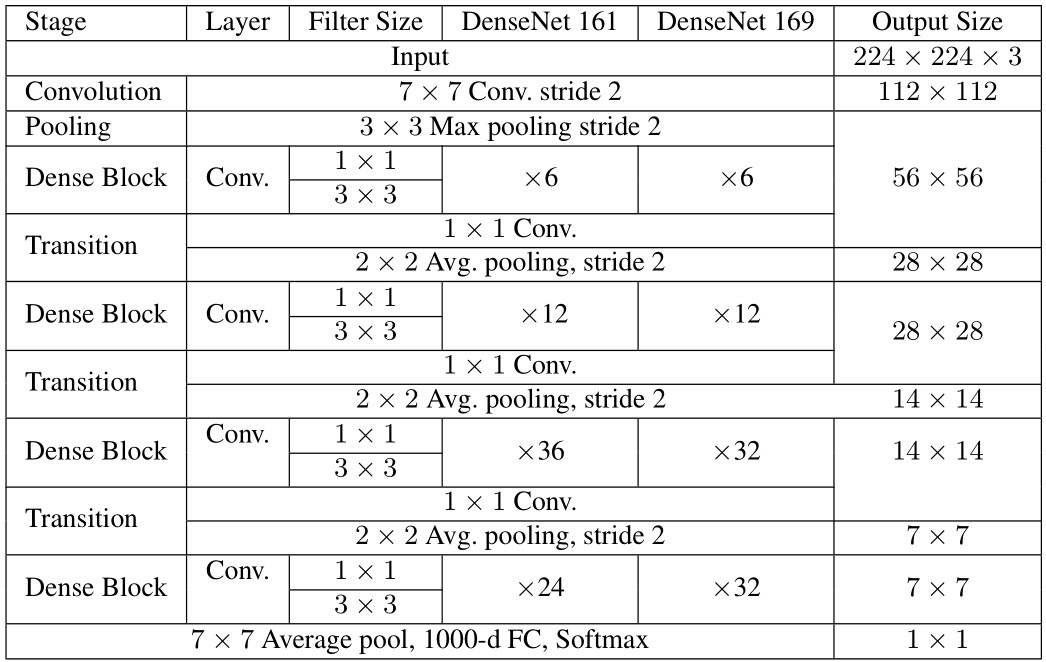
Therefore, the deep learning models used in this study include ResNet50, ResNet101, DenseNet161, and DenseNet169. Those ResNets and DenseNets are briefly presented in Tables 2 and 3, respectively.
– ResNet50 and ResNet101: As shown in Table 2, each of ResNets has five stages, which each stage has different filter sizes, number of filters, and repetitions. The difference between ResNet50 and ResNet101 is that the number of convolution layers in stage 4, which are 6 and 23 layers, respectively. To balance between the recognition performance and computation time, the size of input images was resized to pixels.
– DenseNet161 and DenseNet169: As presented in Table 3, DenseNet architecture composes of the convolution layer and follows by the iteration of dense blocks and transitions. The only difference between DenseNet161 and DenseNet169 is in the last dense block, in which the repetition of the two convolution layers with filter sizes of and are 24 and 36, respectively (See Table 3). Similar to ResNets, the size of input images was resized to pixels.
Table 3 DenseNet161 and DenseNet169 Architectures
4 Experimental Results
To reveal the performance of the proposed rice disease recognition framework by the selective models of deep neural networks, a set of experiments and their results are exhibited in this section. In our experiments, the compared models can be categorized into two groups: (1) the shortcut connection networks, which are our assumption that should achieve higher performance than the baselines (2) the state-of-the-art models in both none deep learning (SVM) and deep learning algorithm (VGG, the high-performance CNN network).
Each experiment focuses on significant factors that can improve system performance as follows. Firstly, two strategies of learning rate adjustment were evaluated. Then, two kinds of augmentations were applied to the dataset to find out which one is the most proper augmentation for this problem in term of boosting classification performance. Finally, a set of selected models packed with the learning rate setting and the suitable augmentation from the results of the two aforementioned experiments were accurately evaluated.
Because the problem of rice disease recognition is multiclass classification and some classes are overlapping, in the experiments of this study, we utilized confusion matrix, precision, recall (or sensitivity), and F1-score to assess the compared models.
Confusion matrix is a table used to describe the performance of a classification model on a set of test samples, in which the true values are known. Each row of the matrix represents the counted samples (or percentage) of a predicted class while each column represents the counted samples (or percentage) of an actual class (or vice versa). Confusion matrix can illustrate the classification detail better than mean accuracy because it shows not only the true prediction but also the fault prediction of each class. Thereby, we can look at the detail of the prediction such as the ratio of fault positive and fault negative of any two compared classes. The performance in term of accuracy can be defined as follows.
| (1) |
where represents the number of correctly classified samples, is the number of total test samples.
Precision is the ratio of the number of correctly predicted positive (true positive) to the number of all predicted positive (true positive fault positive. While sensitivity is the ratio of the number of correctly predicted positive (true positive) to the number of all samples that should predict as positive (true positive fault negative). We presented both of them as well as F1 score, which is the combination of both precision and sensitivity. Precision, recall, and F1 score can be calculated as follows.
| (2) | ||
| (3) |
and
| (4) |
where , , and represent the number of true positive, false positive, and false negative, respectively.
The experimental setting used to do such experiments is fixed as follows. To make the reliability of the following results, 5-fold cross validation was carried out to evaluate the proposed dataset. According to the network structure, all images were resized to pixels for feeding to the input layer. The batch size was set to 16, with the epoch equals to 15. The experiments were run on a desktop computer with the GPU: GeForce RTX 2060 SUPER, compute 1.7, having 2176 CUDA cores, 8GB GDDR6 VRAM, CPU: core I3-9100F 3.6 GHz (4 cores, 4 threads), RAM: 8 GB available, and Disk: SSD SATA3 240 GB.
4.1 Comparison of Different Learning Rate Adjustment Strategies
To investigate the suitable setting of the learning rate for subsequently compared models, two adjustment strategies including discriminative fine-tuning and static learning rates are carried out and measure the performance on the full K5RD dataset by using Dense161 model. In this experiment, the discriminative learning rate was set to 0.01, 0.001, and 0.0001. The static learning rate was set to 0.0001. The experimental results are illustrated in Table 4.
Table 4 Classification accuracy of different learning rate adjustment strategies on the K5RD Dataset (full size)
| Method | ||
| Disease | Discriminative | Static |
| Blast | 0.9803 | 0.9585 |
| Bacterial blight | 0.9838 | 0.9897 |
| Brown spot | 0.9280 | 0.8098 |
| Narrow brown spot | 0.9882 | 0.9787 |
| Bacterial leaf streak | 0.9897 | 0.9922 |
| Mean accuracy | 0.9740 | 0.9518 |
The experimental results in Table 4 show that the strategy of discriminative fine-tuning can improve the training performance and reaches recognition rate of 0.9740, which is higher than static learning rate 2.22%.
4.2 Comparison of Different Augmentation Strategies
As we mentioned in Subsection 3.3, a number of augmentations are considered to integrate with the proposed framework. This experiment compares the classification performance of six data augmentation approaches including no-augmentation, rotation 90, 180, 270 degrees, flip vertical, and flip horizontal. At first, to survey for the proper approach, only 500 samples per class of the K5RD dataset were randomly selected and used for no-augmentation approach. Then, each augmentation generates additional 500 samples per class, with total of 1,000 samples per class. The model used to evaluate this comparison is DenseNet161. The results in term of mean classification accuracy are illustrated in Table 5.
The results in Table 5 shows that vertical flip augmentation has the highest accuracy with 0.9680, which proves that this augmentation can enhance the classification performance of the framework. The 180-degree rotation also performs well (the second-highest approach) with 0.9624 accuracy. To explore more precisely in every single class, confusion matrices of each strategy were conducted and presented in Tables 6–11 as follows.
Table 5 Classification accuracies of different data augmentation strategies
| Augmentation | Mean Accuracy |
| No Augmentation | 0.9200 |
| Rotate 90 Degree | 0.9584 |
| Rotate 180 Degree | 0.9624 |
| Rotate 270 Degree | 0.9570 |
| Flip (Vertical) | 0.9680 |
| Flip (Horizontal) | 0.9592 |
Table 6 Confusion matrix of no-augmentation approach
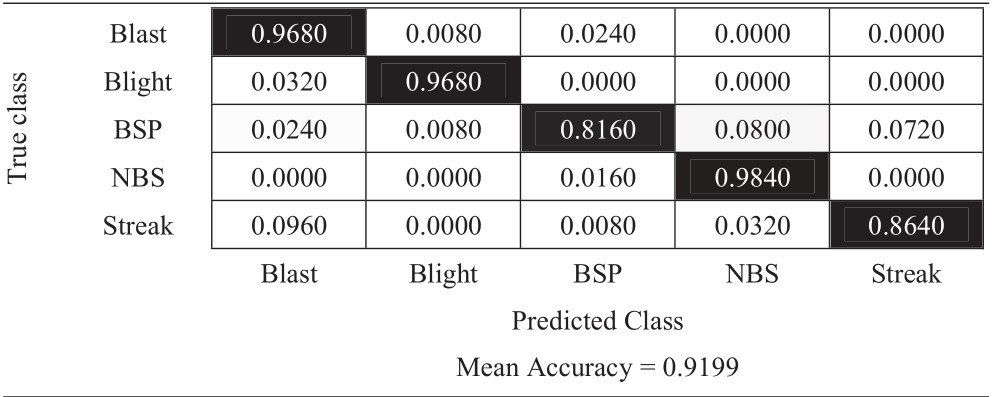 |
Table 7 Confusion matrix of 90-degree rotation approach
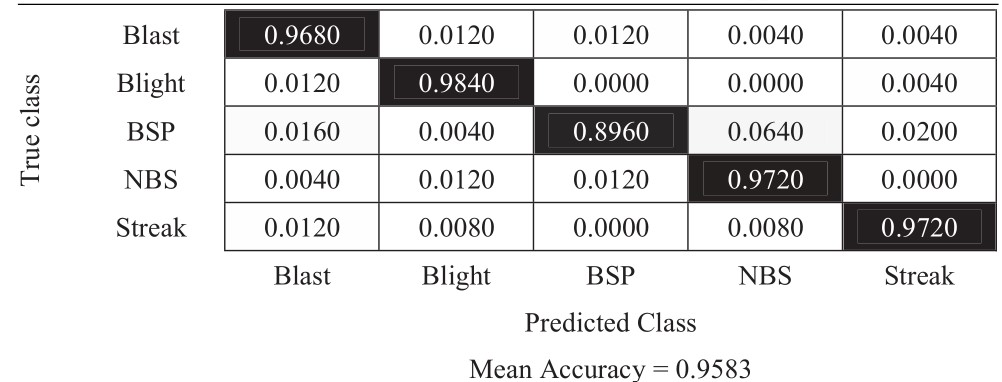 |
Table 8 Confusion matrix of 180-degree rotation approach
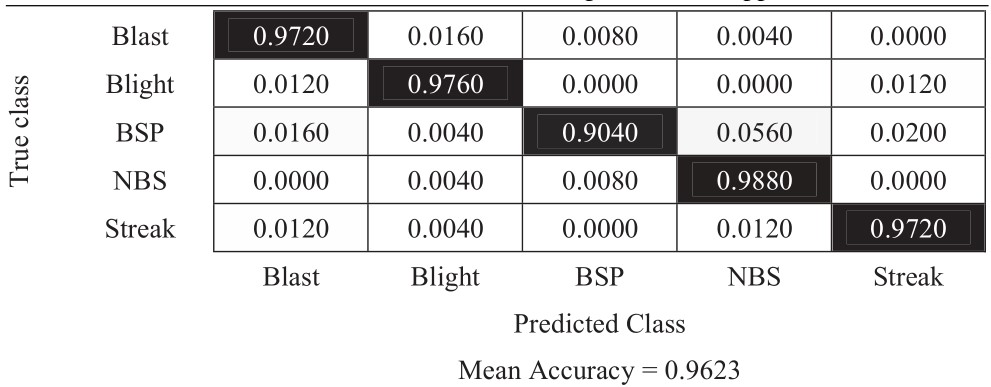 |
Table 9 Confusion matrix of 270-degree rotation approach
 |
Table 10 Confusion matrix of vertical flip approach
 |
Table 11 Confusion matrix of horizontal flip approach
 |
The experimental results in Tables 6–11 show that the most difficult class is brown spot (BSP), which is frequently identified as narrow brown spot (NBS). However, three strategies including 180-degree rotation and both flip augmentations can handle this problem better than other strategies. As a result, they achieve better results and the vertical flip augmentation achieves the best results as shown in Tables 5, 8, 10, and 11.
4.3 Comparison of Different Classification Models and the Performance of the Proposed Framework
This experiment focuses on evaluating the performance of the compared models including VGG16 [30], VGG19 [30], ResNet50 [16], ResNet101 [16], DenseNet161 [20], and Dense169 [20]. Moreover, to confirm the propriety of classifier selection for this problem, we also compared with a none deep learning model, which is support vector machine (SVM) with bag of words feature representation [31]. The full size of the K5RD dataset without augmentation and static learning rate was evaluated by using these models. Table 12 presents the results in term of recognition rate as follows.
The experimental results in Table 12 show that DenseNet161 performs best with 0.9740 of mean accuracy. Then, we experimented on the full size of the K5RD dataset to confirm the exploration from Subsections 4.1 and 4.2. We integrated the discriminative fine-tuning with all augmentation strategies. The experimental results are presented in Table 13.
Table 12 Classification accuracies on the K5RD dataset (full size) of different classification models
| Model | Mean Accuracy |
| SVM | 0.6462 |
| VGG16 | 0.9077 |
| VGG19 | 0.9167 |
| ResNet50 | 0.9168 |
| ResNet101 | 0.9250 |
| DenseNet161 | 0.9740 |
| DenseNet169 | 0.9498 |
Table 13 Classification accuracies on the K5RD dataset (full size) of all data augmentation strategies
| Augmentation | Accuracy |
| No Augmentation | 0.9740 |
| Rotate 90 Degrees | 0.9760 |
| Rotate 180 Degrees | 0.9862 |
| Rotate 270 Degrees | 0.9628 |
| Flip (Vertical) | 0.9737 |
| Flip (Horizontal) | 0.9812 |
In this time, when the data size is bigger, the 180-degree rotation has the highest accuracy with 0.9862 while the horizontal flip got the second place with 0.9812. Therefore, we created the proposed framework, which is the DenseNet161 model with discriminative fine-tuning and 180-degree rotation augmentation. The framework was assessed by confusion matrix and F1 scores of each disease class as presented in Tables 14 and 15.
Table 14 Confusion matrix of the proposed framework on K5RD dataset (full size)
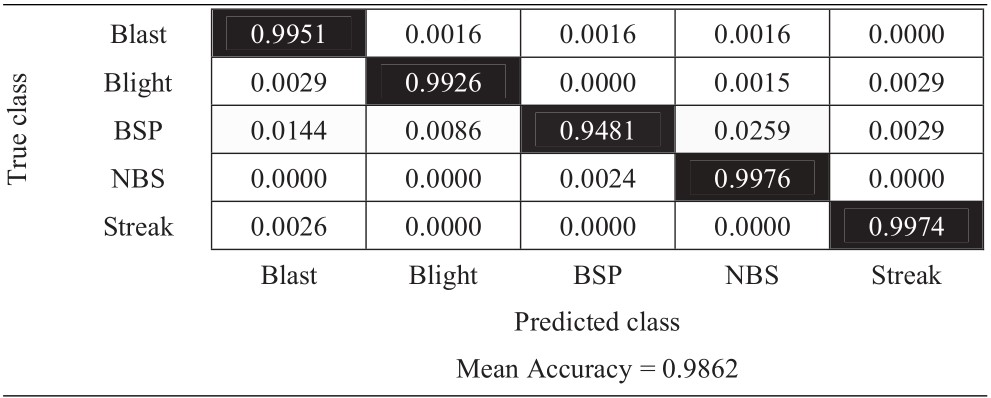 |
Table 15 F1 scores of each disease class of the proposed framework
| Disease | Precision | Recall | F1-score |
| Blast | 0.9869 | 0.9951 | 0.9910 |
| Blight | 0.9941 | 0.9926 | 0.9934 |
| BPS | 0.9940 | 0.9481 | 0.9705 |
| NBS | 0.9745 | 0.9976 | 0.9859 |
| Streak | 0.9923 | 0.9974 | 0.9948 |
| Average | 0.9884 | 0.9862 | 0.9871 |
The experimental results from Table 14 present the classification accuracies of each class. The class that got the worst result is still the brown spot disease. However, with additional augmentation and discriminative fine-tuning, it achieves a better score than the previous experiments, which is 0.9481. The mean accuracy of the proposed framework is 0.9862. Table 15 presents the F1 scores of this framework, which confirm that the reliability of the proposed framework, which achieves precision, recall, and F1 score as 0.9884, 0.9862, and 0.9871, respectively.
5 Conclusion
This paper presents an image recognition framework on the five most frequently found rice diseases in Thailand. The 5-class dataset of these rice diseases, named K5RD, was collected from the real fields in six provinces from the northern and the central regions of Thailand. Then, two kinds of learning rate adjustment strategies, which are static learning rate and discriminative fine-tuning, were surveyed. After that, a set of image augmentations including rotations and flips were studied. Finally, a list of shortcut connection DNN models including ResNet50, ResNet101, DenseNet161, and DenseNet169 were evaluated and compared with the general CNN models (VGG16 and VGG19). The proposed framework is composed of DenseNet161 model using discriminative fine-tuning and 180-degree augmentation. The experiment results by using 5-fold cross validation reveal that this framework achieves the best results with 0.9862.
Future works can be extended the scope to cover more kinds of diseases, which may have different characteristics of their images and lead to the different proper classification models. Moreover, to make the model better fit the problem, such a model may achieve by custom some existing DNNs as well as the framework. On the other hand, the proposed strategy can be modified and applied to other closed problems, e.g., disease recognition on other kinds of grain.
Acknowledgment
This study was supported by grants from Innovation for Sustainable Agriculture (ISA), Grant number P-18-51456 National Science and Technology Development Agency, Thailand.
References
[1] D. B. Johnston, “Rice Cultivation in Thailand: The Development of an Export Economy by Indigenous Capital and Labor,” Mod. Asian Stud., vol. 15, no. 1, pp. 107–126, 1981.
[2] S. Savary, A. Ficke, J. Aubertot, and C. Hollier, “Crop losses due to diseases and their implications for global food production losses and food security,” pp. 519–537, 2012.
[3] D. R. Walters, J. Ratsep, and N. D. Havis, “Controlling crop diseases using induced resistance?: challenges for the future,” vol. 64, no. 5, pp. 1263–1280, 2013.
[4] D. I. Patrício and R. Rieder, “Computer vision and artificial intelligence in precision agriculture for grain crops: A systematic review,” Comput. Electron. Agric., vol. 153, no. April, pp. 69–81, 2018.
[5] S. Phadikar and J. Sil, “Rice disease identification using pattern recognition techniques,” in 2008 11th International Conference on Computer and Information Technology, 2008, pp. 420–423.
[6] E. L. Mique and T. D. Palaoag, “Rice Pest and Disease Detection Using Convolutional Neural Network,” in Proceedings of the 2018 International Conference on Information Science and System, 2018, pp. 147–151.
[7] Q. Yao, Z. Guan, Y. Zhou, J. Tang, Y. Hu, and B. Yang, “Application of Support Vector Machine for Detecting Rice Diseases Using Shape and Color Texture Features,” in 2009 International Conference on Engineering Computation, 2009, pp. 79–83.
[8] F. Jiang, Y. Lu, Y. Chen, D. Cai, and G. Li, “Image recognition of four rice leaf diseases based on deep learning and support vector machine,” Comput. Electron. Agric., vol. 179, no. August, p. 105824, 2020.
[9] W. Liang, H. Zhang, G. Zhang, and H. Cao, “Rice Blast Disease Recognition Using a Deep Convolutional Neural Network,” pp. 1–10, 2019.
[10] V. Singh and A. K. Misra, “Detection of plant leaf diseases using image segmentation and soft computing techniques,” Inf. Process. Agric., vol. 4, no. 1, pp. 41–49, 2017.
[11] V. K. Shrivastava et al., “Rice plant disease classification using transfer learning of deep,” vol. XLII, no. February, pp. 18–20, 2019.
[12] V. K. Shrivastava and M. K. Pradhan, “Rice plant disease classification using color features: a machine learning paradigm,” J. Plant Pathol., no. Barbedo 2016, 2020.
[13] K. K. B and P. Temniranrat, to Detect Rice Diseases from Images of Rice Fields, vol. 1. Springer International Publishing.
[14] M. Xiao et al., “Rice blast recognition based on principal component analysis and neural network,” Comput. Electron. Agric., vol. 154, no. June, pp. 482–490, 2018.
[15] B. Li and Y. He, “An Improved ResNet Based on the Adjustable Shortcut Connections,” IEEE Access, vol. 6, pp. 18967–18974, 2018.
[16] K. He and J. Sun, “Deep Residual Learning for Image Recognition,” 2016 IEEE Conf. Comput. Vis. Pattern Recognit., pp. 770–778, 2016.
[17] Z. Wu, C. Shen, and A. van den Hengel, “Wider or Deeper: Revisiting the ResNet Model for Visual Recognition,” Pattern Recognit., vol. 90, pp. 119–133, 2019.
[18] R. U. Khan, X. Zhang, R. Kumar, and E. O. Aboagye, “Evaluating the Performance of ResNet Model Based on Image Recognition,” in Proceedings of the 2018 International Conference on Computing and Artificial Intelligence, 2018, pp. 86–90.
[19] H. Jung, M.-K. Choi, J. Jung, J.-H. Lee, S. Kwon, and W. Young Jung, “ResNet-Based Vehicle Classification and Localization in Traffic Surveillance Systems,” in The IEEE Conference on Computer Vision and Pattern Recognition (CVPR) Workshops, 2017.
[20] G. Huang, Z. Liu, L. Van Der Maaten, and K. Q. Weinberger, “Densely Connected Convolutional Networks,” 2017.
[21] J. Zhang, C. Lu, X. Li, H. Kim, and J. Wang, “A full convolutional network based on DenseNet for remote sensing scene classification,” vol. 16, no. April, pp. 3345–3367, 2019.
[22] K. Zhang, Y. Guo, X. Wang, J. Yuan, and Q. Ding, “Multiple Feature Reweight DenseNet for Image Classification,” IEEE Access, vol. 7, pp. 9872–9880, 2019.
[23] J. M. Song, W. Kim, and K. R. Park, “Finger-Vein Recognition Based on Deep DenseNet Using Composite Image,” IEEE Access, vol. 7, pp. 66845–66863, 2019.
[24] “RKB.” [Online]. Available: http://www.ricethailand.go.th/rkb3/Disease.htm. [Accessed: 14-Jun-2020].
[25] L. N. Smith, “Cyclical learning rates for training neural networks,” Proc. - 2017 IEEE Winter Conf. Appl. Comput. Vision, WACV 2017, no. April, pp. 464–472, 2017.
[26] L. Li, W. Huang, I. Y. H. Gu, and Q. Tian, “Statistical modeling of complex backgrounds for foreground object detection,” IEEE Trans. Image Process., vol. 13, no. 11, pp. 1459–1472, 2004.
[27] J. Howard and S. Ruder, “Universal language model fine-tuning for text classification,” ACL 2018 – 56th Annu. Meet. Assoc. Comput. Linguist. Proc. Conf. (Long Pap., vol. 1, pp. 328–339, 2018.
[28] P. Jiang, Y. Chen, B. Liu, D. He, and C. Liang, “Real-Time Detection of Apple Leaf Diseases Using Deep Learning Approach Based on Improved Convolutional Neural Networks,” IEEE Access, vol. 7, pp. 59069–59080, 2019.
[29] C. Shorten and T. M. Khoshgoftaar, “A survey on Image Data Augmentation for Deep Learning,” J. Big Data, vol. 6, no. 1, 2019.
[30] K. Simonyan and A. Zisserman, “Very deep convolutional networks for large-scale image recognition,” 3rd Int. Conf. Learn. Represent. ICLR 2015 – Conf. Track Proc., pp. 1–14, 2015.
[31] C. S. Venegas-Barrera and J. Manjarrez, “Visual Categorization with Bags of Keypoints,” Rev. Mex. Biodivers., vol. 82, no. 1, pp. 179–191, 2011.
Biographies

S. Mathulaprangsan received the B.S. and M.S. degrees in Computer Engineering from King Mongkut’s University of Technology Thonburi, Thailand in 1999 and 2003, respectively. In 2019, he received Ph.D. degree in applied computer science and information engineering from National Central University, Taiwan. Currently, he is a lecturer in the Department of Computer Engineering, Faculty of Engineering at Kamphaeng Saen, Kasetsart University, Thailand. His research interests include image processing, deep learning, AI in agriculture, and satellite image processing.

S. Patarapuwadol is currently an Assistant Professor in the Department of Plant Pathology, Faculty of Agriculture at Kamphaeng Saen, Kasetsart University, Thailand. She graduated with first-class honours at Kasetsart University (B.Sc.Agr., 1995) and Ph.D. (Agriculture) in 2008 from The University of Sydney, Australia. Her research focused on plant microbe interactions and molecular detection and identification of phytopathogenic bacteria. Sujin, a Rockefeller Ph.D. fellowship recipient, has been involved in rice research since 2001. In 2018, her research group began to address rice diseases diagnosis using image analysis and artificial intelligence.

K. Lanthong received the B.E. degree in computer engineering from Kasetsart University, Thailand in 2013. Currently he is a research assistant in the Department of Computer Engineering, Faculty of Engineering at Kamphaeng Saen, Kasetsart University, Thailand. His research interests include computer vision, satellite image processing, and deep learning.

D. Jetpipattanapong received Ph.D. degree from Sirindhorn International Institute of Technology, Thammasat University, Thailand in 2017. She is currently a lecturer in Department of Computer Engineering, Faculty of Engineering at Kampheang Saen, Kasetsart University, Thailand. Her research interests are machine learning and numerical computation.

S. Sateanpattanakul received D.Eng. degree from King Mongkut’s Institute of Technology Ladkrabang, Thailand in 2012. He is currently a lecturer in Department of Computer Engineering, Faculty of Engineering at Kampheang Saen, Kasetsart University, Thailand. His research interests are software engineering, Java technology, compiler construction, computer programming language, and artificial intelligence.
Journal of Web Engineering, Vol. 20_3, 853–878.
doi: 10.13052/jwe1540-9589.20313
© 2021 River Publishers