Evaluating the Effect of Developers’ Personality and Productivity on their Intention to Use Model-Driven Web Engineering Techniques: An Exploratory Observational Study*
Magister Glenda Toala Sánchez1, Cristina Cachero2, and Santiago Meliá2
1 Universidad Central de Ecuador, Quito, Ecuador
2 Universidad de Alicante, Alicante, Spain
E-mail: gtoala@uce.edu.ec; ccachero@dlsi.ua.es; santi@dlsi.ua.es
Received October 2018;
Accepted February 2019
Abstract
Context: During the last decades, MDWE approaches have claimed important advantages in terms of short and long term productivity gains. However, the extent of such objective gains is still not clear. Moreover, despite such gains, they suffer from a low level of adoption. Being a complex socio-technical activity, not only productivity but also individual developer’s characteristics such as personality are potential explanatory factors of such situation.
Objective: To study the relationship between (a) intention to use MDWE approaches and (b) individual personality and productivity factors.
Method: We have proposed a conceptual model that has guided the design of an observational study with 77 subjects from the University of Alicante. After following an MDWE course, the subjects were measured in terms of their psychological profile, their productivity and their intention to use an MDWE approach in the future.
Results: The study shows that higher levels of neuroticism relate with lower intention to use MDWE: subjects rating high in this dimension regard MDWE as significantly more difficult to use, and they show lower interest in using MDWE in future developments. Also, it shows how highly effective MDWE developers express a higher intention to use the approach.
Conclusions: According to our data, in order to reach a wider audience, MDWE approaches need to improve their ease of use, and limit the amount of potential developer’s stressors. Also, our data suggest that the MDWE community should focus on improving the effectiveness of the developers, since it is the increased effectiveness rather than the efficiency what is significantly related with the intention to use MDWE in the future.
Keywords: MDWE, Personality, Productivity, Intention to Use, Technology Acceptance Model, EPQ-R, UMAM-Q.
1 Introduction
During the last decades, the Web Engineering research community has advocated the use of Model-Driven Web Engineering (MDWE) to improve the development processes for Web applications. MDWE is based on the assumption that using development methods that rely on models and code generation improves the global developer’s experience. In order to justify its adoption, the MDWE literature reports a set of advantages, among which (a) productivity gains -shorter time-to-market, less human resources and lower maintenance costs-and (b) higher end-user satisfaction stand out [43, 46, 59, 60]. These advantages are increasingly being supported, at least in certain contexts, by empirical evidence [49, 64, 70].
However, in spite of the available data, the paradigm shift from pure code-centric approaches to MDWE that has been expected in industry for years is still to come. A set of surveys and industrial case studies that looked into the MDE adoption problems [90] reported that researchers needed to look beyond the technical benefits such as productivity, maintainability, etc., and focus on social and organizational issues. This same view is supported in [12], where the authors hypothesize that this low level of adoption of MDWE approaches may be partly due to the fact that method assessment efforts still mostly revolve around method technological features (such as separation of concerns, the availability of tools or artifacts traceability, to name a few), while the developers’ attitudes and perceptions of the method are largely dismissed. Some authors argue that such research gap may be caused by technological features being much easier to understand and quantify by technical people [65], who may at the same time undervalue the effect of soft skills on their work [12]. All these arguments are aligned with the fact that, in Software Engineering (SE), human cognitive limitations and personal behaviour have been known to play an important role in job productivity and attitudes since the early seventies [3, 12, 41, 88]. Therefore, understanding what distinguishes individual MDWE practitioners should be an integral part of a well developed theory of MDWE; given the myriad of soft skills and personality factors, there is ample room for empirical studies that help to discern which are the specific sources of differences in MDWE productivity and satisfaction.
The study of the main factors that may impact productivity in SE has been the subject of numerous studies. According to the model of work performance described by Blumberg and Pringle [10, 23], there are three individual dimensions that may influence work productivity: capacity (including variables such as level of education, cognitive abilities and work experience, to name a few), willingness (psychological and emotional characteristics such as motivation, job status or personality) and opportunity (tools, materials, working conditions, and so on) [34].
However, there is a scarcity of studies that focus on the human factors that influence the Intention to Use (I2U) a given SE method or technique [25]. For management, being aware in advance of the risk of developers’ resistance to adopt a new SE method or technique is of the utmost importance in order to prevent the effects that a coercive imposition of the innovation may have on the personnel, including job stress and burnout among IT employees [36] and failure to fully deploy and realize the benefits of the method [45].
Our hypothesis in this sense, based on the existing literature, is that the same three factors that, according to the model of work performance, impacted productivity, together with productivity itself, may contribute to forming the behavioural intention. Such hypothesis is reflected in the Conceptual Model (CM) presented in Figure 1. In order to partially test this hypothesis, in a previous work [84] we explored the relationship between developers’ individual personality traits and MDWE perceptions. In this paper we extend such work with the analysis of the relationship between productivity and developer’s perceptions. With such extension we aim at providing a broader picture regarding which components of personality and productivity are likely to be the stronger influencers on the intention to adopt MDWE methods. The constructs and influence relationships included in this study are stressed with a darker line in Figure 1.
The paper is organized as follows: in Section 2 we present a discussion of the personality, productivity and I2U constructs and their underlying theories, together with a summary of the main reported empirical results regarding their interactions in the context of SE. Section 3 builds up on such related work and discusses the two detailed views of the CM that summarize the main components of the personality and productivity constructs that, according to the existing literature, may affect user attitudes regarding MDWE adoption. Based on such CM, Section 4 presents the planning and execution of the observational study, whose data analysis results are presented in Section 5. Last, Section 6 presents the main conclusions and some further lines of research.
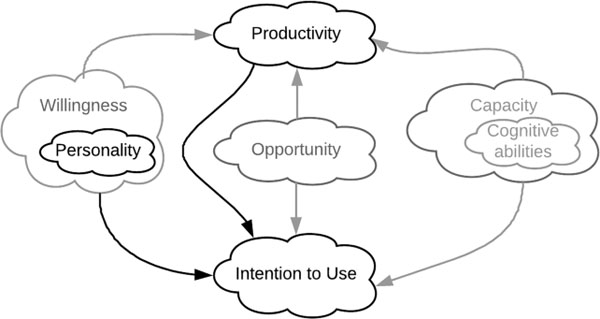
Figure 1 Conceptual model: Overview.
2 Related Work
Human and organizational factors are known to have a substantial effect on job productivity and attitudes [21]. Being software construction a human-intensive labor, software companies are particularly vulnerable to people problems [48]. However, despite this potential risk, the SE community has traditionally neglected people factors [34, 52], which in turn has had a detrimental effect on progress in SE [66].
As we have previously mentioned, our CM (see Figure 1) includes three individual dimensions that, similar to what happens with work performance [34], may influence the I2U a given SE method or technique in the future: capacity, willingness and opportunity. Inside willingness, this paper focuses on personality. Also, our CM considers that the objective developer’s productivity with the method may also impact her intention to use it in the future.
In the next subsections we will first characterize the three main constructs included in this paper (personality, productivity and I2U). Then, we will present a review of the current empirical knowledge regarding the potential relationships between them in the context of SE.
2.1 Personality
According to the APA [4], personality can be defined as individual differences in characteristic patterns of thinking, feeling, and behaving. Personality matters because it predicts and explains behavior and productivity at work [7]. The reason is that people with different personalities will regard a problem from different perspectives and make different decisions in a SE project [52].
A mapping study from 2015 [20] detected how the personality concept has been worked on according to seven different perspectives, among which the dispositional one, which encompasses the traits and types theory, is the one preferred in organizational psychology and in studies on personality in SE. Such traits and types approach assumes that personality consists of stable inner qualities [54] that differ between individuals and influence behavior.
In the context of the traits and types perspective, there are three mainstream theories competing for the attention of SE researchers [42]: (1) the Jung’s Personality Types theory [55], (2) the Five Factor Model (FFM), also known as the Big Five (BF) personality model [53], and (3) the Eysenck’s Hierarchical Three Factor model [32], also referred to as the Giant Three Model or the PEN model [80] (see Table 1).
For a long time, the Jung’s Personality Types theory has been the most popular approach for assessing personality profiles in SE. However, personality psychologists consider BF and PEN to be the two theories better representing the personality structure [5, 34]. Also, comparisons between models have demonstrated the benefits of the BF model in terms of both completeness and measurement reliability [6]. For these reasons, these two theories particularly the BF have been gaining popularity in the last years among the SE community [20].
Table 1 Main Personality Theories, Measurement Instruments and Usage Examples
| Theory | Instruments | Examples of use in SE (personality assessment) |
|---|---|---|
| Jung’s Personality Types [55] | MBTI [74] | [11, 1, 2, 72, 16, 91, 13, 14] |
| Five Factor Model – Big Five [53] | IPIP [38], mini-IPIP [29], NEO-PI-R [19], NEO-FFI [18] | [81, 34, 57, 40] |
| Eysenck’s Hierarchical Three Factor Model – Giant Three Model – PEN [32] | EPQ-R [33] | [56, 15] |
The BF model includes five factors: Extraversion (E), Openness to experience (O), Agreeableness (A), Conscientiousness (C) and Neuroticism (N). The PEN model limits these factors to three: Extraversion (as opposed to introversion (E), Neuroticism (as opposed to stability) (N) and Psychoticism (as opposed to socialization) (P). Also, they have different aims: while the aim of BF is the classification of all major sources of individual differences in personality, the PEN model has the primary aim of identifying those dimension of individual differences which are well grounded in biological processes [77]. Several studies have compared the suitability of the PEN model vs. the BF model [77]. According to them, Eysenck’s E and N dimensions correspond to BF’s E and N dimensions. Eysenck’s P dimension has shown to overlap with A and C from the Big Five. Last, BF’s O, which is the fifth dimension in BF, is also considered to be a component of P in Eysenck’s PEN model. Both models have shown similar psychometric validity, and the discussion remains open regarding whether three or five factors best represent the basic dimensions of personality [80].
For the sake of parsimony, in this paper we have chosen the PEN model as the basis for our CM (see Figure 2). Table 1 presents the thee theories together with their best-known associated measurement instruments and some examples of use in the context of SE.
2.2 Intention to Use
During the last years plenty of theoretical models have emerged aiming at clarifying the factors affecting the adoption of information technologies, tools and methods by individuals and organizations [28]. Most of these models adapt, either directly or indirectly, the Technology Acceptance Model [24] (TAM). TAM is a generic model that can be applied to measuring the acceptance and infusion of a technology or system. The original model explains users’ I2U a new system through two beliefs, perceived usefulness and perceived ease of use. A summary of how it has evolved through time and domains is presented in [28].
Some authors have proposed variations of the TAM model in the context of method adoption [45]. Their research results show how the pattern of intention determinants differs between method adoption and tool adoption, and how not only usefulness, but also compatibility and social pressure all influence method adoption intentions directly, above and beyond the effects of organizational mandate.
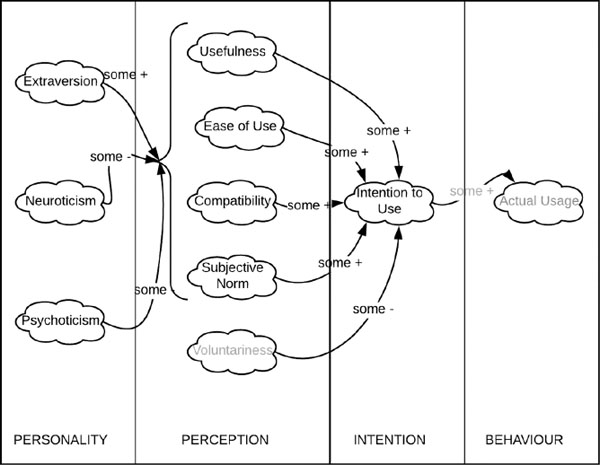
Figure 2 Conceptual model: Personality factors potentially influencing MDWE I2U.
Such method adoption intention has also been studied in the particular case of the Model-Driven Engineering (MDE) field [35, 87]. In this context, the main deviation from the original model consists in the addition of a ‘tool maturity’ dimension. However, the usefulness of such dimension is controversial; in Walderhaug et al. [87], in the context of the healthcare domain, perceived usefulness and ease of use reveal themselves as the most important factors for adopting MDE, while no significant relationship between intention to use and tool productivity or subjective norm were found. On the other hand, the study of Mohagheghi et al. [35], carried out in an industrial context, concludes that tool maturity, together with usefulness and ease of use, are important determinants for the adoption of MDE in industry. Also related to the MDWE adoption intention, in [63] a comparison between the intention to adopt (a) a model-driven, (b) a model-based and (c) a code-centered development method was made. The data shows how the MDWE method was regarded as the least compatible with developers current practices, but the most useful in the long run. Also, it added empirical evidence to the claim that the perceived usefulness of the method seemed to have a much greater impact on intention to use a method than compatibility [76], at least among junior developers.
In an effort to come up with a model that is tailored to the intention to adopt SE methods and summarizes the current knowledge while overcoming some of the well-known problems of the previously existing proposals (lack of proper definitions for the dimensions, use of the same names for different purposes, confusion among types of variables, etc.), in [28] the authors proposed a Unified Method Adoption Model (UMAM) [28]. The UMAM decomposes the I2U construct into the five dimensions on which the research community has reached a wider consensus: Usefulness, Ease of Use, Subjective Norm, Compatibility and Voluntariness. The model includes all the dimensions proven important to assess the intention to adopt SE methods [45], and it comes together with a measurement instrument (the UMAM-Q) that has been validated in our context of use [28].
2.3 Productivity
Following the traditional concept of the industrial production processes, the productivity concept can be defined as the ratio of units of output divided by units of input [83]. The SE community has adapted this definition to the software development context [85], where productivity refers to the inputs (e.g. human resources, time, etc.) spent to produce software deliverables (e.g. features, functions, etc.) [31]. Similarly, the efficiency and effectiveness measures related to productivity have also been adapted [68]; according to the ISO standard [50], effectiveness is the extent to which planned activities are realized and planned results are achieved, while efficiency refers to the relationship between the results achieved and the resources used. It is important to note how measuring software productivity is considered to be significantly more difficult than any other form of productivity. The reason is that software organizations develop new products, as opposed to producing the same product over and over again [85]. This fact, as we have mentioned before, makes of software development a human-based (soft) activity with extreme uncertainties from the outset.
In the context of the MDE paradigm, there are still few documented quantitative benefits that show how developers are more productive by using MDE tools, as well as how developing software using models yields fewer bugs [47, 73]. From them, many validate the use of MDE in academic environments. Such studies report a MDE productivity of 2 to 9 times higher than that obtained with other development paradigms [27, 62]. Moreover, productivity can be up to 20 times higher when the size of the development project increases. These results contrast with those reported by experiments in industrial environments [70], where the results are much more heterogeneous, and range from those that directly report a productivity loss of 10% [22], to some studies that coincide with academic results and report productivity gains ranging from 20% to 35% [58, 61].
2.4 Conceptual Model Relationships: Empirical Evidence
Once the main constructs of our CM have been defined, next we present a review of the main empirical studies that have analyzed (a) the Personality-I2U and (b) the Performance-I2U relationships, which are the main focus of this paper.
2.4.1 Personality and intention to use
Regarding the relationship between personality and I2U, several authors have reported significant results.
In [25] the authors propose a conceptual model that depicts what personality traits (BF model) can be useful predictors of the different dimensions of the I2U construct, defined on the basis of an extended version of the TAM model. They then validate the model with data gathered from 180 new users of a collaborative technology. Their data show how both neuroticism and agreeableness influence usefulness, while extraversion, consciousness and agreeableness moderate the relationships U-I2U and SN-I2U.
In [51] the authors use the BF model to show how higher levels of neuroticism are related with lower attachment to development processes, while higher levels of agreeableness, openness to experience and conscientiousness are related to higher satisfaction with the adoption of processes; no relationship is found between extroversion and process attachment or satisfaction.
In [37] the authors focus on the influence of different human factors over the adoption and transition towards Agile methods. The reason for this focus is that, given the fact that Agile methods are much more people-oriented than traditional SE development methods, individual characteristics are likely to play a much more significant role. The results show how certain personality traits such as individualism or aversion to change are impediments to Agile adoption, while others such as enthusiasm act as change accelerators.
In [71] the authors study the process of adoption/rejection of innovative SE processes and practices in industrial settings. Based on a qualitative study, they conclude that past experiences, personality types and repeated behaviour all have a strong influence on behavioural intention to adopt such new SE practices.
In [36] the authors study how tolerance of ambiguity and openness to experience associate with a higher IT professionals’ ability to adapt to a technological innovation.
In [34] the authors study the relationship between personality and general views about SE in an industrial context. They conclude that higher levels of extraversion is linked to preferring to work in teams, while higher levels of openness is linked to preferring to take responsibility for a whole project and not individual parts.
Last, regarding MDWE, the study presented in [84] shows how developers with lower levels of neuroticism regard MDWE methods as significantly easier to use, and show a greater intention to adopt the method in the future.
2.4.2 Productivity and intention to use
The second relationship in Figure 1 is that between productivity and I2U. To our knowledge extent there is a research gap regarding the potential differences in usage intention depending on the productivity achieved with a given SE method or technique. One notable exception is the study of Hutchinson et al. [49] regarding the MDE adoption intention. This study concludes that, although the productivity increases with the use of MDE tools, such improvement is not considered significant enough to drive an adoption effort in companies.
Next, we dive into the CM that has driven the empirical study presented in this paper.
3 Conceptual Model
In setting an agenda for the empirical assessment of the effect of human factors on MDWE productivity and I2U, and in order to provide scientific rigour to the results, it would be ideal that such empirical assessment revolved around a theoretical model [20]. Theoretical models structure knowledge and provide explanations and understanding to observed phenomena in terms of basic concepts and underlying mechanisms [44]. Therefore, its existence greatly contributes to the soundness of the empirical work, since it provides guidance in targeting what behaviour to study and in assessing a study’s results [86, 89].
Unfortunately, to the best of our knowledge, such theoretical model does not exist so far. Also, some previous empirical findings [84] suggest that CMs devised for other technology adoptions such as the one presented in [25] may be missing important relationships such as the one between neuroticism and ease of use, which is why they may not fit the reality of the MDWE adoption process.
For this reason, in this paper we propose a CM to guide our research until the community develops such theory. Figure 1 already presented a global overview. Here, the partial view presented in Figure 2 further dives into the potential relationships among personality factors and I2U factors. On the other hand, given the lack of related work regarding the relationship between productivity and I2U (see Section 2.4.2), Figure 3 reflects our current understanding of the matter.
3.1 Definition of the Conceptual Model Constructs and Relationships
In Figures 2 and 3 we can observe the different constructs for (a) personality, (b) intention to use and (c) productivity. As it was explained in Section 2, for the definition of personality we have abode by the PEN model, while, for the I2U definition, we have used the Usefulness, Ease of Use, Compatibility and Subjective Norm factors of the UMAM model. The reason why we have left out of this paper the Voluntariness factor is that the context of our study, as we will explain later, did not allow us to test that factor. Also, it is assumed to have a much lower impact on the adoption intention of methods than the remaining factors [49]. Last, we have based the definition of the productivity construct on its adaptation to the SE context [31] and the ISO standard [50].
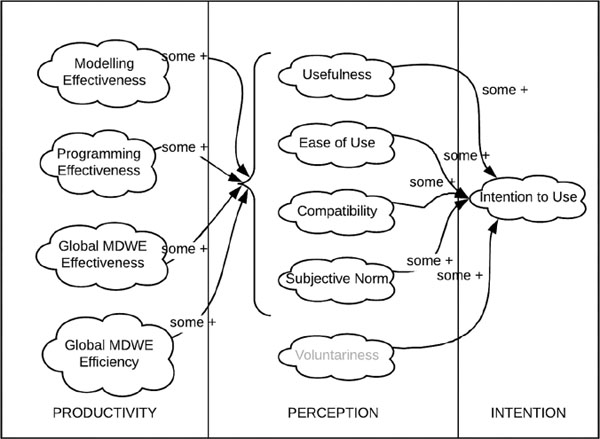
Figure 3 Conceptual Model: Productivity factors potentially influencing MDWE I2U.
The detailed definitions of each factor are as follows:
- Personality. It is made up of three dimensions: Extraversion/ Introversion (E), Neuroticism/Stability (N), and Psychoticism/ Socialization (P).
- – E: Degree to which a person is sociable and communicative. Higher scores on this dimension imply being more outgoing, talkative, and more in need of external stimulation.
- – N: Degree to which a person shows emotional instability. Higher scores on this dimension imply being more prone to depression, anxiety, and obsessive behaviours. Neurotic people have lower tolerance to stress and uncertainty, and they are easily nervous or upset.
- – P: Degree to which a person shows vulnerability to impulsive, aggressive or low-emphatic behaviours. Higher scores on this dimension also imply higher levels of assertiveness, orientation towards achievement, and tough-mindedness, among others. P is also related to higher levels of creativity and divergent thinking.
- Intention to Use. It is made up of five dimensions: Usefulness (U), Ease of Use (EoU), Compatibility (C), Social Norm (SN) and Voluntariness (V). All these factors load into a global Intention to Use (I2U) factor.
- – U: Degree to which a person believes that using a particular method will enhance his/her job productivity.
- – EoU: degree to which a person believes that using the method would be free of effort.
- – C: Degree to which the method is perceived as being consistent with existing values, principles, practices and the past experience of potential adopters
- – SN: Degree to which developers perceive that others who are important to them think that they should use the method.
- – V: Extent to which potential adopters perceive the adoption decision to be non-mandated; it represents the felt pressure from the social environment on the potential adopter.
- – I2U: Global intention to use the method in the future if given the chance.
- Productivity. Following the quantitative productivity metrics recommendations for MDE presented in [47], MDWE productivity has been defined in terms of design development effort (Modelling Effectiveness, MEfs), implementation development effort (Programming Effectiveness, PEfs), MDWE Effectiveness (MDWEEfs) and MDWE Efficiency (MDWEEfy).
- – MEfs: ratio of correct modeling tasks divided by total number of modeling tasks.
- – PEfs: ratio of correct programming tasks divided by total number of programming tasks.
- – MDWEEfs: ratio of correct MDWE tasks (both modelling tasks and programming tasks) divided by total number of MDWE tasks.
- – MDWEEfy: ratio of correct MDWE tasks divided by the development time required.
In Figure 2, the reader can observe how, given the lack of consensus among researchers (see Section 2.4.1) and the exploratory character of this study, the three main personality dimensions according to the EPQ-R model (E, N and P) are assumed to be potentially related with the developer’s perception regarding U, EoU, C and SN of MDWE methods. This differs from the proposal presented in [25] in several aspects:
- In [25] the authors considered that extraversion did not directly affect the U, EoU, C and SN perception variables. However, an argument could be made that more extroverted people may regard MDWE methods more optimistically, and may therefore score higher on U, EoU, C and SN.
- Also, in [25] the authors considered that neuroticism only affected U and SN. However, in [84] the relationship N-EoU was found significant in the MDWE context, which means that their CM proposal may be incomplete for this context. MDWE methods are usually accused of allowing for lower code control. This might augment the potential feeling of anxiety, so people scoring higher in neuroticism may regard the method not only as less useful and with a lower SN, but also more difficult to use and less compatible.
- Last, since MDWE methods are oriented towards achievement, people scoring higher on P may regard the methods as not only more useful (as stated by [25]) but also easier to use, more compatible and with a higher SN.
If we now look at Figure 3 regarding the relationship between Productivity and Intention to Use, the reader can observe how the CM opens up the exploration of the fact that higher productivity values may positively impact any of the perception components of the I2U model (U, EoU, C, SN).
4 Description of the Observational Study
Observational studies are a kind of empirical study where, contrary to experiments or quasy experiments, the independent variables are not manipulated but rather observed, and, based on such observations, the researcher tries to draw some conclusions [9]. They provide a way to scientifically observe phenomena and report data in situations such as ours in which we cannot manipulate the variables (neither the personality of the developers nor their productivity with respect to MDWE methods). As their main disadvantage, they do not permit to establish cause-effect relationships, but only assess correlations or group differences. Next we describe our experimental design and main outcomes.
4.1 Goals and Context Definition
Following the GQM template [8], our empirical study is aimed at analyzing the intention to use an MDWE method for the purpose of evaluating its relationship with respect to the personality and productivity from the point of view of junior software developers. Our research questions (RQ) can be formulated as follows:
- RQ1: Is there a relationship between developer’s I2U an MDWE method and personality?
- RQ2: Is there a relationship between developer’s I2U an MDWE method and performance?
The MDWE method chosen to carry out the study in order to answer these questions has been the OOH4RIA approach, which we introduce next.
4.1.1 The MDWE OOH4RIA Method
OOH4RIA is an MDWE approach that extends the OOH method [39] and proposes a complete development process based on a set of models and transformations that allow to go from conceptual models to code. OOH4RIA is also equipped with an Implementation Development Environment (IDE) [67] that offers support for both the design activities and the automatic code generation process. OOH4RIA is free of charge for universities, and it is taught as part of the Multimedia degree in which the empirical study took place. In this experiment, the reason for selecting OOH4RIA is two-fold. On the one hand, the MDWE community does no favor any specific MDWE approach over the other, so, to the best of our knowledge, the selection of one or other is a highly subjective choice. On the other hand, the OOH4RIA modelling artifacts included in this study are based on the Unified Modelling Language (UML) which is the de facto standard in SE.
4.2 Study Planning
We planned to run the observational study with 81 students enrolled in the ‘Software Design’ course (5th semester of the Multimedia degree) at the University of Alicante in January 2018. In order for the subjects to be able to take part in the study, a 15-hour training with OOH4RIA was scheduled for November and December 2017. In January, both the execution of an objective proof under exam conditions and the fill-in of two questionnaires was scheduled. The questionnaires were prepared online using the Qualtrics platform. For the objective proof, a Google form was prepared to guide the assessment of the modelling and programming efficiency measures, and in this way increase their reliability1. Last, a set of t-test comparisons was planned regarding the MDWE perceptions between the high achievers (percentile>=66%) and the low achievers (percentile<=33%) on each of the personality and productivity scales.
4.2.1 Objective test
The objective proof consisted in using the OOH4RIA approach to generate a full-fledged application. Such development included both modelling and programming activities. To do that, the subjects has a specification that explained the static part of the system. Based on that specification, the subjects had to model the entities (classes, attributes, operations and relationships with cardinalities) in an OOH4RIAdomain model. The last part of the document consisted in a behavioral specification of the system from which the subjects had to implement three operations using C#. All the activities were planned to be achievable in 2 hours, and the complexity of the system was adjusted to that time restriction.
4.2.2 Questionnaires
In order to operationalize the constructs included in the CM (Figures 2 and 3), the following two questionnaires were selected:
- EPQ-R: Spanish version [33]. This questionnaire includes the items for the three scales included in the CM: E (19 items), N (23 items), and P (23 items).
- UMAM-Q [28]: This questionnaire, which shares many features with questionnaires such as [69] and [30], was developed to specifically measure SE method adoption. It includes 42 items divided into six scales: U (7 items), EoU (7 items), C (7 items), SN (7 items), V (7 items) and I2U (7 items).
4.2.3 Variables
As it was mentioned before, the context in which our study took place limited the set of perception variables to measure. Namely, voluntariness could not be measured in the context of the course, where all subjects were required to use OOH4RIA. Also, evaluating the actual usage would have required a follow-up of the subjects once they have entered the work force, which falls out of the scope of this paper. The dismissal of these variables has been marked in Figures 2 and 3 by writing the corresponding dimensions in a lighter shadow of grey.
The set of variables included in the study, all measured at a continuous level, were the following (range specified in brackets):
- Independent Variables (IV):
- – Personality Variables: E [0..19], N [0..23], P [0..18]
- – Productivity Variables: MEfs [0..100], PEfs [0..100], MDWEEfs [0..100], MDWEEfy [0..100]
- Dependent Variables (DV):
- – Perception Variables: U [7..49], EoU [7..49], C [7..49], SN [7..49]
- – Intention Variable: I2U [7..49]
The definition of these variables matches that of the corresponding CM constructs presented in Section 3.
4.2.4 Hypotheses description
Based on the RQs and the CM views of Figures 2 and 3, we established the following sets of hypotheses:
- Personality-I2U hypotheses
- – HPs1: Subjects with high vs low levels of E differ on their perceptions regarding U, EoU, C, SN and I2U of the OOH4RIA method.
- – HPs2: Subjects with high vs low levels of N differ on their perceptions regarding U, EoU, C, SN and I2U of the OOH4RIA method.
- – HPs3: Subjects with high vs low levels of P differ on their perceptions regarding U, EoU, C, SN and I2U of the OOH4RIA method.
- Productivity-I2U hypotheses
- – HPd4: High vs Low achievers regarding Modelling Effectiveness differ on their perceptions regarding U, EoU, C, SN and I2U of the OOH4RIA method.
- – HPd5: High vs Low achievers regarding Programming Effectiveness differ on their perceptions regarding U, EoU, C, SN and I2U of the OOH4RIA method.
- – HPd6: High vs Low achievers regarding MDWE Effectiveness differ on their perceptions regarding U, EoU, C, SN and I2U of the OOH4RIA method.
- – HPd7: High vs Low achievers regarding MDWE Efficiency differ on their perceptions regarding U, EoU, C, SN and I2U of the OOH4RIA method.
4.3 Execution of the Study
4.3.1 Subjects
On the scheduled date, the 81 initial set of subjects were asked to develop a software project following the OOH4RIA method. From them, 2 subjects dropped out of the course before the study data gathering phase had started. Since the subjects were not aware of the fact that they were being asked to participate in the study, we can assume that the results of the experiments have not been compromised by their drop out. The final set of observations thus corresponds to the observations of the remaining 79 subjects, none of which had had any prior experience with MDWE. The final sample was made up of 63 men and 16 women. The mean birth year of the participants was 1995 (23 years old), with a median of 1996 for men and 1997 for women.
Out of the 79 subjects, one man and one woman filled the EPQ-R and UMAM-Q questionnaires, but failed to show the day of the objective proof. From the 77 subjects who carried out the objective proof, 24 failed to fill in the UMAM-Q questionnaire, while 22 failed to fill in the EPQ-R questionnaire. Figure 4 shows the number of subjects that participated in each part of the study. When asked about the reasons for not filling in the questionnaires, all the subjects reported lack of time as the only reason, while none of them expressed any kind of concern regarding having to answer personality or I2U-related questions. This notwithstanding, we cannot discard that possibility, so this poses a risk to the internal validity of the study that will be discussed in Section 5.4. The complete versions of the questioners used in this experiment are available as part of the experimental package.2
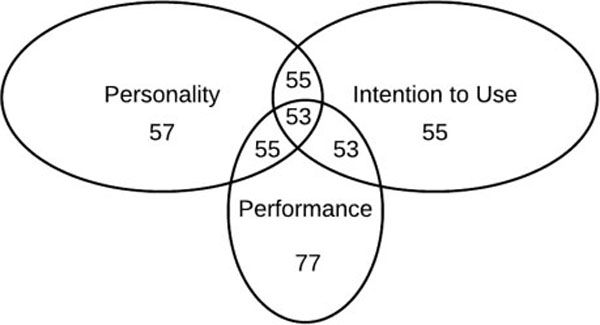
Figure 4 Number and descriptive statistics of subjects.
5 Data Analysis
5.1 Questionnaire Validation
Table 2 presents the Cronbach’s α coefficient for both the EPQ-R and the UMAM-Q scales. In EPQ-R, E and N show a high reliability. These results are aligned with the reported reliability of the published questionnaire, where the reliability of E is between 0.80 (women) and 0.82 (men), and the reliability of N is 0.86 for both men and women [33]. In the questionnaire report the reliability of P is lower than for E and N (around 0.76). However, our results show an even lower level of reliability (0.52) that poses construct threat to the validity of the study, as we will discuss in Section 5.4. For this reason, in this paper we have dismissed the analysis of the P construct. As for the UMAM-Q, all the scales show a Cronbach’s α higher than 0.7, which is proof of sufficient internal consistency [82].
Table 2 Reliability of EPQ-R and UMAM-Q scales
| Instr | Scale | Items | Cronbach’s α |
|---|---|---|---|
| EPQ-R | E | 19 | 0.88 |
| N | 23 | 0.87 | |
| P | 23 | 0.52 | |
| UMAM-Q | U | 7 | 0.71 |
| EoU | 7 | 0.80 | |
| C | 7 | 0.84 | |
| SN | 7 | 0.85 | |
| I2U | 7 | 0.95 |
Table 3 Descriptive Statistics for the EPQ-R scales
| EPQ-R | |||||||
|---|---|---|---|---|---|---|---|
| E | N | P | L | ||||
| M | SD | M | SD | M | SD | M | SD |
| 11.67 | 4.93 | 11.24 | 5.60 | 5.69 | 2.32 | 8.22 | 3.02 |
Table 4 Descriptive Statistics for the UMAM-Q scales
| UMAM-Q | |||||||||
|---|---|---|---|---|---|---|---|---|---|
| U | EoU | C | SN | I2U | |||||
| M | SD | M | SD | M | SD | M | SD | M | SD |
| 33.64 | 8.64 | 27 | 7.47 | 29.64 | 5.47 | 29.36 | 6.87 | 29.56 | 10.93 |
Table 5 Descriptive Statistics for the productivity measures
| Productivity | |||||||
|---|---|---|---|---|---|---|---|
| MEfs | PEfs | MDWEEfs | MDWEEfy | ||||
| M | SD | M | SD | M | SD | M | SD |
| 71.02 | 19.13 | 28.55 | 25.07 | 54.42 | 14.86 | 0.50 | 0.13 |
5.2 Descriptive Statistics
In Tables 3–5 the descriptive statistics (Mean and Standard Deviation) of the measurements for all the constructs are presented.
5.3 Hypothesis Analysis
In order to study whether differences in personality and/or productivity (the IVs) are related with differences in U, EoU, C, SN and I2U (the DVs), for each personality trait (E, N, P) and each productivity variable (MEfs, PEfs, MDWEEfs, MDWEEfy) we classified the subjects into two groups (Low, High), whose cut points were the percentile 33 and 66 of the corresponding scores. In cases where several subjects had the same cut score, we assigned all of them to the group who initially included more subjects with that score. Tables 6 and 7 present the final number of members and the cut scores for the E and N High/Low groups, together with their descriptive statistics. Tables 8–11 do the same for the productivity variables.
Then, we carried out a set of statistical analyses. For all of them, the selected statistical procedure was an independent-samples t-test. This test makes six assumptions. The first three (one dependent variable measured at the continuous level, one independent variable that is dichotomous, and independence of observations) are automatically met by the mere design of the observational study: all the IVs are dichotomous (Low group vs High group), all DV are measured at the continuous level, and the two sets of measures were unrelated.
The other three relate to the nature of the data:
- There should be not significant outliers data points more than 1.5 box-lengths from the edge of their box in a boxplot in the two groups of the independent variable in terms of the dependent variable. Outliers were detected by inspecting boxplots for values greater than 1.5 box-lengths from the edge of the box. After a careful examination, which included the time it had taken the subjects to complete the questionnaires and the tasks, we concluded that, when the outliers appeared, they were not the result of any data entry error nor a measurement error, but genuinely unusual values, and therefore we kept them in the analyses.
- The dependent variable should be approximately normally distributed for each group of the independent variable. We tested whether the data was normally distributed for each category (Low, High) of the independent variable with the Shapiro-Wilk test (see column SW in Tables 6–11). This test is recommended rather than the Kolmogorov-Smirnov for small sample sizes [75], where the visual interpretation of the Normal Q-Q Plots or other graphical methods is difficult. When the test did not hold, we checked the skewness of both groups. If only one group was skewed, or if both group distributions were skewed in a similar manner, we proceeded with the test, since independent samples t-test is considered robust to violations of normality [79]. Only in cases where the two groups were skewed in different directions (and therefore the violation was more acute), did we plan to solve it by applying a data transformation. In our data, such transformation was not needed in any of the four violations encountered (see the Shapiro Wilk (SW) values marked with an * in Tables 6–11).
- There should be homogeneity of variances. In all the analyses the homogeneity of variance was checked with Levene’s test, which showed p values greater than 0.05 for all the analyses (see Tables 6–11).
5.3.1 HPs1: Extroversion and developer’s perceptions
For the E scale, we classified as extroverts (subjects with high extraversion levels) those that have a score of 16 or more on the scale (15 subjects out of 55). Introverts, on the other hand, scored 8 or less on the scale (19 subjects out of 55). Data are mean ± standard deviation, unless otherwise stated.
If we look at Table 6, we can see how extroverts regard the OOH4RIA method as more useful and more easy to use, and show a slightly higher inclination towards using it in the future. However, such differences are not significant (see results of the t-tests in Table 6). Also, neither the perceived C nor SN seem to be related with the level of extroversion.
5.3.2 HPs2: Neuroticism and developer’s perceptions
For the N scale, we have classified as neurotics those that have a score of 14 or more on the scale (18 subjects out of 55). Stable subjects, on the other hand, are those who have scored 7 or less (17 subjects out of 55).
Table 6 Extraversion and developer’s perceptions (M: Mean, SD: Standard Deviation, Lev: Levene, SW: Saphiro-Wilk, EL: Low Extraversion, EH : High Extraversion).
| Pers | I2U | EL (<=9) (15) | EH (>=16) (19) | Lev | t | df | p | ||||
|---|---|---|---|---|---|---|---|---|---|---|---|
| M | SD | SW | M | SD | SW | ||||||
| E | U | 31.74 | 9.48 | 0.023* | 35.73 | 6.91 | 0.469 | 0.098 | −1.37 | 32 | 0.181 |
| EoU | 25.74 | 8.13 | 0.345 | 26.80 | 7.23 | 0.882 | 0.257 | −0.40 | 32 | 0.694 | |
| C | 29.53 | 5.47 | 0.411 | 29.27 | 4.46 | 0.652 | 0.15 | 0.460 | 32 | 0.883 | |
| SN | 29.74 | 6.57 | 0.822 | 29.00 | 7.83 | 0.263 | 0.30 | 0.580 | 32 | 0.767 | |
| I2U | 27.47 | 11.03 | 0.076 | 29.13 | 10.92 | 0.402 | −0.44 | 0.611 | 32 | 0.665 | |
Table 7 Neuroticism and developer’s perceptions (M: Mean, SD: Standard Deviation, Lev: Levene, SW: Saphiro-Wilk, NL: Low Neuroticism, NH: High Neuroticism)
| Pers | I2U | NL (<=7) (17) | NH (>=14) (18) | Lev | t | df | p | ||||
|---|---|---|---|---|---|---|---|---|---|---|---|
| M | SD | SW | M | SD | SW | ||||||
| N | U | 35.33 | 7.14 | 0.127 | 32.41 | 9.33 | 0.098 | 0.250 | 1.04 | 33 | 0.304 |
| EoU | 30.94 | 6.61 | 0.570 | 24.18 | 8.20 | 0.613 | 0.163 | 2.69 | 33 | 0.011* | |
| C | 29.56 | 5.91 | 0.643 | 29.18 | 5.43 | 0.204 | 0.760 | 0.20 | 33 | 0.845 | |
| SN | 30.06 | 7.01 | 0.764 | 30.00 | 8.07 | 0.125 | 0.606 | 0.02 | 33 | 0.983 | |
| I2U | 33.78 | 10.42 | 0.435 | 27.06 | 11.91 | 0.342 | 0.470 | 1.78 | 33 | 0.084 | |
In Table 7, we can see how more stable subjects regard the OOH4RIA method as more useful and easier to use, and show a slightly higher inclination towards using it in the future. Also, neither the perceived C nor SN seem to be related with the level of neuroticism. If we now look at the t-test results in 7, we can observe how the EoU is significant. This means that there is a significant relationship between higher levels of stability and higher perceived EoU of the OOH4RIA method.
5.3.3 HPs3: Psicoticism and developer’s perceptions
For the P scale, given the low reliability of the scale, we have dismissed its analysis.
5.3.4 HPd1: Modelling effectiveness and developer’s perceptions
Regarding Modelling Effectiveness (%) (see Table 8), we have classified as high achievers those that have correctly modelled at least a 82.14% of the system (17 subjects), while low achievers are those subjects whose score has fallen below 62.50% (18 subjects). In Table 8 we can observe how high achievers perceive OOH4RIA to be more useful, easier to use, more compatible with their way of working, and more supported by their peers. Overall, they are more likely to adopt it as a development method in the future than low achievers. These differences are significant for EoU and SN.
Table 8 Modelling Effectiveness and developer’s perceptions (M: Mean, SD: Standard Deviation, Lev: Levene, SW: Saphiro-Wilk, MEfsL: Low Modelling Effectiveness, MEfsH: High Modelling Effectiveness)
| Perf | I2U | MEfsL (<=62.5) (18) | MEfsH (>=82.14) (17) | Lev | t | df | p | ||||
|---|---|---|---|---|---|---|---|---|---|---|---|
| M | SD | SW | M | SD | SW | ||||||
| MEfs | U | 30,67 | 8,79 | 0.731 | 35,41 | 8,68 | 0.008* | 0.955 | −1,61 | 33 | 0,118 |
| EoU | 23 | 7,15 | 0.917 | 30,18 | 6,14 | 0.392 | 0.337 | −3,18 | 33 | 0,003* | |
| C | 28,83 | 6,68 | 0.992 | 30,29 | 4,15 | 0.407 | 0.140 | −0,77 | 33 | 0,446 | |
| SN | 26,61 | 6,61 | 0.102 | 31,94 | 6,37 | 0.374 | 725 | −2,43 | 33 | 0,021* | |
| I2U | 26,22 | 11,15 | 0.643 | 32,76 | 9,38 | 0.918 | 0.480 | −1,87 | 33 | 0,070 | |
Table 9 Programming Effectiveness and developer’s perceptions (M: Mean, SD: Standard Deviation, Lev: Levene, SW: Saphiro-Wilk, PEfsL: Low Programming Effectiveness, PEfsH : High Programming Effectiveness)
| Perf | I2U | PEfsL (<=13.33) (18) | PEfsH (>=40) (17) | Lev | t | df | p | ||||
|---|---|---|---|---|---|---|---|---|---|---|---|
| M | SD | SW | M | SD | SW | ||||||
| PEfs | U | 34 | 7,98 | 0.877 | 36,24 | 8,85 | 0.109 | 0.662 | −0,79 | 33 | 0,438 |
| EoU | 27,56 | 7,24 | 0.191 | 28,47 | 8,09 | 0.851 | 0.686 | −0,35 | 33 | 0,726 | |
| C | 30,28 | 5,50 | 0.657 | 31,71 | 5,42 | 0.427 | 0.799 | −0,77 | 33 | 0,445 | |
| SN | 29,33 | 6,01 | 0.712 | 30,35 | 6,70 | 0.226 | 0.570 | −0,47 | 33 | 0,638 | |
| I2U | 30,72 | 10,89 | 0.348 | 34 | 10,64 | 0.390 | 0.820 | −0,90 | 33 | 0,375 | |
5.3.5 HPd2: Programming effectiveness and developer’s perceptions
Regarding Programming Effectiveness (%), in Table 9 we can see how high achievers (those scoring 40 or higher on the study, 17 subjects) regard MDWE as slightly more useful, easier, and more compatible. Also, they feel more encouraged by their environment to use it and, in general, they show a higher intention to use the method than low achievers (those scoring 13.33 or less, 18 subjects). However, none of the differences are significant.
5.3.6 HPd3: MDWE effectiveness and developer’s perceptions
If we now look at the aggregated measure MDWE Effectiveness (%), in Table 10 we can observe how high achievers are those subjects that have obtained a total MDWE development score (modelling + programming) of 40% or higher (18 subjects). On the other hand, low achievers are those subjects whose score has been 13.33% or lower (18 subjects). In Table 10, we can see how high achievers again think that OOH4RIA is more useful, easier to use, more compatible with their way of working and more supported by their working environment. In agreement with such perceptions, they show a greater inclination towards using it in the future. U, SN and I2U are significantly higher while EoU and C, while not significant, are very close.
Table 10 MDWE Effectiveness and developer’s perceptions (M: Mean, SD: Standard Deviation, Lev: Levene, SW: Saphiro-Wilk, MDWEEfsL: Low MDWE Effectiveness, MDWEEfsH: High MDWE Effectiveness)
| Perf | I2U | MDWEEfsL | MDWEEfsH | Lev | t | df | p | ||||
|---|---|---|---|---|---|---|---|---|---|---|---|
| M | SD | SW | M | SD | SW | ||||||
| MDWEEfs | U | 30,06 | 10,04 | 0.512 | 37,11 | 8,65 | 0.020* | 0.314 | −2,26 | 34 | 0,03* |
| EoU | 24,61 | 7,88 | 0.612 | 29,11 | 6,65 | 0.914 | 0.248 | −1,85 | 34 | 0,073 | |
| C | 28,33 | 6,86 | 0.982 | 32 | 4,86 | 0.070 | 0.141 | −1,85 | 34 | 0,073 | |
| SN | 26,67 | 6,39 | 0.171 | 32,39 | 5,95 | 0.110 | 0.607 | −2,78 | 34 | 0,009* | |
| I2U | 25,50 | 11,58 | 0.441 | 34,83 | 8,37 | 0.505 | 0.112 | −2,77 | 34 | 0,009* | |
Table 11 MDWE Efficiency and developer’s perceptions (M: Mean, SD: Standard Deviation, Lev: Levene, SW: Saphiro-Wilk, MDWEEfyL: Low MDWE Efficiency, MDWEEfyH: High MDWE Efficiency)
| Perf | I2U | MDWEEfyL | MDWEEfyH | Lev | t | df | p | ||||
|---|---|---|---|---|---|---|---|---|---|---|---|
| M | SD | SW | M | SD | SW | ||||||
| MDWEEfy | U | 32,83 | 8,73 | 0.363 | 36,67 | 7,99 | 0.003* | 0.534 | −1,37 | 34 | 0,178 |
| EoU | 26 | 7,24 | 0.495 | 29,06 | 7,29 | 0.550 | 0.960 | −1,26 | 34 | 0,216 | |
| C | 29,61 | 5,84 | 0.917 | 31,39 | 5,14 | 0.075 | 0.536 | −0,97 | 34 | 0,339 | |
| SN | 28,83 | 5,95 | 0.484 | 32,17 | 6,44 | 0.289 | 0.245 | −1,61 | 34 | 0,116 | |
| I2U | 28,89 | 11,10 | 0.341 | 33,50 | 10,26 | 0.608 | 0.817 | −1,29 | 34 | 0,204 | |
5.3.7 HPd4: MDWE efficiency and developer’s perceptions
Last, for the overall MDWE Efficiency measure (MDWEEfs/min), we have classified as low achievers those that have a score of 0.42 or less (18 subjects), and high achievers as those who have a score of 0.55 or more (18 subjects). In Table 11, we can see how more efficient subjects regard OOH4RIA as more useful, easier, more compatible, and more supported by their working environment. Therefore, they show a greater intention to use it in the future. However, contrary to what happens with the MDWE effectiveness, none of these differences are significant.
5.4 Threats to Validity of the Study
We have followed the classification proposed by Cook and Campbell [17] for the classification of the main threats to the validity of the study: internal, external, construct and conclusion.
Threats to internal validity are concerned with the possibility of hidden factors which provide alternative explanations for the result. The main threat to the internal validity of this study is the fact that 24 subjects out of 77 chose not to answer one or both questionnaires (experimental mortality). Although, when asked about why they hadn’t answered, they put forward lack of time reasons, we cannot be sure that their personality profile did not have any effect on such decision. This risk is unfortunately unavoidable, since ethical reasons required the fulfillment of the questionnaires to be voluntary, and the load of work at the end of the term tends to be high.
Threats to external validity are concerned with generalization of the results. Our main threat to the external validity is that subjects are students of the Multimedia degree, which is unrepresentative of the population of MDWE developers in the industry. Also, the use of a specific MDWE method like OOH4RIA and its tool constitutes a limited environment and can influence the results.
Threats to construct validity refer to the relationship between theory and observation. Both the theory and the scales used to measure the different constructs are widely accepted by the research community. Also, the instruments used have proven their reliability and validity in different settings. However, the P scale has showed a low internal validity in our context. We have mitigated this threat by excluding the P variable from the study.
Last, threats to conclusion validity refer to the relationship between the treatment and the outcome. All the statistical analyses have been preceded by tests that checked that the assumptions of the statistical procedure were not being violated. In the four cases where the normality of the High or the Low group was violated, we checked that such violation was not severe [79], and planned the use of data transformations otherwise.
6 Conclusions and Future Lines of Research
This paper has presented a CM for the study of the effect of personality and productivity on the perceptions and adoption intentions regarding MDWE. Also, it has presented an exploratory observational study to assess whether there are significant differences between groups of subjects scoring at the high vs low level of the personality and productivity IVs with respect to the perception and intention DVs. Our purpose with these two contributions is fostering the discussion among the research community regarding individual differences and how they may be affecting the use of MDWE methods and tools.
We believe that, in order for the MDWE research community to come up with a CM that truly reflects the MDWE method adoption influencers, substantial empirical research needs to be done. In this sense our paper is only another drop in the bucket. Only with many more data will it be possible to apply much more sophisticated statistical analysis that serve to validate alternative CMs in order to better understand which are the real influencers of MDWE adoption.
This notwithstanding, even with the simple exploratory analyses presented in this paper, some hypotheses regarding how an MDWE adoption CM should evolve have emerged, which we discuss next.
6.1 RQ1: Personality and I2U
According to the initial CM, extroverted subjects regard MDWE methods more optimistically, which explains higher scores on U, EoU, C and SN. Our data (see Table 6) seems to confirm higher ratings for U, but not for EoU, C or SU, where the differences are very small.
Also, none of the results are significant. Therefore we can conclude that, at least in our experimental setting, Extroversion does not pay a significant role as a predictor of MDWE adoption (although we cannot discard a role as a moderator variable in other relationships, as was pointed out in [25]). These finding are consistent with the results of other studies [51].
Our initial CM also suggest that stable (as opposed to neurotic) people shows more positive perceptions about MDWE methods. Again, our data confirms such trend for U and EoU, but not for C or SN. Of particular interest is the statistically significant differences in EoU between developers scoring high and low in N. Such difference was not even considered in previously proposed CMs [25]. One possible explanation is the learning curve of MDWE methods and the perceived lack of control of the produced code [63]. Neurotic people (characterized by presenting a lower tolerance to uncertainly) may more acutely suffer these MDWE disadvantages. It is important to note how such effect is quite big, to the point of making differences in the global I2U variable nearly statistically significant (see Table 7).
Last, the CM suggests that, since MDWE methods are oriented towards achievement, people scoring higher on P may regard the methods as more useful, easy to use, compatible and with a better community support. However, the lack of reliability of the scale in our analysis has prevented us from being able to explore that relationship.
6.2 RQ2: Productivity and I2U
The productivity analyses presented in this paper show how it is the MDWE effectiveness rather than the MDWE Efficiency what influences MDWE perceptions.
Based on these results a new hypothesis emerges. If we accept the fact that increased efficiency is important for MDWE adoption in general [63], one possible explanation for this result is that, once an acceptable level of efficiency has been reached, further improving such efficiency does not impact the method perception. Following the definitions provided by the KANO model [78], we would say that MDWE Efficiency is perceived as a must-be attribute of MDWE methods, that is, a requirement that the developers expect and is taken for granted. MDWE Effectiveness, on the other hand, seems to be regarded as a one-dimensional quality, that is, it results in a greater I2U when fulfilled and a lower I2U when not fulfilled.
Therefore, we believe that MDWE improvement efforts should be directed towards supporting developers in achieving better effectiveness in their activities, rather than focusing on reaching higher levels of efficiency. Such support could consist in the inclusion of a more powerful modelling validation that assisted the developer in diminishing the number of errors both in the models and in the code generated from them.
6.3 Future Lines of Research
As future work we plan to carry out replications of this empirical study, if possible with different MDWE approaches and audiences, in order to augment the external validity of the results and provide more empirical data that serve to evolve and validate with more powerful statistical techniques such as Structural Equation Modelling a useful CM for the MDWE community.
Also, we plan to include in our replicas the use of the BF model in addition to the PEN model for the characterization of personality. The purpose of such addition is two-fold: on the one hand we want to check whether the N and E dimensions are actually equivalent in both models when applied to the MDWE domain. On the other hand, we want to check whether using the three different scales of BF instead of the single P scale of PEN augments the internal validity of the scales.
Last, we would like to point out that there is plenty of opportunity to augment the scope of this kind of study and include many other variables, such as cognitive abilities, motivation, emotional intelligence and cognitive styles, all of which may add prediction power to job productivity and preferences [26].
References
[1] Silvia T. Acuña and Natalia Juristo. Assigning people to roles in software projects. Software: Practice and Experience, 34(7): 675–696, 2004.
[2] Silvia T. Acuña, Natalia Juristo, and Ana M. Moreno. Emphasizing human capabilities in software development. IEEE software, 23(2):94–101, 2006.
[3] Faheem Ahmed, Luiz Fernando Capretz, and Piers Campbell. Evaluating the demand for soft skills in software development. IT Professional, 14(1):44–49, 2012.
[4] American Psychological Association (APA). Personality. http://www.apa.org/topics/personality/, 2017. [Online; last accessed 16 Oct 2017].
[5] M. D. Avia, J. Sanz, M. L. Sánchez-Bernardos, M. R. Martínez-Arias, F Silva, and JL Graña. The five-factor modelii. relations of the neo-pi with other personality variables. Personality and Individual Differences, 19(1):81–97, 1995.
[6] VenuGopal Balijepally, RadhaKanta Mahapatra, and Sridhar P. Nerur. Assessing personality profiles of software developers in agile development teams. Communications of the Association for Information Systems, 18(1):4, 2006.
[7] Murray R. Barrick. Yes, personality matters: Moving on to more important matters. Human performance, 18(4):359–372, 2005.
[8] Victor R. Basili and David M.Weiss. A methodology for collecting valid software engineering data. IEEE Transactions on software engineering, (6):728–738, 1984.
[9] Allan G. Bluman. Elementary statistics: A step by step approach. McGraw-Hill, 2012.
[10] Melvin Blumberg and Charles D. Pringle. The missing opportunity in organizational research: Some implications for a theory of work performance. Academy of management Review, 7(4):560–569, 1982.
[11] Luiz Fernando Capretz. Personality types in software engineering. International Journal of Human-Computer Studies, 58(2): 207–214, 2003.
[12] Luiz Fernando Capretz. Bringing the human factor to software engineering. IEEE software, 31(2):104–104, 2014.
[13] Luiz Fernando Capretz and Faheem Ahmed. Making sense of software development and personality types. IT professional, 12(1), 2010.
[14] Luiz Fernando Capretz, Daniel Varona, and Arif Raza. Influence of personality types in software tasks choices. Computers in Human Behavior, 52:373–378, 2015.
[15] Casey G. Cegielski and Dianne J. Hall. What makes a good programmer? Communications of the ACM, 49(10):73–75, 2006.
[16] Joseph Chao and Gulgunes Atli. Critical personality traits in successful pair programming. In Agile Conference, 2006, pages 5–pp. IEEE, 2006.
[17] Thomas D. Cook, Donald Thomas Campbell, and Arles Day. Quasi-experimentation: Design & analysis issues for field settings, volume 351. Houghton Mifflin Boston, 1979.
[18] Paul T. Costa and Robert R. McCrae. Neo pi-r professional manual. Odessa, FL: Psychological assessment resources, 396:653–65, 1992.
[19] Paul T. Costa and Robert R. McCrae. The revised neo personality inventory (neo-pi-r). The SAGE handbook of personality theory and assessment, 2(2):179–198, 2008.
[20] Shirley Cruz, Fabio QB da Silva, and Luiz Fernando Capretz. Forty years of research on personality in software engineering: A mapping study. Computers in Human Behavior, 46:94–113, 2015.
[21] Bill Curtis, Herb Krasner, and Neil Iscoe. A field study of the software design process for large systems. Communications of the ACM, 31(11):1268–1287, 1988.
[22] MODELWARE D5.3.1. Industrial roi, assessment, and feedback-master document.revision 2.2, 2006.
[23] D. Roy Davies, Gerald Matthews, Rob B. Stammers, and Steve J. Westerman. Human performance: Cognition, stress and individual differences. Psychology Press, 2013.
[24] Fred D. Davis. Perceived usefulness, perceived ease of use, and user acceptance of information technology. MIS quarterly, pages 319–340, 1989.
[25] Sarv Devaraj, Robert F. Easley, and J. Michael Crant. Research note: how does personality matter? relating the five-factor model to technology acceptance and use. Information Systems Research, 19(1):93–105, 2008.
[26] Annamaria Di Fabio. Beyond fluid intelligence and personality traits in social support: the role of ability based emotional intelligence. Frontiers in psychology, 6, 2015.
[27] Oscar Díaz and Felipe M. Villoria. Generating blogs out of product catalogues: An mde approach. Journal of Systems and Software, 83(10):1970–1982, 2010.
[28] Mauricio Diéguez, Samuel Sepúlveda, and Cristina Cachero. Umam-q: An instrument to assess the intention to use software development methodologies. In Information Systems and Technologies (CISTI), 7th Iberian Conference on, pages 1–6. IEEE, 2012.
[29] M. Brent Donnellan, Frederick L. Oswald, Brendan M. Baird, and Richard E. Lucas. The mini-ipip scales: tiny-yet-effective measures of the big five factors of personality. Psychological assessment, 18(2):192, 2006.
[30] Tore Dyba, Nils Brede Moe, and Edda M Mikkelsen. An empirical investigation on factors affecting software developer acceptance and utilization of electronic process guides. In Software Metrics, 2004. Proceedings. 10th International Symposium on, pages 220–231. IEEE, 2004.
[31] Christof Ebert and Reiner Dumke. Software Measurement: Establish-Extract-Evaluate-Execute. Springer Science & Business Media, 2007.
[32] Hans J. Eysenck. The big five or giant three: Criteria for a paradigm. 1994.
[33] Hans Jurgen Eysenck, Sybil Bianca Giuletta Eysenck, Generós Ortet i Fabregat, Rosa Maria Roglà i Recatalà, and Manuel Ignacio Ibáñez Ribes. EPQ-R: cuestionario revisado de personalidad de Eysenck: versiones completa (EPQ-R) y abreviada (EPQ-RS): manual. Tea, 2008.
[34] Robert Feldt, Lefteris Angelis, Richard Torkar, and Maria Samuelsson. Links between the personalities, views and attitudes of software engineers. Information and Software Technology, 52(6):611–624, 2010.
[35] H. Fujita and I. Zualkernan. Evaluating software development methodologies based on their practices and promises. New Trends in Software Methodologies, Tools and Techniques: Proceedings of the Seventh Somet 08, 182:14, 2008.
[36] Michael J. Gallivan. Examining it professionals’ adaptation to technological change: the influence of gender and personal attributes. ACM SIGMIS Database: the DATABASE for Advances in Information Systems, 35(3):28–49, 2004.
[37] Taghi Javdani Gandomani, Hazura Zulzalil, AAAbdul Ghani, Abu Bakar Md Sultan, and Khaironi Yatim Sharif. How human aspects impress agile software development transition and adoption. International Journal of Software Engineering and its Applications, 8(1):129–148, 2014.
[38] Lewis R. Goldberg, John A. Johnson, Herbert W. Eber, Robert Hogan, Michael C. Ashton, C. Robert Cloninger, and Harrison G. Gough. The international personality item pool and the future of public-domain personality measures. Journal of Research in personality, 40(1):84–96, 2006.
[39] Jaime Gómez, Cristina Cachero, and Oscar Pastor. Conceptual modeling of device-independent web applications. Ieee multimedia, 8(2):26–39, 2001.
[40] Denise Gramß and Birgit Vogel-Heuser. Contribution of personal factors for a better understanding of the gender effects of freshmen in mechanical engineering. In Industrial Technology (ICIT), 2015 IEEE International Conference on, pages 3258–3263. IEEE, 2015.
[41] Thomas R. G. Green, Marian Petre, and R. K. E. Bellamy. Comprehensibility of visual and textual programs: A test of superlativism against the match-mismatch conjecture. ESP, 91(743):121–146, 1991.
[42] Jayati Gulati, Priya Bhardwaj, and Bharti Suri. Comparative study of personality models in software engineering. In Proceedings of the Third International Symposium on Women in Computing and Informatics, pages 209–216. ACM, 2015.
[43] H. Gustavsson, B. Lings, B. Lundell, A. Mattsson and M. Beekveld. Integrating proprietary and open-source tool chains through horizontal interchange of XMI models. In IEEE International Conference in Software Maintenance, pages 521–522, 2007.
[44] Jo E. Hannay, Dag I. K. Sjoberg, and Tore Dyba. A systematic review of theory use in software engineering experiments. IEEE Transactions on Software Engineering, 33(2):87–107, 2007.
[45] Bill C. Hardgrave, Fred D. Davis, and Cynthia K. Riemenschneider. Investigating determinants of software developers’ intentions to follow methodologies. Journal of Management Information Systems, 20(1):123–151, 2003.
[46] W. Heijstek and M. R. V. Chaudron. Empirical investigations of model size, complexity and effort in a large scale, distributed model driven development process. In Software Engineering and Advanced Applications, 2009. SEAA’09. 35th Euromicro Conference on, pages 113–120. IEEE, 2009.
[47] Joe Hoffert, Douglas C. Schmidt, and Aniruddha Gokhale. Quantitative productivity analysis of a domain-specific modeling language. In Handbook of Research on Innovations in Systems and Software Engineering, pages 313–344. IGI Global, 2015.
[48] Romana Vajde Horvat, Ivan Rozman, and József Györkös. Managing the complexity of spi in small companies. Software Process: Improvement and Practice, 5(1):45–54, 2000.
[49] John Hutchinson, Jon Whittle, Mark Rouncefield, and Steinar Kristoffersen. Empirical assessment of mde in industry. In Proceedings of the 33rd international conference on software engineering, pages 471–480. ACM, 2011.
[50] ISO. Iso 9000: Quality management systems–fundamentals and vocabulary, 2055.
[51] Perla I. Jarillo-Nieto, Carlos Enríquez-Ramírez, and Roberto A. Sánchez-Herrera. Identificación del factor humano en el seguimiento de procesos de software en un medio ambiente universitario. Computación y Sistemas, 19(3):577–588, 2015.
[52] Jingdong Jia, Pengnan Zhang, and Rong Zhang. A comparative study of three personality assessment models in software engineering field. In Software Engineering and Service Science (ICSESS), 2015 6th IEEE International Conference on, pages 7–10. IEEE, 2015.
[53] Oliver P. John, Laura P. Naumann, and Christopher J. Soto. Paradigm shift to the integrative big five trait taxonomy. Handbook of personality: Theory and research, 3:114–158, 2008.
[54] Timothy A. Judge, Chad A. Higgins, Carl J. Thoresen, and Murray R. Barrick. The big five personality traits, general mental ability, and career success across the life span. Personnel psychology, 52(3):621–652, 1999.
[55] Carl Gustav Jung. Psychological types. Routledge, 2014.
[56] Dona M. Kagan and John M. Douthat. Personality and learning fortran. International journal of man-machine studies, 22(4): 395–402, 1985.
[57] Makrina Viola Kosti, Robert Feldt, and Lefteris Angelis. Personality, emotional intelligence and work preferences in software engineering: An empirical study. Information and Software Technology, 56(8):973–990, 2014.
[58] Christian F. J. Lange and Michel R. V. Chaudron. Interactive views to improve the comprehension of uml models-an experimental validation. In Program Comprehension, 2007. ICPC’07. 15th IEEE International Conference on, pages 221–230. IEEE, 2007.
[59] Marino Linaje, Juan Carlos Preciado, Roberto Rodriguez-Echeverria, José María Conejero, and Fernando Sanchez-Figueroa. An smiltimesheets based temporal behavior model for the visual development of web user interfaces. Journal of Web Engineering, 16(7&8):371–394, 2017.
[60] E. D. López, M. González, M. López, and E.L. Iduñate. Proceso de Desarrollo de Software Mediante Herramientas MDA. Revista Iberoamericana de Sistemas, Cibernética e Informática, 3(2): 6–10, 2006.
[61] Anthony MacDonald, Danny Russell, and Brenton Atchison. Model-driven development within a legacy system: an industry experience report. In Software Engineering Conference, 2005. Proceedings. 2005 Australian, pages 14–22. IEEE, 2005.
[62] Yulkeidi Martínez, Cristina Cachero, and Santiago Meliá. Evaluating the impact of a model-driven web engineering approach on the productivity and the satisfaction of software development teams. In International Conference on Web Engineering, pages 223–237. Springer, 2012.
[63] Yulkeidi Martínez, Cristina Cachero, and Santiago Meliá. Mdd vs. traditional software development: A practitioners subjective perspective. Information and Software Technology, 55(2):189–200, 2013.
[64] Yulkeidi Martínez, Cristina Cachero, and Santiago Meliá. Empirical study on the maintainability of web applications: Model-driven engineering vs code-centric. Empirical Software Engineering, 19(6):1887–1920, 2014.
[65] Steve McConnell. Problem programmers. IEEE Software, 15(2):128, 1998.
[66] John A. McDermid and Keith H. Bennett. Software engineering research: a critical appraisal. IEE Proceedings-Software, 146(4):179–186, 1999.
[67] Santiago Meliá, Jose-Javier Martínez, Sergio Mira, Juan Antonio Osuna, and Jaime Gómez. An eclipse plug-in for model-driven development of rich internet applications. In International Conference on Web Engineering, pages 514–517. Springer, 2010.
[68] Claudia Melo, Daniela S Cruzes, Fabio Kon, and Reidar Conradi. Agile team perceptions of productivity factors. In 2011 Agile Conference, pages 57–66. IEEE, 2011.
[69] Parastoo Mohagheghi. An approach for empirical evaluation of model-driven engineering in multiple dimensions. In C2M:EEMDD Workshop at ECMFA, pages 6–17, 2010.
[70] Parastoo Mohagheghi and Vegard Dehlen. Where is the proof?–a review of experiences from applying made in industry. Lecture Notes in Computer Science, 5095(2008):432–443, 2008.
[71] Rory V. O’Connor and Murat Yilmaz. Exploring the belief systems of software development professionals. Cybernetics and Systems, 46 (6-7): 528–542, 2015.
[72] Alan R. Peslak. The impact of personality on information technology team projects. In Proceedings of the 2006 ACM SIGMIS CPR conference on computer personnel research: Forty four years of computer personnel research: achievements, challenges & the future, pages 273–279. ACM, 2006.
[73] Juan Carlos Preciado, Roberto Rodriguez-Echeverria, José María Conejero, Fernando Sanchez-Figueroa, and Alvaro E Prieto. An approach for guesstimating the deployment cost. Journal of Web Engineering, 17(3&4):224–240, 2018.
[74] Naomi L. Quenk. Essentials of Myers-Briggs type indicator assessment, volume 66. John Wiley & Sons, 2009.
[75] Nornadiah Mohd Razali, Yap Bee Wah, et al. Power comparisons of shapiro-wilk, kolmogorovsmirnov, lilliefors and anderson-darling tests. Journal of statistical modeling and analytics, 2(1):21–33, 2011.
[76] Cynthia K. Riemenschneider, Bill C. Hardgrave, and Fred D. Davis. Explaining software developer acceptance of methodologies: a comparison of five theoretical models. IEEE transactions on Software Engineering, (12):1135–1145, 2002.
[77] Aristide Saggino. The big three or the big five? a replication study. Personality and Individual Differences, 28(5):879–886, 2000.
[78] Elmar Sauerwein, Franz Bailom, Kurt Matzler, and Hans H Hinterhuber. The kano model: How to delight your customers. In International Working Seminar on Production Economics, volume 1, pages 313–327, 1996.
[79] Shlomo S. Sawilowsky and R. Clifford Blair. A more realistic look at the robustness and type ii error properties of the t test to departures from population normality. Psychological bulletin, 111(2):352, 1992.
[80] Ron H. J. Scholte and Eric E. J. De Bruyn. Comparison of the giant three and the big five in early adolescents. Personality and Individual Differences, 36(6):1353–1371, 2004.
[81] Adesina S. Sodiya, HOD Longe, S. Adebukola Onashoga, Oludele Awodele, and L. O. Omotosho. An improved assessment of personality traits in software engineering. Interdisciplinary Journal of Information, Knowledge & Management, 2:163–177, 2007.
[82] Mohsen Tavakol and Reg Dennick. Making sense of cronbach’s alpha. International journal of medical education, 2:53, 2011.
[83] CMMI Product Team. Cmmi for development, version 1.2. Technical Report CMU/SEI-2006-TR-008, Software Engineering Institute, Carnegie Mellon University, Pittsburgh, PA, 2006.
[84] Glenda Toala, Mauricio Diéguez, Cristina Cachero, and Santiago Meliá. Evaluating the impact of developers personality on the intention to adopt model-driven web engineering approaches: An observational study. In International Conference on Web Engineering, pages 3–16. Springer, 2018.
[85] Adam Trendowicz and Jürgen Münch. Factors influencing software development productivity state-of-the-art and industrial experiences. Advances in computers, 77:185–241, 2009.
[86] Iris Vessey and Ron Weber. Research on structured programming: An empiricist’s evaluation. IEEE Transactions on Software Engineering, (4):397–407, 1984.
[87] Ståle Walderhaug, Erlend Stav, and Marius Mikalsen. Experiences from model-driven development of homecare services: Uml profiles and domain models. In International Conference on Model Driven Engineering Languages and Systems, pages 199–212. Springer, 2008.
[88] Gerald M. Weinberg. The psychology of computer programming, volume 932633420. Van Nostrand Reinhold New York, 1971.
[89] Kirsten N. Whitley. Visual programming languages and the empirical evidence for and against. Journal of Visual Languages & Computing, 8(1):109–142, 1997.
[90] Jon Whittle, John Hutchinson, and Mark Rouncefield. The state of practice in model-driven engineering. IEEE software, 31(3): 79–85, 2014.
[91] Murat Yilmaz and Rory V. OConnor. Towards the understanding and classification of the personality traits of software development practitioners: Situational context cards approach. In Software engineering and advanced applications (SEAA), 2012 38th EUROMICRO conference on, pages 400–405. IEEE, 2012.
Biographies

Magister Glenda Toala Sánchez is a professor at the Faculty of Economic Sciences of the Central University of Ecuador. She has extensive teaching experience in the areas of Programming and Information Technology and Communications.
Currently, she is studying a doctorate in computer science at the University of Alicante, Alicante, Spain. She has participated in international conferences of great reputation in the field of Software Engineering: International Conference on Web Engineering (ICWE) 2018, Iberian Conference on Information Systems and Technologies (CISTI) 2018 and International Congress of Information, Systems and Sciences of Computation (INCISCOS) 2018. The results of the investigations are included in Springer LNCS proceedings, EI-Compendex, IEEE XPlore, INSPEC, ISI, SCOPUS and Google Scholar.

Cristina Cachero is associate professor at the Department of Languages and Systems of the University ofAlicante. She has extensive teaching experience in the areas of Programming and Software Engineering, and she coordinates two undergraduate subjects related to these areas. Her main lines of research are (a) the empirical evaluation of Model-Driven Engineering notations, methods and techniques, and (b) the impact of human factors on the performance and satisfaction of software developers while using them.
As part of her research work, Dr Cachero has been a visiting researcher at Politecnico de Milano (Italy), Gent Universität (Belgium), Université de Montréal (Canada) and Universidad de la Frontera (Chile).
Her research results have been published in JCR journals – IEEE Multimedia, Journal of Systems and Software (JSS), Journal of Web Engineering (JWE), Empirical Software Engineering (ESE), Information and Software Technology (IST), International Journal on Intelligent Systems (IJIS), etc. – and highly reputed conferences in the Software Engineering field – DEXA, WISE, ER, EC-Web, ICWE, CAISE, MODELS, etc.-.
Dr. Cachero has acted as invited reviewer of several journals, conferences and workshops. Also, she has been invited editor of special issues in the RE, JSS and JWE journals, and she has co-organized several workshops in international conferences such as WTA (SAC 2005), IWWUA (WISE 2008 and WISE 2009) and QWE (ICWE 2010 and ICWE 2011).

Santiago Meliá is associate Profesor at the Department of Languages and Information Systems at the University of Alicante. His research interest includes Model-Driven Development, Web Engineering Methodologies, Automatic Code Generation Techniques and Web Software Architecture, all of them are part of his Ph.D. received at the University of Alicante in 2007. In the last years has focused on the empirical software engineering applied to the area of the model-driven for refuting his promises of improvement in productivity, maintainability and satisfaction in the software development.
He has published in prestigious journals such as (IEEE Internet Computing, Journal of Systems and Software, Information Systems Frontiers, European Journal of Information Systems, Information Software Technology, Journal of Web Engineering, etc.) and conferences (OOPSLA, WISE, ER, EC-Web, ICWE, CADUI, etc.). He regularly serves in the PC of several international conferences (WWW, ICWE, JISBD) and he has co-organized during three years the international workshop MDWE (2011, 2012 and 2013).
Finally, It is important to hightlight that he has coordinated and participated in several industrial research projects in which it has been able to apply the latest techniques of software engineering to develop applications for companies like Ambulancias Ayuda S.L.U, INASE, Patronato de Turismo de la diputación de Alicante, Smartloto S.L, SUMA Gestión Tributaria, etc.
Journal of Web Engineering, Vol. 17_6&7, 483–526.
doi: 10.13052/jwe1540-9589.17674
© 2019 River Publishers
*This work was supported by Spanish Ministry of Economy, Industry and Competitiveness under contract TIN2016-78103-C2-2-R (Access@City). Special thanks to the subjects of the experiment who kindly agreed to participate in our study.
1https://goo.gl/Abz95s
2http://mde.dlsi.ua.es/ooh4ria/labPackages/ExperimentalPackageJWE2018.zip