Performance Analysis of Routing Protocols On IPv4 and IPv6 Addressing Networks
Neha Jain1,*, Ashish Payal1 and Aarti Jain2
1USICT, GGSIPU, New Delhi, India
2AIACTR, NSUT, New Delhi, India
E-mail: nehajain312@gmail.com
*Corresponding Author
Received 22 July 2020; Accepted 19 February 2021; Publication 12 July 2021
Abstract
With IPv4 addresses being exhausted, network engineers and researchers are encouraged to adopt IPv6. But before using the IPv6 network directly, engineers need to test their hardware and network performance under new conditions of IPv6 as it has an extended address, high complexity, overhead performance, and IPsec complications. As routing protocols play a crucial role in network performance, it leads to a network’s extended performance by finding the shortest path, good throughput, and lowest delay. As the specifications, viz. frame structure for IPv4 and IPv6 are entirely different, there are modified routing protocols specified for IPv6. Routing Information Protocol (RIP) and Routing Information Protocol Next Generation (RIPng) are distance vector routing protocols and use hop count as a cost. In this paper, we have used RIPng on the IPv6 addressing network and RIP on the IPv4 addressing network and then analyze and compare them on the basis of different performance parameters. For this comparison, three different applications – File Transfer Protocol (FTP), DB Query (DataBase), and electronic mail (e-mail) – are set on a network consisting of three different subnets, each having a diverse network topology. The performance parameters analyzed are global and object statistics, viz. ethernet delay, number of hops, applications response time, background traffic delay, traffic dropped, point-to-point links throughput, links utilization, and links queuing delay. The experimental results determine the strength of the routing protocols. Thus, the quantitative results give the option to choose the routing protocol according to the network scenarios. In terms of ethernet delay, traffic dropped, network convergence, and security, it is found that the RIPng_IPv6 network performs better than RIP_IPv4. RIPng_IPv6 has an ethernet delay of 2.9 milliseconds, traffic dropped of 0.29 packets/second, and network convergence of 17 seconds less than RIP_IPv4 values. However, the RIP_IPv4 network is scalable, uses less hop, and has 40 milliseconds of traffic delay, while RIPng_IPv6 has 0.40 seconds of traffic delay. RIP_IPv4 also has a better response time for all three applications, FTP as 100 milliseconds, DB as 40 milliseconds, and e-mail as 20 milliseconds which is much less than the values obtained for RIPng_IPv6 network. Therefore, according to the performance requirements, the network engineers/operators or researchers can use either the existing IPv4 network or a new IPv6 network to achieve the Quality of Service (QoS) target level.
Keywords: Internet Protocol (IP), IPv4, IPv6, Routing Protocols, Routing Information Protocol (RIP), Routing Information Protocol Next Generation (RIPng).
1 Introduction
The data users and their devices are growing exponentially in this modern world, so is the data communication between networks. Each device needs a unique Internet protocol (IP) before connecting to the Internet. The IP is the network/Internet layer of Transmission Control Protocol and Internet Protocol (TCP/IP) protocol used to recognize nodes or host addresses to route data on the packet-switched internetwork. Thus, IPv4 had been proposed; IPv4 was developed in the early 1980s and has been in use since then. It gave 4,294,967,296 unique addresses. In 2011, the Asia Pacific Network Information center already informed that it had allotted the last group of IPv4 addresses from the Internet Assigned Numbers Authority. Therefore, it is understood that all the addresses are consumed, and, now, we must move toward IPv6 adoption. As the entire network is already developed on IPv4, therefore, instead of completely migrating from IPv4 to IPv6, it is suggested to use IPv6 within IPv4. Thus, the users can significantly use IPv6 with existing IPv4, reducing the cost and other adoption hurdles. In 1998, IPv6 was considered as a draft standard to resolve the issues faced in IPv4. It is also found that IPv6 gives up to 340 undecillion (3.4 10) addresses, which are huge in number than IPv4. The transition from IPv4 to IPv6 is already started, and different transition techniques are used, which dynamically tunnel IPv6 packets to IPv4 networks [1]. Currently, the adoption of IPv6 is slow due to many inflexibilities faced during the transition from IPv4 to IPv6 [2].
Various additional features of IPv6 with regard to IPv4 are given below [3]:
(1) Layer address space: more address space.
(2) Better header format: Options are separated from Base Header.
(3) New options: Additional functionalities.
(4) IPv6 uses network address translation.
(5) More security supported: Options for authentication and encryption.
(6) Support for resources allocation: Two extra fields as compared to IPv4 for special handling of the packet. They are the flow label and traffic class.
(7) Allow extension: Extension of the protocol.
As already discussed above, IPv6 has various additional features than IPv4 but also has some issues like high complexity, performance overhead, IPsec complications, and IPv4 to IPv6 compatibility. The main comparison between IPv4 and IPv6 is shown in Table 1.
Table 1 Comparison between IPv4 and IPv6
| IP Version | IPv4 | IPv6 |
| Size of address | 32 Bit, 4 sets of 8 Bits | 128 Bit, 8 sets of 16 Bits |
| Number of addresses | 4.3 Billion Addresses | 340 undecillion addresses |
| Address notation | Dot decimal e.g., 192.168.0.1 | Colon hexadecimal e.g., 2463:758A:47CB:0111 |
| Security | Optional IPsec | Compulsory IPsec |
| Header length | Variable length header (20-40 bytes) | Fixed length header (40 bytes) |
| Addressing | Broadcast addressing | Multicast addressing |
As per the study, it is also found that in the IPv6 network, different geographic areas have variations in performances of IPv6. This effect also affects the simulation results in this paper [4, 5].
The Internet plays an essential role in communication networks by utilizing routing protocols to transmit data packets across different networks [6]. Routing is responsible for route selection, identification, and delivery of packets, and two different routing methods are static and dynamic. In contrast, two classes of routing are called distance-vector and link-state routing [7, 8]. In static routing, the administrator can manually format the information, whereas, in dynamic routing, a router can learn from other sources [9]. A routers routing table can contain static or dynamic routes or both routes, and administrators make decisions for route selection. There are a number of routing protocols classified on this principle, and each routing protocol has a different routing algorithm. These routing protocols have different specifications for the IPv4 and IPv6 networks, and their classification is shown in Figure 1 [9, 10].
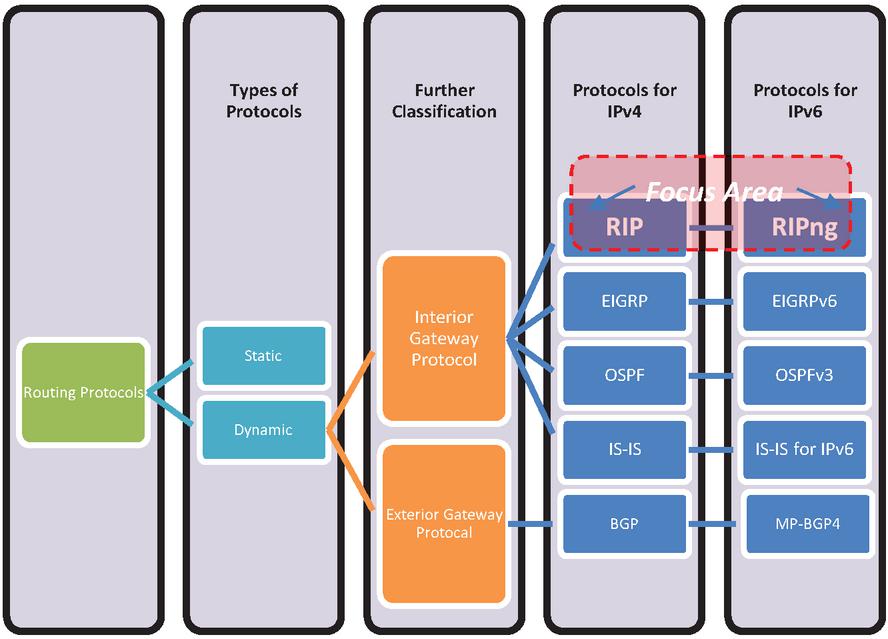
Figure 1 Routing protocols.
An IPv4 routing protocol may use in IPv6, but IPv6 routing protocols cannot be used in IPv4 as they are the enhanced versions of IPv4 protocols with changed long header structure. Due to its more extended design, more information is carried by routing updates.
Routing information protocol (RIP) is a dynamic routing interior gateway protocol that uses a distance vector routing algorithm for the selection of the shortest path to reach from source to destination. It has three versions RIPv1, RIPv2, and routing information protocol next generation (RIPng). In this paper, RIPv2 and RIPng are used on IPv4 and IPv6 addressing networks, respectively. The reason for using these protocols is that many existing networks are still using them and will use them in future networks, as they are easy to configure for real-time networks with respect to other routing protocols. They prevent a loop in the network due to limited hop count. Also, RIP supports IPv6 as RIPng. The RIPv2 is used as RIP, and RIPng is an extension of RIPv2. They are the primary routing protocols that are used to route traffic in smaller or average networks with a maximum hop count of 15. The value of 16 is stated as infinite distance. They use hop count as their metric, and the routing table is maintained to find the optimal path between source to destination delivery. Some main differences between RIP and RIPng are shown in Table 2 [11–14].
Table 2 Difference between RIP and RIPng
| Specifications | RIP | RIPng |
| IP support | IPv4 | IPv6 |
| Transport port | UDP port-520 | UDP port-521 |
| Authentication | RIP specific | IPv6 (IPsec) |
| Multicast address | 224.0.0.9 | FF02::9 |
Many administrators are changing their networks to encourage better Internet applications, requiring a proper network evaluation. The network evaluation permits us to assess new-fangled ideas, detect problems and bottlenecks, and optimize already available systems. Various simulation software is used to get good reference value for network evaluation that helps us to obtain better-optimized networks. In real-time scenarios, the most economical approach is to develop a project of an existing network and then run it on a Riverbed network modeler to find whether the current network is suitable enough to provide the new Internet amenities. Thus, these network modelers are essential for finding and studying the network’s performance and problems. Also, the selection of optimal routing protocols is a critical task, and it helps to decide the performance of a network based on various requirements and different evaluation parameters.
From the study [10, 11], and [16–23] (which is also detailed in the related work section below), it is found that the parameters end-to-end delay, applications response time, convergence time, packet delay, jitter, traffic dropped, traffic sent, and traffic received play a vital role. However, for the applications file transfer protocol (FTP), DB Query (DataBase), and electronic mail (e-mail), there is no evaluation done for the parameters ethernet delay, the number of hops, background traffic delay, point-to-point links throughput, links utilization, and links queuing delay. Therefore, these parameters are evaluated in the paper. These parameters are important as the applications used in the paper are widely used in real-time networks. Therefore, the total parameters evaluated in this paper are ethernet delay, response time, the number of hops, applications response time, background traffic delay, traffic dropped, convergence duration, traffic sent and received, point-to-point links throughput, links utilization, links queuing delay, security, and scalability of the network. This work is helpful for the network engineers/operators and researchers that are willing to use or find out the best among RIP and RIPng routing protocols on respective IP addressing network. This paper can help to know in advance the routing protocol’s performance for real-time networks.
The objectives of the paper are as follows:
• The proposed work defines IPv4 and IPv6 addressing networks.
• Proposed work implements and studies the impact of two routing protocol’s RIP on IPv4 addressing network and RIPng on IPv6 addressing network, respectively.
• Analyze, identify, and compare IPv4 with RIP and IPv6 with RIPng in terms of ethernet delay, the number of hops, application response time, background traffic delay, traffic dropped, point-to-point throughput, link utilization, and queuing delay, and find the best.
In this paper, the RIP with IPv4 addressing network is also named as RIP_IPv4 network, and RIPng with IPv6 addressing network is named as RIPng_IPv6 network.
The proposed work methodology flowchart is shown in Figure 2. The graphical representation describes the different steps required to accomplish the work done. All eight steps are shown in the figure. The first and second steps are to identify and design the network according to the requirements and network specifications. The network’s requirements and specifications are discussed in the third section of the paper. As the network is simulated for IPv4 and IPv6, in step 3, the network is configured for two different addresses. The fourth step is to configure the network for IPv4 and IPv6 routing protocols. As the network performance is evaluated based on different applications, the next step is defining these applications for the network using application and profile configuration modules available in the software. In the next step, the defined applications are also configured on the network’s workstations for transmission of data from respective source to destination. The paper’s main aim is to evaluate the performance of the network; thus, in the next step, all the global and object parameters considered in this paper are to be defined for the network. The parameters considered are shown in the figure and also discussed later in Section 4 of this paper. Finally, the network is simulated for the required simulation time, and the results are evaluated and compared for the analysis, and the comparison is made.
After the introduction in Section 1, Section 2 discusses the related work, and Section 3 describes the simulation methodology, Section 4 discusses simulation analysis and results for global and object statistics, followed by Section 5, which concludes and gives the future scope of work.
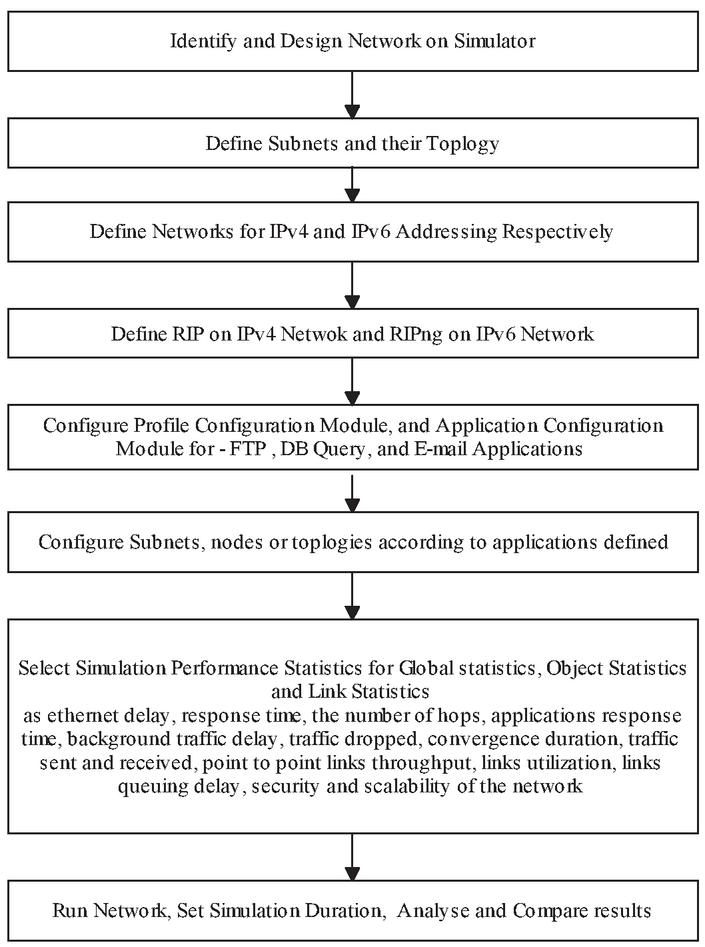
Figure 2 Proposed work methodology flowchart.
Table 3 Network performance comparison for different routing protocols
| Routing Protocols Used | Year | Authors | Applications Used | Network Topology | Results Obtained for Different Network Parameters |
| RIP, OSPF, and EIGRP [16] | 2013 | I. Fiþigãu et al. | Video, HTTP, and voice applications | The network consisted of four subnets that connected using DS3 links. Subnet 1 has three LANs, routers, and a switch, while in subnet 2, LANs were replaced by servers. Links. Each LAN and server supported different applications. Subnets 3 and 4 consisted of four routers to route packets. Profile configuration and application configuration modules | RIP had the highest delay and performed better for the HTTP page response time application. EIGRP had better network convergence, and OSPF performed better for video applications |
| RIP, OSPF, and EIGRP [17] | 2015 | A. Iqbal and S. L. A. Khan | Voice, video, and HTTP | The network consisted of five routers, six nodes, and two servers, and links. Profile configurations and application configuration modules. | Open Shortest Path First (OSPF) had the best performance for link utilization. The RIP had better convergence time and, thus, gave a better performance for end-to-end delay and packet delay for video traffic. But RIP lost many packets. Enhanced Interior Gateway Routing Protocol (EIGRP) had better traffic jitter and end-to-end delay for voice traffic and performed best for video traffic. However, EIGRP only had the worst value for HTTP page response time. Thus, EIGRP was mostly stable, RIP performance degraded as the size of the network increases, and OSPF performed better for more flapping unstable links |
| RIPv2, RIPng, OSPFv2, and OSPFv3 using G.711 CODEC [18] | 2016 | M. Syed and I. Y. Ambore | Voice quality for Voice Over Internet Protocol (VOIP) | The network consisted of four routers, two ethernet switches, two IP phones, and DS3 links, profile configuration, application configuration, and failure recovery module | OSPFv3 had better packet delay variation than OSPFv2. RIPng performed exceptionally well as it had less traffic dropped, jitter, and the end-to-end delay |
| RIP, EIGRP, and OSPF [19] | 2016 | S. Shewaye Sirika | Video conferencing | The network consisted of 11 routers, 2 switches, 10 nodes, and links. Profile configuration and application configuration | EIGRP gave faster convergence than OSPF and RIPv2. The packet delay variation was better for OSPF than EIGRP and RIPV2. RIPv2 was preferred for smaller networks |
| RIPng, EIGRPv6, and OSPFv3 [20] | 2018 | S. S. Samaan | Voice, video, HTTP, and DataBase (DB) | The network consisted of nine ethernet IP router, seven ethernet switches, seven 100BaseT switched LAN, four ethernet server, PPP DS3 duplex link, ethernet 100BaseT duplex link, profile configuration, application configuration, and failure recovery | EIGRPv6 outshined in all parameters (HTTP page response time, Traffic dropped, network convergence duration, packet delay variation, jitter, end-to-end delay) results except DB query response time where OSPFv3 performed better |
| RIPng, OSPFv3, and EIGRP [21] | 2019 | M. M. H. Sabbir et al. | Video streaming and VOIP | The network consisted of ethernet server, switch, CS_7200 Cisco Router, ethernet workstation, and different duplex links (PPP_DS3 duplex link, 1000 BaseX duplex link), profile configuration, application configuration, QoS attribute configuration, and failure recovery | RIPng performed best among all routing protocols for both the applications in terms of traffic sent, traffic received, and packet delay variation |
| RIP, EIGRP, OSPF, OSPFv3, and RIPng [22] | 2019 | I. Nedyalkov et al. | VOIP, video conferencing, DataBase, and Internet browsing | The network consisted of several branches in different cities, and each branch consisted of five workstations, a switch, a router, and links. Profile configuration, application configuration, and failure and recovery module | For convergence time, OSPFv3 performed better than other routing protocols for IPv6, while EIGRP performed better for IPv6. For applications VOIP and IP telephony, OSPFv3 gave faster convergence time than other routing protocols, while EIGRP performed better for the IPv4 network. For application video conferencing, EIGRP gave better advantages for IPv4 and OSPFv3 for IPv6. For DB, in case of IPv4, use EIGRP or RIP, while for IPv6, use OSPFv3 and RIPng |
| RIP, RIPng, EIGRP, OSPF, and OSPFv3 [23] | 2019 | I. Nedyalkov | Database, file transfer, and e-mail | The network consisted of seven branches in European cities, and one branch consisted of three servers – a database server, a file server, a mail server, and links. Profile configuration, application configuration, and failure and recovery module | For IPv4, it was found that RIP had the smallest delay, and EIGRP converged faster. While for IPv6, OSPFv3 converged faster than RIPng. |
| IS-ISv6 [11] | 2020 | Neha Jain and Ashish Payal | Voice and video conferencing | The network consisted of ten workstations, two switches, eight routers, and connecting links. Ping, profile, and application configuration | IS-ISv6 routing protocol enhanced the performance of real-time applications on the IPv6 network with better throughput, less jitter, and delay. It was also observed that if the simulation time increased further, there was no change in the stability of network performance. IS-ISv6 was the preferred routing protocol that can enhance the routing of real-time applications for the IPv6 network. |
2 Related Work
Various related papers have been studied using a riverbed modeler/OPNET/Packet Tracer. The detailed study of their analysis is shown in Table 3 regarding different routing protocols used in the network and applications considered, their network topology, and results obtained for different performance parameters from the network simulation. In 2012, Clore et al. evaluated the IPv6 performance with a loop module using the OPNET modeler. The applications tested were ICMPv6 ping messages, TCP, and HTTP messages, and a network consists of a set of routers connected with two physical nodes. The physical nodes were virtual machines that were hosted on the same machine that runs OPNET Modeler. The virtual machine’s network interfaces were bridged with two separate network interface cards that were installed on the host machine. However, the results showed that this module was not fully supported by the network while handling the packets. The simulated network consisted of two routers, two workstations, and two-loop stations [24].
Different authors simulated their network for different applications, and these were voice and video conferencing, video streaming, VOIP, FTP, HTTP, e-mail, and DB Query applications. It is observed that authors evaluated their network performance parameters as end-to-end delay, applications response time, convergence time, packet delay, jitter, traffic dropped, traffic sent, and traffic received. Therefore, these parameters play an important role in the analysis of the network. So in this paper, we have made the analysis based on these parameters also.
3 Simulation Methodology
Simulations are the right approach for studying the performances and discover the causes of the problem in a network. One of the fastest simulation software is Riverbed Modeler (earlier known as OPNET modeler), which models, designs, and analyzes communication networks. Its 17.5 academic edition is used in this paper [25]. This modeler is used to analyze numerous performance parameters for both wired and wireless networks [25, 26]. Its acceptance in the performance network modeling community and its continuous data of precise impression in actual life communication protocols and hardware modules makes Riverbed Modeler a comprehensive development environment tool [24, 25]. The Riverbed Modeler allows us for easy operation and provides detailed and real-time results.
The proposed network topology is inspected and studied to develop the simulation’s network model [24, 27]. The network simulations do not select statistics itself [9], and for each scene, the statistics are chosen manually for the simulation.
In this section, we will discuss the network topology and configuration modules used for the network simulation.
3.1 Network Topology
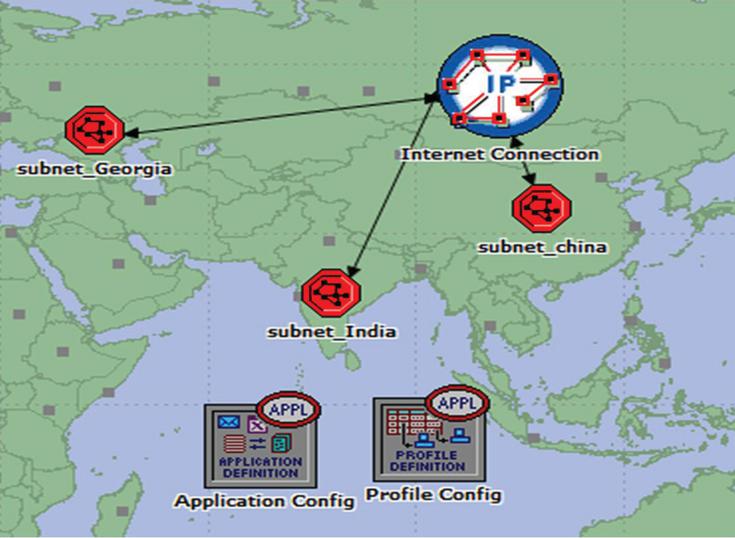
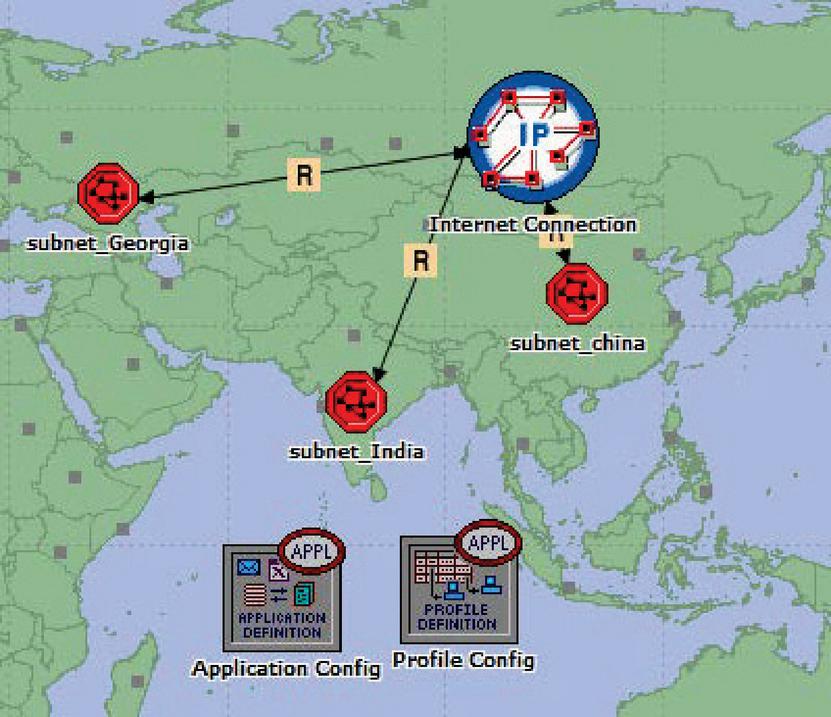
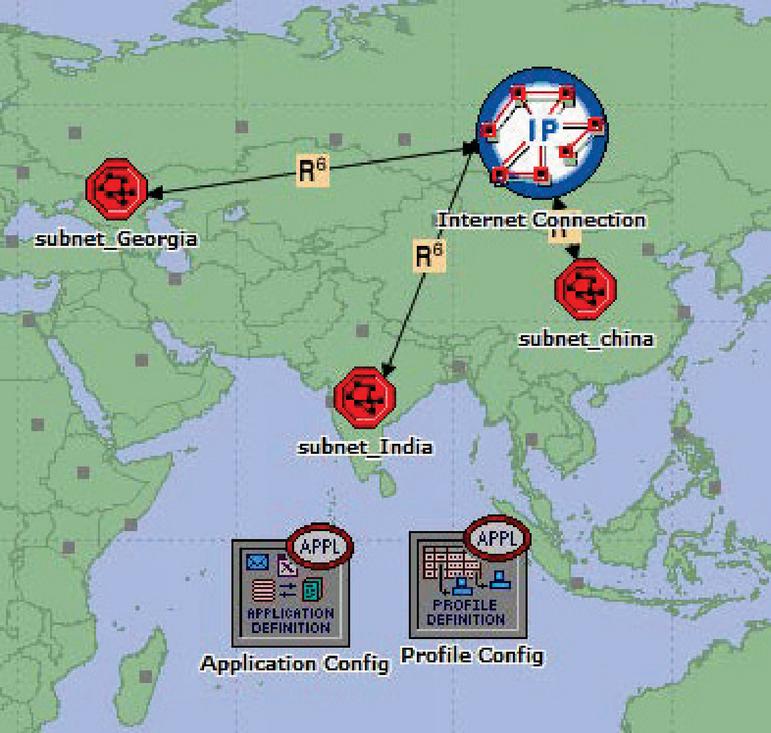
The proposed network’s topology consists of three subnets located for three different areas as subnet_China, subnet_Georgia, and subnet_India. There are various reasons for considering these areas. China is the world’s most populous country, and with 904 million Internet users, it has unarguably got the highest number of Internet users globally. China has 63.3% Internet penetration [29], which is midway between developed countries (US – 96.3% and Japan – 90.9%) and developing countries (Somalia 2% and Afghanistan 11.5%). On the other end of the spectrum is Georgia. Georgia has a very similar Internet penetration as China’s (60.5%) and yet a much lower population (2.4 million). This presents an exciting mix of Internet demographics and two spectrums of Internet evolution to study. On the other hand, India has an Internet penetration of 54.4% but a much more complex demographic landscape with varying Internet infrastructure capabilities and consumption patterns in rural and urban regions [30].
3(a) Main network.
3(b) Subnet_Georgia network.
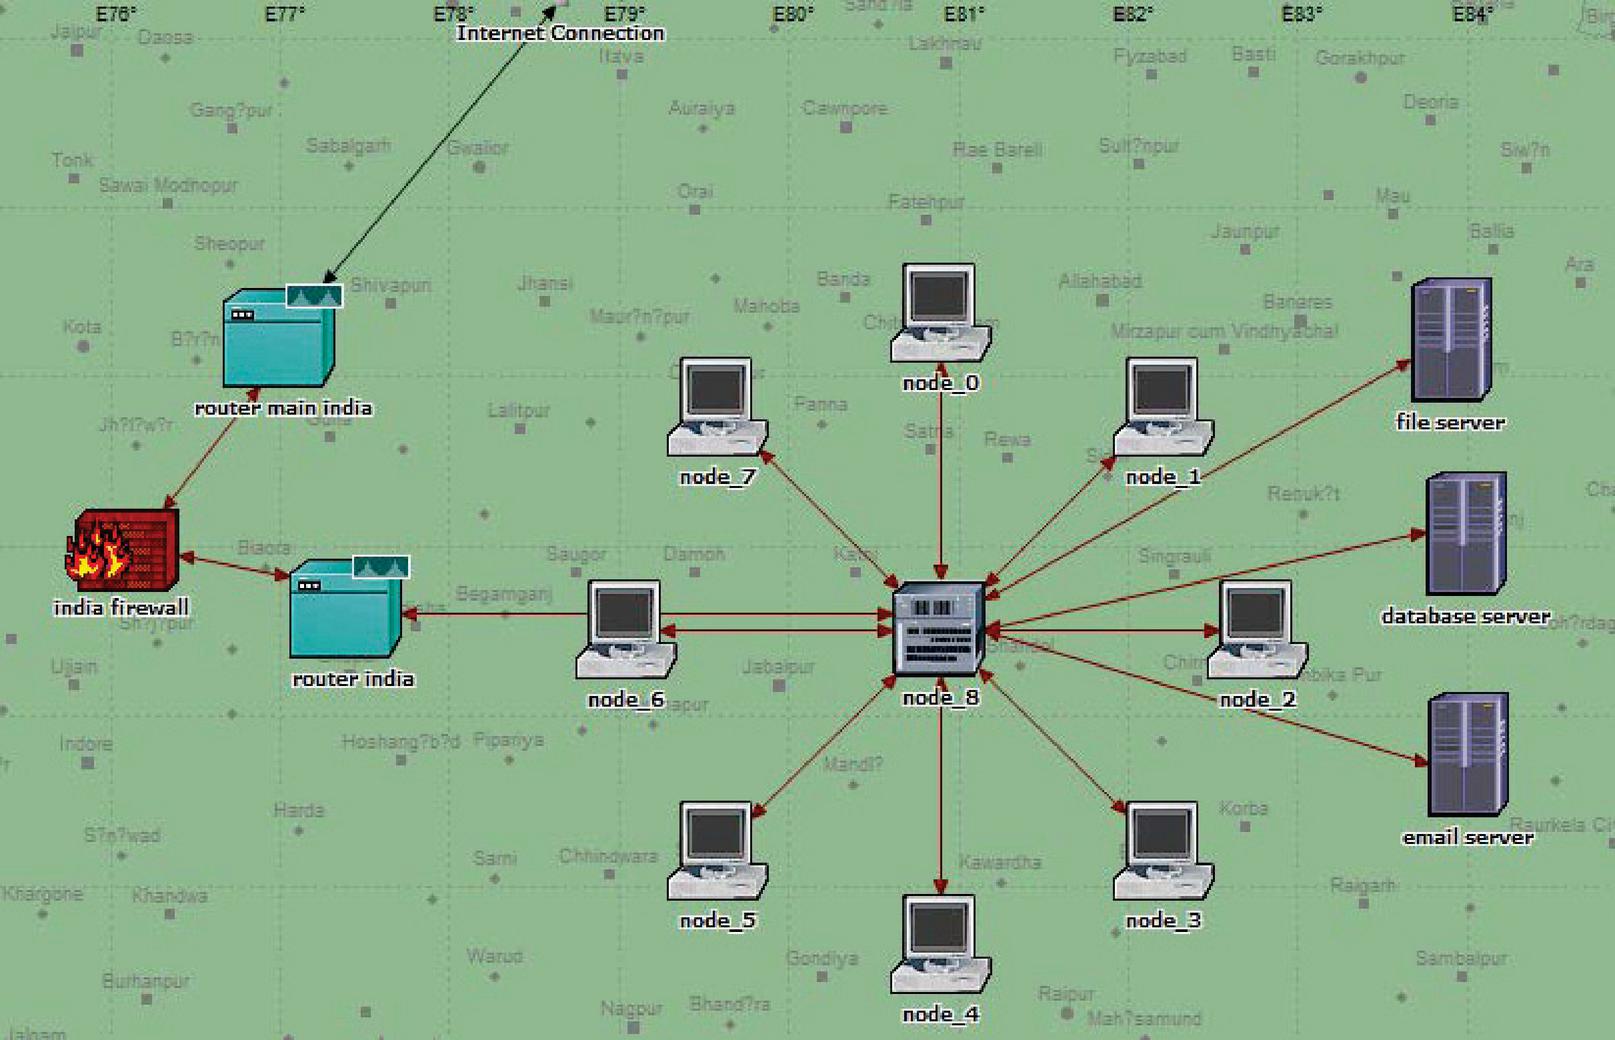
3(c) Subnet_India network.

3(d) Subnet_China network.
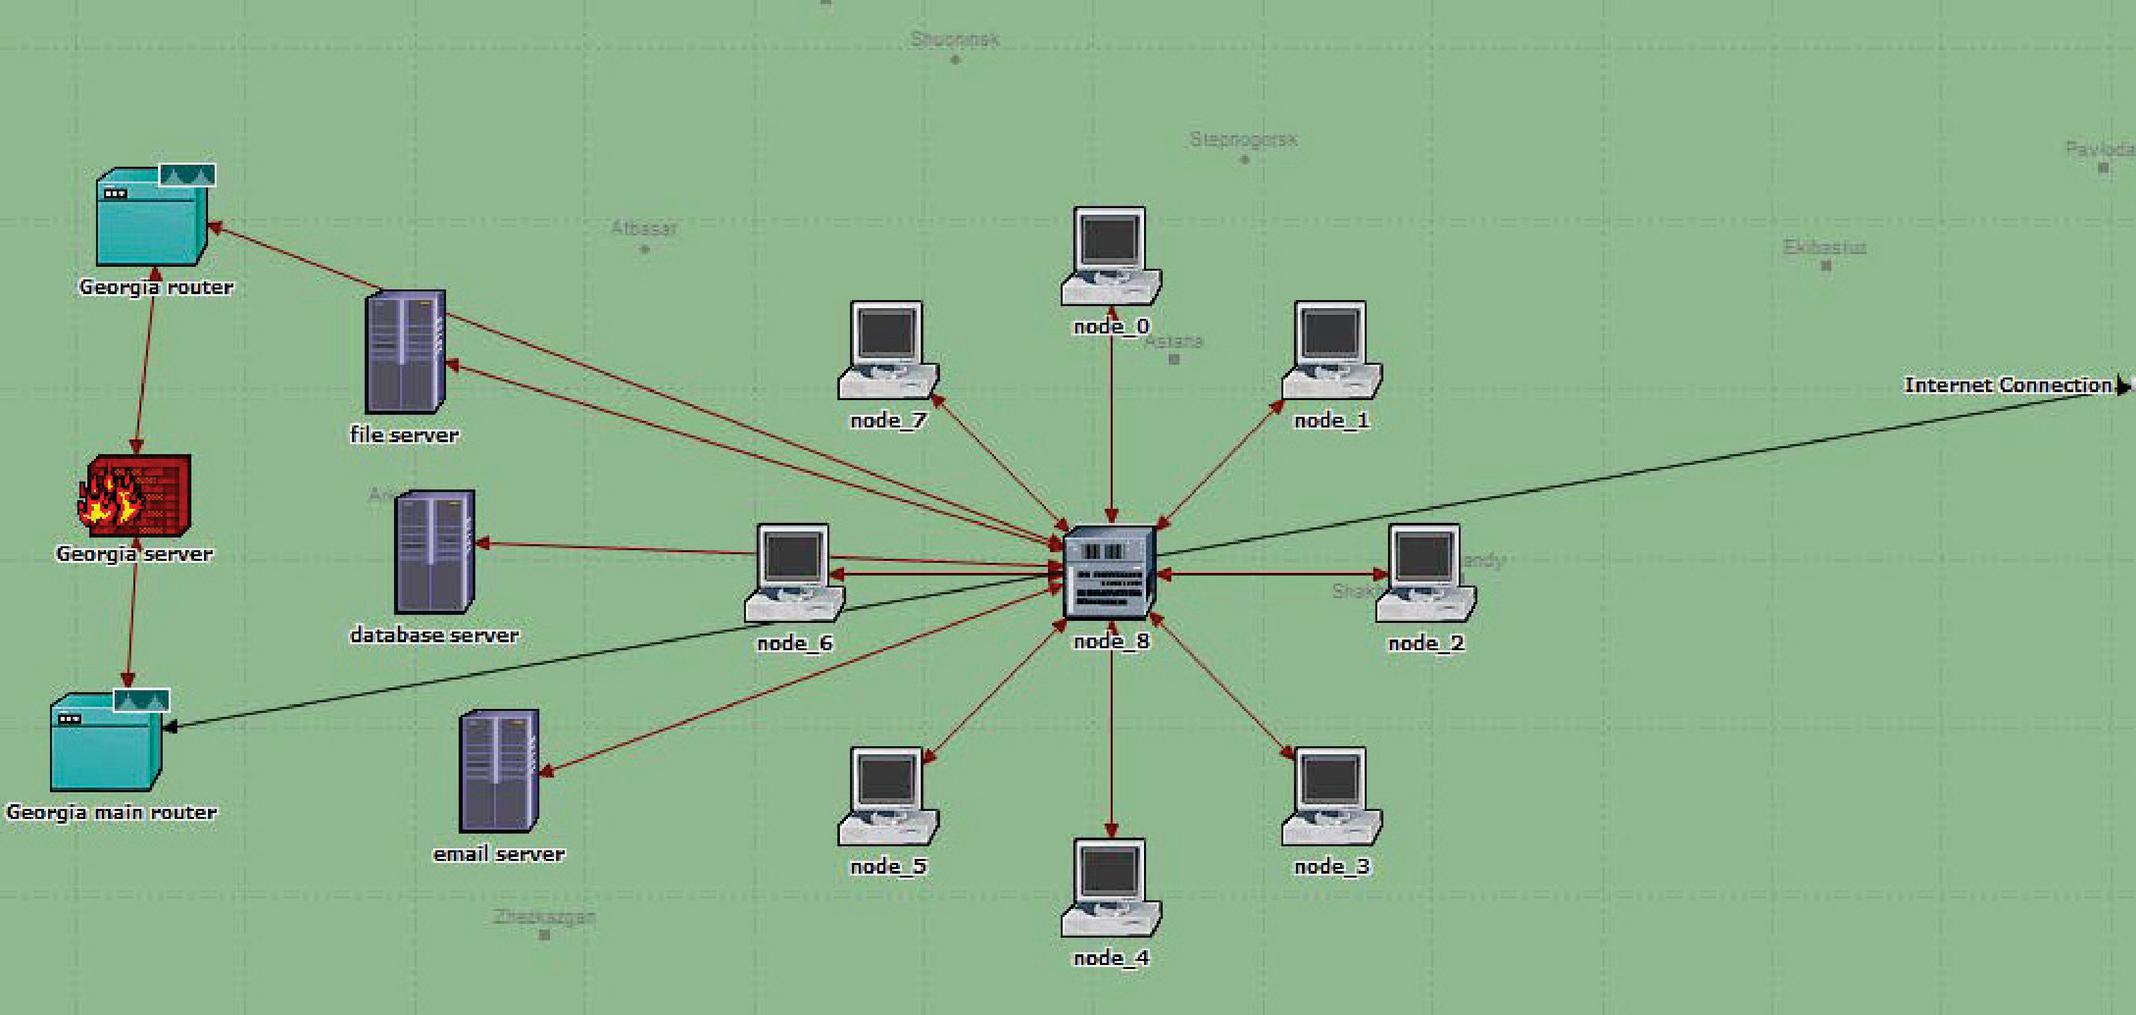
Figure 3 Main network with their subnets.
Table 4 Characteristics description table of node, firewall, router, and server
| Node | Firewall | Router | Server | |
| Main functions | Workstation | Gateway, firewall, multihomed-server | Routing of data | Server |
| Protocols supported | Ethernet, Fast Ethernet, Gigabit Ethernet, UDP, RIP, OSPF, TCP, and IP | Ethernet, RIP, OSPF, BGP, IGRP, IP, UDP, and TCP | IEEE 802.3, IEEE 802.5, UDP, IP, ATM, ANSI T1.618, RIP, and OSPF | Ethernet, Fast Ethernet, Gigabit Ethernet, RIP, OSPF, TCP, IP, and UDP |
| Interface description (Port) | One ethernet connection at 10, 100, or 1000 Mbps | Ethernet connections at 10, 100, or 1000 Mbps. Eight serial line IP connections at pickable data rates | Six ethernet hub connections at 10 Mbps. Four IP serial connections at pickable data rates Four frame relay serial connections at pickable data rates Four token ring connections at 4 or 16 Mbps One ATM connection Fast Ethernet hub connections at 100 Mbps | One ethernet connection at 10, 100, or 1000 Mbps |
Figure 3(a)–(d) shows the proposed main network and the respective subnet’s internal topology. In the network, all three subnets are connected to the Internet via IP32 Cloud. The data communication takes place from the node selected to communicate for the defined application to the application server in its area or different area and vice versa. The node’s applications are defined through the application configuration module, and their profiles are defined through the profile configuration module, which is discussed in detail below. Table 4 gives general functions supported by protocols and port interface descriptions of objects or devices used in the network. In the given table, the node used as the workstation supports different protocols like Ethernet, Fast Ethernet, Gigabit Ethernet, UDP, RIP, OSPF, TCP, and IP, and this node supportx Ethernet connection at 10, 100, or 1000 Mbps and similarly for others objects like firewall, servers, and routers.
The three subnets require different objects and links for their topology, the number of workstations/nodes, and their specifications, as explained in Table 5. The star topology is implemented in the network as this is a highly reliable and high performing topology with a high speed of transmission and no data collision.
Table 5 Description of three subnets
| Subnets | Subnet_Georgia | Subnet_India | Subnet_China |
| Topology | Star | Star | Star |
| Nodes | 8 | 8 | 6 |
| Routers | 2 CS_7000_6s_a_e6_ fe2_fr4_fl4_tr4 (Cisco 7000) | 2 CS_7000_6s_a_e6_fe2_ fr4_fl4_tr4 (Cisco 7000) | 2 CS_7000_6s_a_e6_fe2_ fr4_fl4_tr4 (Cisco 7000) |
| Switch | eth16_ethch16_fddi16_ tr16_switch | eth16_ethch16_ fddi16_tr16_switch | eth16_ethch16_fddi16_ tr16_switch |
| Server | File Database E-mail | File Database E-mail | File Database E-mail |
| Firewall | Cisco 7507 Ethernet slip8 firewall | Cisco 7507 Ethernet slip8 firewall | Cisco 7507 Ethernet slip8 firewall |
| Link | External Link – PPP_DS1 Internal link – 100BaseT | External Link – PPP_DS1 Internal link – 100BaseT | External Link – PPP_DS1 Internal link – 100BaseT |
3.2 Configuration Module
The configuration modules are important and required for the application definitions and their descriptions. These are configured in the proposed network as per the application’s requirements. The two essential configuration modules are the application configuration module and profile configuration module [31] and are shown in Figure 4.
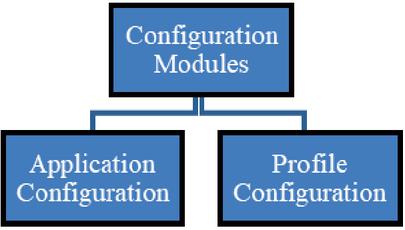
Figure 4 Configuration modules.
3.2.1 Application configuration
This module defines the application definitions, MOS, and voice encoder schemes for the network. The application definitions have various application description attributes. These are the database (DB), FTP, HTTP, e-mail, print, remote login, peer-to-peer file sharing, voice, video conferencing, and video streaming. It supports several communication systems with many voice conversion settings.
The various voice encoder schemes that can be under application configuration are PCM, ACELP, MP-MLQ, RPE-LTP, ACELP, VSELP, ADPCM, LD-CELP, and CS-ACELP.
The applications used in this paper are named as DB Application, FTP Application, and E-mail Application. Each of the applications has to be defined for the type of load through the application module attribute. Table 6 shows the applications and their load type used in the network. All three applications can be opted for either application type as per varying load requirements of no load, low load, medium load, and high load. Figure 5 shows the Riverbed layout of the application configuration table for application e-mail for defining the application type. Similarly, other application types have to be defined for the network.
Table 6 Applications specification
| Applications | Application Types | Meaning |
| DB Application | Database as High Load | Specifying high load database activities |
| FTP Application | FTP as High Load | Specifying high load file transfer protocol activities |
| E-mail Application | E-mail as High Load | Specifying high load e-mail activities |
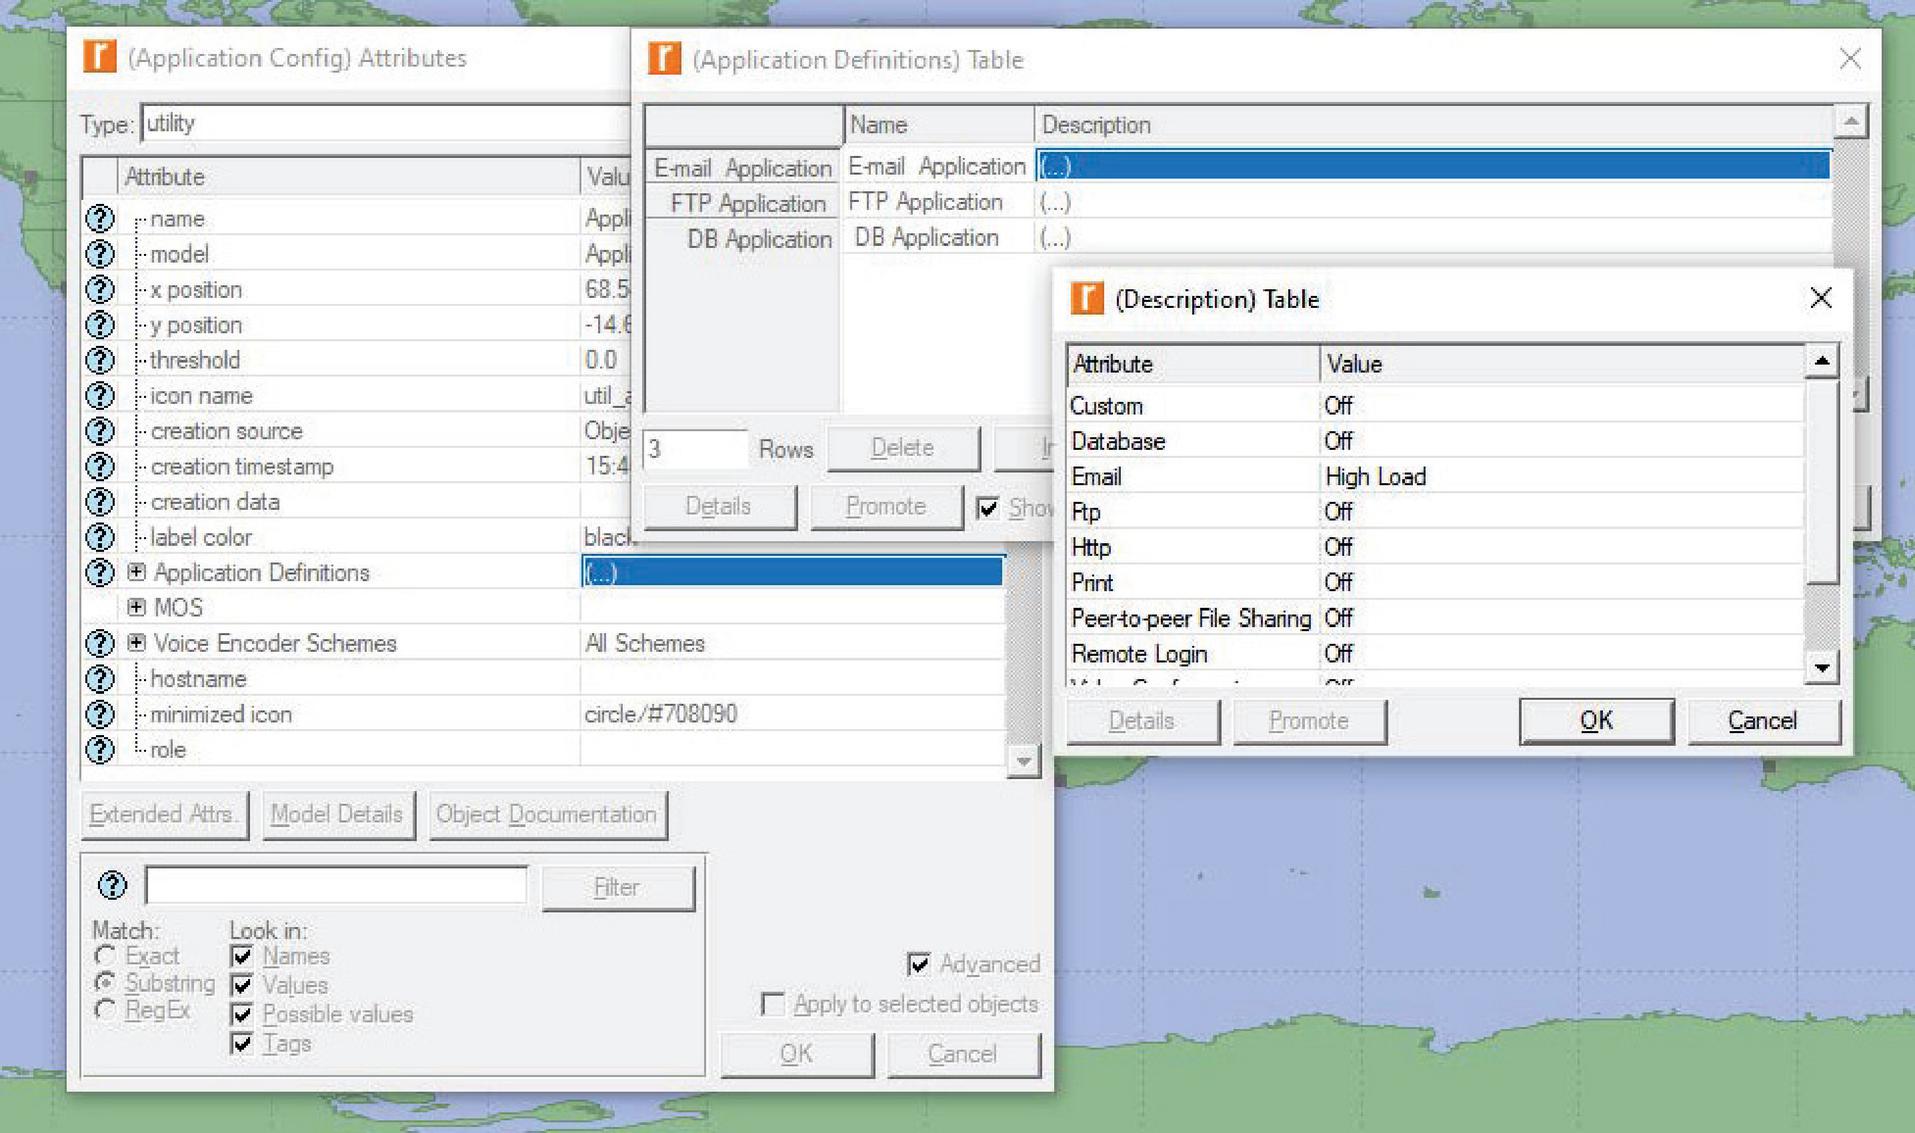
Figure 5 Application configuration table.

Figure 6 Profile configuration table.
3.2.2 Profile configuration
The profile configuration defines the profiles of user behavior for the network. The design of the network considered has three profiles named DB, FTP, and e-mail. Each application profile is described in terms of parameters as the operation mode, start time, duration, and repeatability. These profiles are based on different application definitions, and all profiles are configured to run simultaneously [28]. Figure 6 shows the configuration table for the profile e-mail. Similarly, all the profiles have to be defined for the network. The profile table contains a list of applications based on the network applications considered in this paper.
The applications and profiles are now defined on nodes and servers used for the data transfer. This is achieved by configuring the objects through the object attribute.
4 Simulation Analysis and Results
In the subnet_India, node_1 is defined for the application FTP, node_3 is defined for the application e-mail, and node_7 is defined for the application DB. In the subnet_China, node_2 is defined for the application FTP, node_3 is defined for the application e-mail, and node_5 is defined for the application DB. In the subnet_Georgia, node_0 is defined for the application FTP, node_3 is defined for the application e-mail, and node_6 is defined for the application DB.
In this paper, the node_3 from subnet_India sends a data request to the e-mail server in the Georgia_subnet through router main India to the Georgia main router. The e-mail server in the Georgia_subnet sends a reply from the e-mail server to the India_subnet through Georgia main router. Similarly, DB and FTP application connection is established from node_7 to DB server and node_1 to FTP server for the same two subnets. The network is designed in such a way that each subnet can establish a connection between other subnets.
Table 7 Simulation progress table
| Simulation Parameters | Values |
| Simulated time | 30 minutes 0 seconds |
| Total events | 1,808,998 |
| Average speed | 120,672 events/seconds |
| Elapsed time | 15 seconds |
| DES log | 201 entries |
The network is simulated for 30 minutes, and the total events simulated are 1,808,998. The simulation progress parameters are shown in Table 7. This section discusses the performance parameters analyzed and their results obtained with their comparison for both IP networks.
4.1 Performance Parameters
As already discussed, the paper aims to analyze the performance of routing protocols for different IP networks. The various parameters are diagnosed after the simulation, and then a comparison is made for RIP_IPv4 network and RIPng_IPv6 network. In this section, RIP_IPv4 is named IPv4, and RIPng_IPv6 is named IPv6 for simplicity, especially in the figures and parameters result discussion. The parameters are defined using Discrete Event Simulation (DES) in the modeler. It allows the researcher or operator to choose the appropriate performance parameters according to the requirements.
Table 8 categorized the different performance parameters as global and object statistics.
Table 8 Performance parameters
| Statistics | Technology | Application | Parameter | Unit |
| Global | IPv4, IPv6 | Delay | Ethernet delay | Second |
| DB Query, FTP, E-mail | Response time | Second | ||
| Traffic sent | Packets/Second | |||
| Traffic received | Packets/Second | |||
| IP | Background traffic delay | Second | ||
| Network convergence duration | Second | |||
| Number of hops | Unit less | |||
| Traffic dropped | Packets/second | |||
| IPv4 | RIP | Traffic received and traffic sent | Packets/Second | |
| IPv6 | RIPng | Traffic received and traffic sent | Packets/Second | |
| Object | IPv4, IPv6 | Point-to-point link | Link throughput | Packets/Second |
| Link utilization | – | |||
| Link queuing delay | Second |
Figure 7 shows the different IP addressing networks with their respective routing protocol: 7(a) RIP_IPv4 network and 7(b) RIPng_IPv6 network. R defines the RIP routing protocol in the figure, and R represents the RIPng routing protocol in the network.
7(a) RIP_IPv4 network.
7(b) RIPng_IPv6 network.
Figure 7 Proposed network.
4.2 Results
The analysis of all global and object statistics is discussed below.
4.2.1 Global statistics
The term global means for the complete network. The two simultaneous addressing networks, one for IPv4 and the other for IPv6, are analyzed and compared together for the results. The parameter values calculated are average values and are calculated from the values obtained by simulating the network over a simulation period. The definitions of all the performance parameters considered are given in Figure 8.
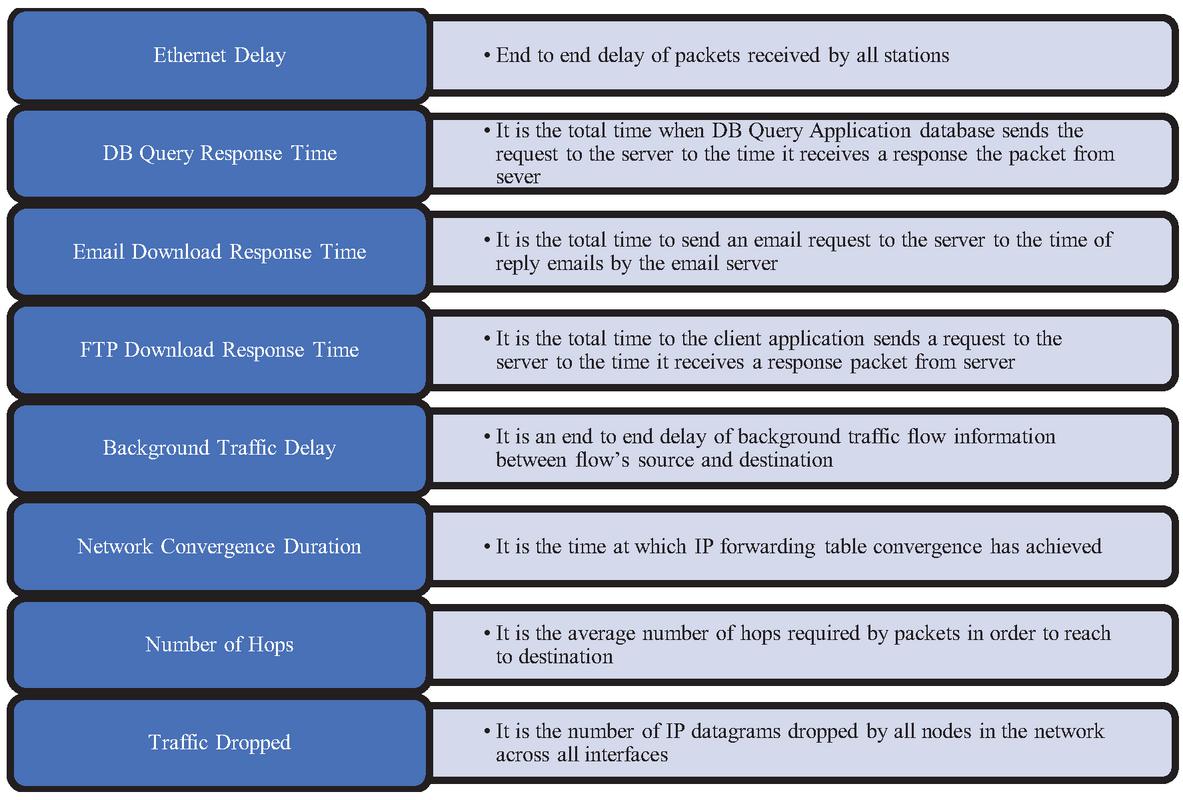
Figure 8 Definitions of performance parameters.
• Ethernet Delay
Several packets are required to transmit data to the node, and these are transmitted as bursts of packets. Buffering of packets is done for smooth delivery; otherwise, the packets may get lost. The delay rate is also dependent on the size of the packet: the smaller the packet, the faster the delivery. According to the results, IPv4 and IPv6 both have delay fluctuations at the beginning of the simulation as they both are receiving packets continuously, but as the time increases further, buffering smoothens, and delay becomes constant as 0.0035 seconds for IPv4 and 0.0030 seconds for IPv6. From the above comparison, it is found that IPv6 ethernet delay is better as compared to IPv4 for the required network, as shown in Figure 9.
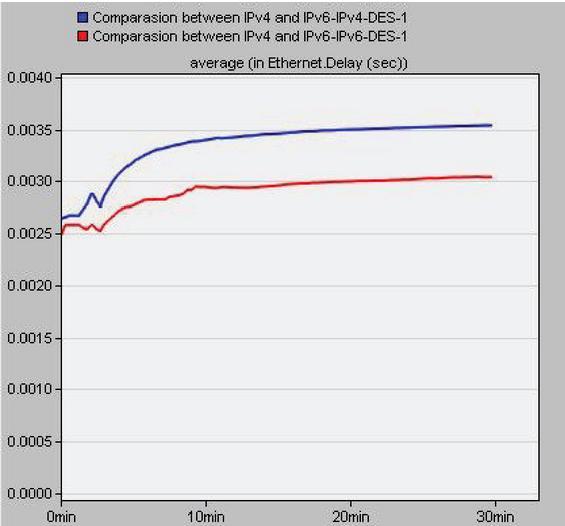
Figure 9 Ethernet delay.
• Response time
For IPv4, FTP download has a very high response time while the DB query has less and e-mail download has the lowest response time. All application response times are constant with increasing time. However, before the end of the simulation, FTP download response time takes step change and becomes stable. For IPv6, all applications have almost equal response time for initial minutes, but as time exceeds further, their response time changes. It is found that FTP download has minimum response time, but suddenly at 28 seconds, it takes a step change to the response time value of 100. E-mail download has a minimum response time than DB query response time, but after 13 minutes, both have almost equal response time, and in the end, e-mail download response time starts decreasing. The results graph of response time for IPv4 and IPv6 is shown in Figures 10 and 11, respectively. From the analysis, IPv4 has a better DB query, e-mail download, and FTP download response time than IPv6. As IPv6 has a higher packet overhead than IPv4, it gives limited buffering. Some other factors, like service time, wait time, and transmission time, may also affect response time performance.
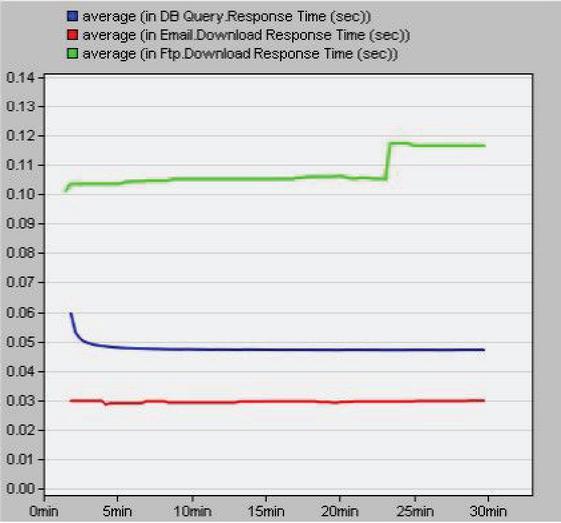
Figure 10 DB Query, e-mail, and FTP response time for IPv4.
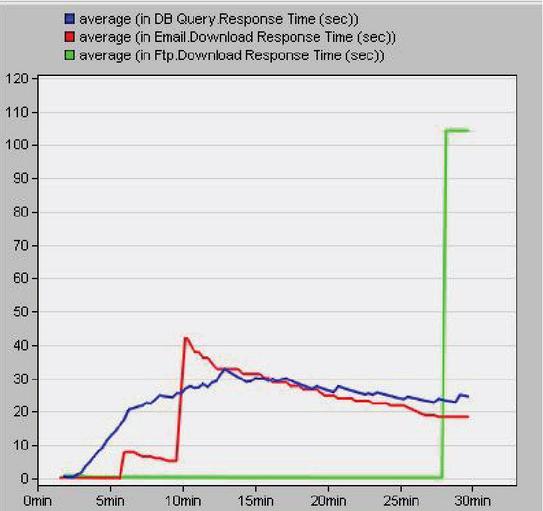
Figure 11 DB Query, e-mail, and FTP response time for IPv6.
• Background Traffic Delay
The performance of the network is also affected when there is a background traffic load. Usually, a threshold value is set for background traffic load, relying on the number of packets and their packet size. The threshold value defines the negative and positive effects of delays on a network [32]. According to the results obtained, the average background traffic delay for IPv6 is higher than IPv4 for the same duration of time. The step function in the result obtained in the graph states that the arrival rate is, to some extent, higher than the processed rate; therefore, delay steps are progressively higher and higher, which is shown in Figure 12. Resource management strategies can help to improve this value for IPv6. From the above comparison, it is found that IPv6 has a higher background traffic delay than IPv4.
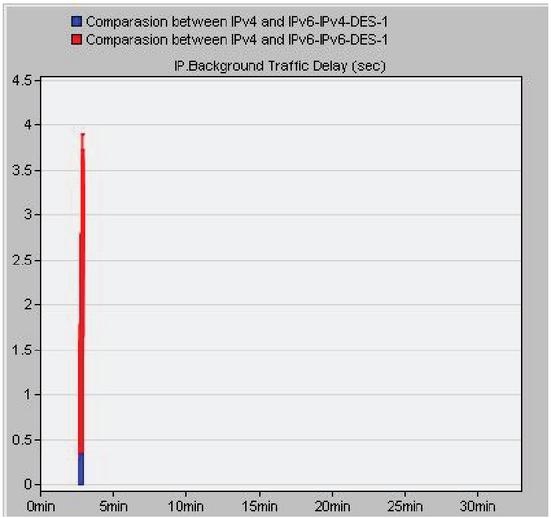
Figure 12 Background traffic delay.
• Number of Hops and Network Convergence Duration
IPv4, time to live, and in IPv6, the hop limit field defines the maximum time and maximum hop number that can be used by the packet before it gets discarded. The different geographic areas that are apart by distance also affect the hop number. Whenever there is a change in a network, the modified information is updated quickly so that the optimal route is selected to transfer data with minimum cost. As per the comparison between IPv4 and IPv6, the average number of hops is higher in IPv6 than IPv4 as shown in Figure 13.
Network convergence duration is defined as the time taken by a network for its updation. According to the results, IPv6 converges faster than IPv4 with 19.91 seconds duration, while IPv6 takes 17 seconds.
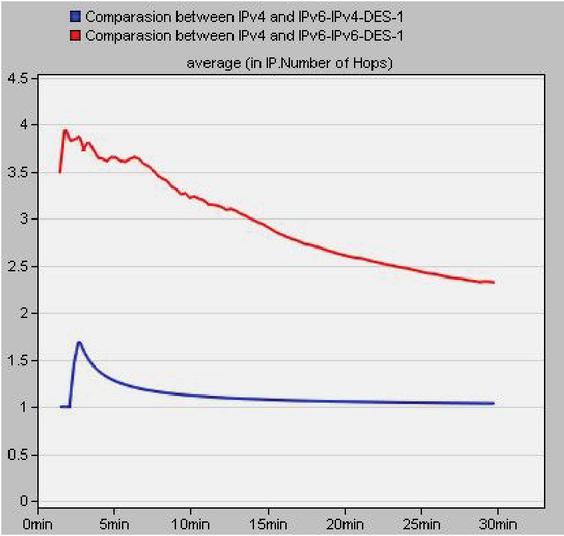
Figure 13 Number of hops.
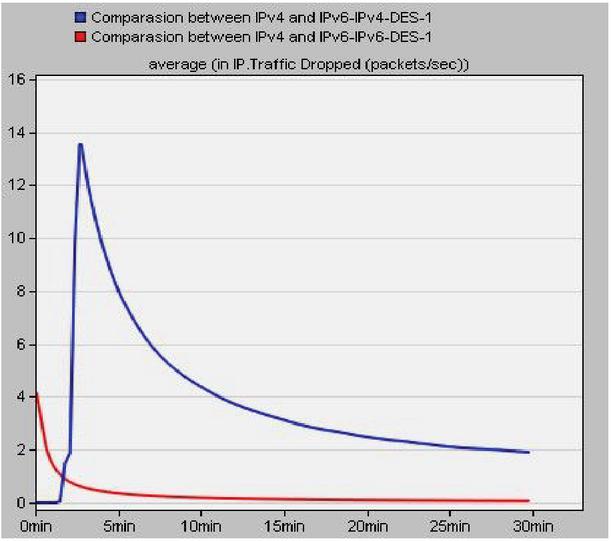
Figure 14 Traffic dropped.
• Traffic Dropped
15(a) RIP network.

15(b) RIPng network.
Figure 15 Traffic received and sent.
It can be seen from Figure 14 that IPv6 drops fewer packets as compared to IPv4. At the early simulation, the IPv4 has zero packets dropped while IPv6 has traffic dropped of 4 packets/second. As the simulation time increases further, the IPv4 packet dropped increases until a few minutes, and the maximum drop for IPv4 obtained is 13.8 packets/second; afterward, the traffic dropped starts decreasing continuously. In IPv6, as the simulation time increases, the packet drop decreases continuously and becomes almost zero, significantly less than IPv4. The lower ethernet delay and reduced convergence time result in a lower packet drop ratio for IPv6.
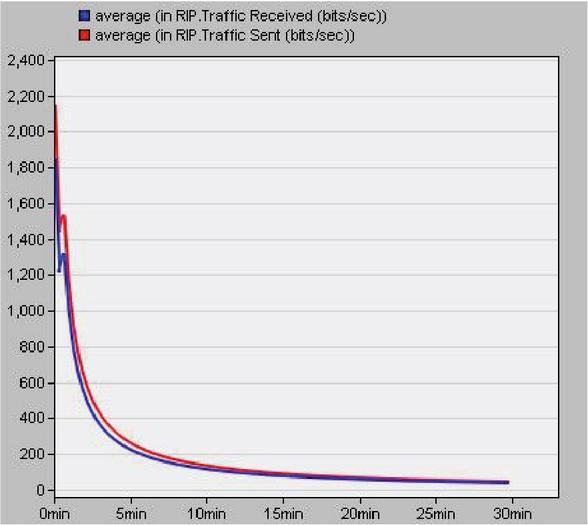
• Traffic Received and Traffic Sent
Figure 15 gives the traffic received and sent for IPv4 and IPv6 networks. Figure 15(a) is simulation results for the RIP network, while Figure 15(b) is the simulation results for the RIPng network. It can be seen from the graph that both RIP and RIPng perform very well in terms of traffic sent and received, respectively. In IPv6 using RIPng, higher traffic can be sent and received in a network compared to IPv4 using RIP. According to the results, the outputs are compared, and it is found that the ratio of output to input is better in IPv6 using RIPng by 2% than IPv4 using RIP.
The combined performance analysis with comparison for both the networks is shown in Table 9.
Table 9 Performance parameters result for IPv4 and IPv6
| Parameters | |||||
| (in average) | RIP_IPv4 Network | RIPng_IPv6 Network | Winner | Importance | Graphs |
| Ethernet delay | 3.3 milliseconds | 2.9 milliseconds | RIPng_IPv6 | Very High | Figure 9 |
| DB Query response time | 40 milliseconds | 21.66 seconds | RIP_IPv4 | High | Figures 10 and 11 |
| E-mail downloaded response time | 20 milliseconds | 18.33 seconds | RIP_IPv4 | High | Figures 10 and 11 |
| FTP download response time | 100 milliseconds | 6.49 seconds | RIP_IPv4 | High | Figures 10 and 11 |
| Background traffic delay | 40 milliseconds | 0.40 seconds | RIP_ IPv4 | High | Figure 12 |
| Network convergence duration | 19.91 seconds | 17 seconds | RIPng_IPv6 | High | – |
| Number of hops | 1.05 | 2.78 | RIP_IPv4 | Moderate | Figure 13 |
| Traffic dropped | 3.68 packets/second | 0.29 packets/second | RIPng_IPv6 | High | Figure 14 |
| Security | Optional IPsec (poor security) | Compulsory IPsec (high security) | RIPng_IPv6 | High | – |
| Scalability | High | Poor | RIP_IPv4 | Moderate | – |
Table 10 shows the comparative analysis of the proposed network with the other networks for the RIP and RIPng routing protocols. The analysis between networks is done using different network applications, the number of performance parameters evaluated their results, and their shortcomings. Detailed analysis is done between our proposed network and other networks for two IP networks using routing protocols. The results are explained well and detailed, using different performance parameters. The comparison highlights that other research papers have a limited number of performance parameters under consideration vs. this paper, where a much wider range of parameters have been included that are a superset of parameters used in other papers. For example, link throughput and delay parameters have been calculated in this paper but not in other papers. Further, it has been noted that the analysis for the selected parameters in other research papers studied is not as detailed and comprehensive as provided in this paper. In the network studied in this paper, all defined areas can communicate with each other via the network for all applications, whereas in other papers, no specific commentary has been made on inter-communication between different area networks.
Table 10 Comparison between the proposed method with other existing methods
| Methods | Application | Parameters | Results | Shortcomings |
| Network analysis [22] | VOIP, video conferencing, DataBase, and Internet browsing | Focused on only network convergence time | Video conferencing: RIPng has a shorter convergence time. IP Telephony/VOIP: RIPng has a faster convergence time for failure recovery network. DB: RIPng has the shortest convergence time | Each subnet or branch is defined for one application only |
| Network analysis [23] | Database, e-mail, and files transfer | Focused on packet delay, average response time, convergence time, packet delay, and link utilization of only two links | RIP has the smallest delay | Limited parameters evaluated. Only a few subnets/branches are defined for all three applications |
| Proposed analysis | FTP, DB Query, and e-mail | Focused on ethernet delay, response time, the number of hops, applications response time, background traffic delay, traffic dropped, convergence duration, traffic sent and received, point to point links throughput, links utilization, links queuing delay, security, and scalability | RIPng_IPv6 network has better traffic efficiency, lower ethernet delay, shorter convergence duration, fewer packets drop, and better security than the RIP_IPv4 network. RIP_IPv4 network has its advantages in better response times, lower traffic background delay, fewer hops required, and scalability. Also, simulates link statistics as average links throughput, average links utilization, and average links queuing delay | – |
4.2.2 Object statistics
The object statistics define the network’s link statistics, and these links are the different point-to-point connections in a whole network. The network is simulated for the links measurements, and performance parameters evaluated for point-to-point links are throughput, link utilization, and link delay. The detailed results and their analysis are given below.
• Point-to-Point Throughput
Table 11 Throughput for 10 link objects
| Throughput | ||
| Object Name | (Packets/Second) | |
| 1 | subnet_Georgia.Georgia server - Georgia main router [0] | 21,339 |
| 2 | subnet_Georgia.Georgia router - Georgia server [0] | 20,761 |
| 3 | subnet_Georgia.database server - node_8 [0] | 6402 |
| 4 | subnet_Georgia.file server - node_8 [0] | 6333 |
| 5 | subnet_Georgia.E-mail server - node_8 [0] | 6318 |
| 6 | subnet_India.india firewall - router india [0] | 5440 |
| 7 | subnet_China.china_firewall - china router [0] | 5407 |
| 8 | subnet_Georgia.Georgia router - node_8 [0] | 3898 |
| 9 | subnet_China.china router - node_6 [0] | 3741 |
| 10 | subnet_India.router india - node_8 [0] | 3721 |
| Total throughput | 83,360 |
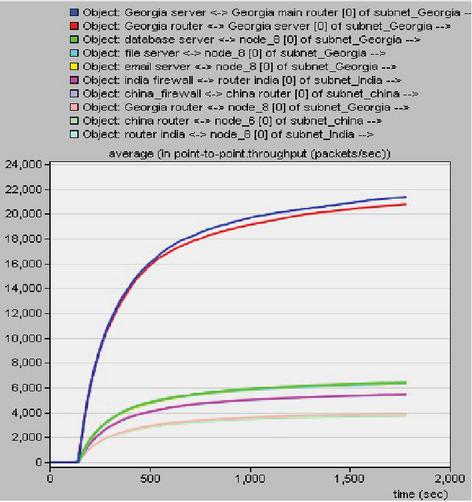
Figure 16 Point-to-point throughput.
The proposed network has many links in the network, but only the top 10 links are considered according to the traffic generation. The 10 link throughput values obtained after the simulation are shown in Table 11 and are arranged according to decreasing throughput values. From the analysis it is found that Subnet_Georgia.Georgia server to Georgia main router [0] link has a maximum throughput value of 21,339 packets/second. This link indicates the link between the Georgia server to Georgia’s main router [0] in Subnet_Georgia, and this link can also be seen in Figure 3(b).
Figure 16 shows the results graph indicating the values for each link for all 10 links considered. The average throughput value is obtained using Equation (1), which is 8336 packets/second.
| (1) |
Table 12 Link utilization for 10 link objects
| Rank | Object Name | Link Utilization |
| 1 | Internet Connection - subnet_china [0] – | 91.104 |
| 2 | Internet Connection - subnet_India [0] – | 91.101 |
| 3 | Internet Connection - subnet_Georgia [0] – | 91.099 |
| 4 | subnet_Georgia.Georgia server - Georgia main router [0] – | 25.607 |
| 5 | subnet_Georgia.Georgia router - Georgia server [0] – | 24.913 |
| 6 | subnet_Georgia.database server - node_8 [0] – | 7.834 |
| 7 | subnet_Georgia.file server - node_8 [0] – | 7.604 |
| 8 | subnet_Georgia.E-mail server - node_8 [0] – | 7.582 |
| 9 | subnet_India.india firewall - router india [0] – | 6.528 |
| 10 | subnet_China.china_firewall - china router [0] – | 6.489 |
| Total throughput | 359.86 |
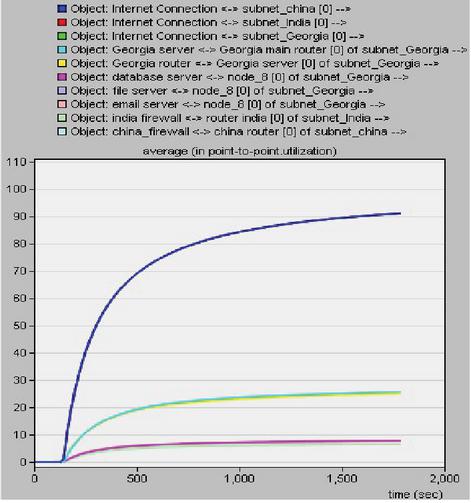
Figure 17 Point-to-point link utilization.
• Point-to-Point Link Utilization
Table 13 Queuing delay for 10 link objects
| Rank | Object Name | Queuing Delay (Seconds) |
| 1 | Internet Connection - subnet_India [0] – | 0.036139 |
| 2 | Internet Connection - subnet_Georgia [0] – | 0.031339 |
| 3 | Internet Connection - subnet_China [0] – | 0.03083 |
| 4 | subnet_Georgia.database server - node_8 [0] – | 0.00021 |
| 5 | subnet_Georgia.node_8 - node_4 [0] – | 0.000105 |
| 6 | subnet_Georgia.node_8 - node_3 [0] – | 0.000103 |
| 7 | subnet_Georgia.node_8 - node_1 [0] – | 0.000103 |
| 8 | subnet_Georgia.node_8 - node_5 [0] – | 0.000102 |
| 9 | subnet_Georgia.node_8 - node_2 [0] – | 0.000102 |
| 10 | subnet_Georgia.node_8 - node_7 [0] – | 0.000097 |
| Total queuing delay | 0.09913 |
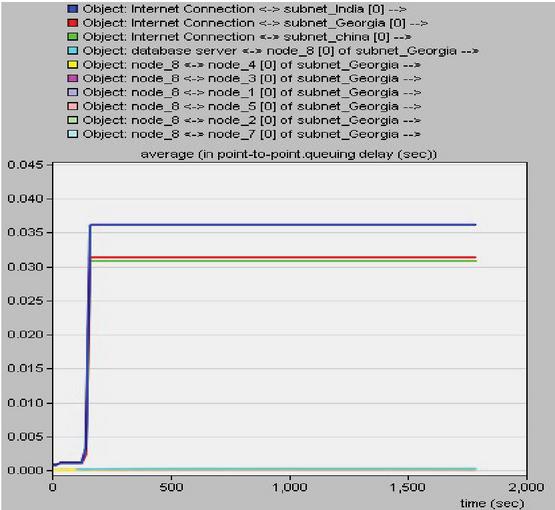
Figure 18 Point-to-point queuing delay.
The proposed network has many links in the network, but only the top 10 links are considered according to the traffic generation. The 10 link utilization values obtained after the simulation are shown in Table 12 and are arranged according to decreasing utilization values. The link Internet connection to subnet_China [0] has a maximum link utilization value. Figure 17 represents the graph for all 10 link objects with respect to time. The average utilization value for link utilization is 35.98 utilized.
• Point-to-Point Link Delay
The proposed network has many links in the network, but only the top 10 links are considered according to the traffic generation. The 10 links delay values obtained after the simulation are shown in Table 13 and are arranged according to decreasing delay values. From Table 13, the maximum delay is obtained in Internet connection to subnet_India [0] link with the value of 0.036139 seconds. Figure 18 shows the delay of the 10 links. The total average delay of 10 links is 9 milliseconds.
5 Conclusion and Future Scope
This paper aims to show the performance of the RIPng with IPv6 addressing network and RIP with IPv4 addressing network. The networks are simulated for three real-time applications: DB Query, FTP, and e-mail, and results are analyzed and compared. For the results and their analysis, the three application configurations are set to high load, and profile configurations are set to serial operation mode till the end of the simulation. As per the comparison between the two networks, the key parameters where RIPng_IPv6 outshines RIP_IPv4 are lower ethernet delay, shorter convergence duration, less drop of packets, and better security. The traffic efficiency comes out as better in IPv6 than IPv4. It is also found that according to geographic area distance between different subnet regions, the performance of the network changes, which may be because of different atmospheric conditions of different subnet regions. However, IPv4 addressing network has its advantages in better response times, lower traffic background delay, fewer hops required, and scalability.
Based on these results, it is concluded that both RIP_IPv4 and RIPng_IPv6 networks have their advantages, while the RIPng_IPv6 network has better traffic efficiency than the RIP_IPv4 network. Therefore, both RIP_IPv4 and RIPng_IPv6 networks can be used as per performance requirements as both are good in some performance parameters.
This paper also simulates link statistics as average links throughput, average links utilization, and average links queuing delay.
There is a lot of scope in improvising IPv6 to overcome its shortcomings. Further work can be done on packet drops, reducing the number of hops, and improving response time may yield an outstanding performance for IPv6. The use of other routing protocols on the same network may increase throughput, efficiency, and overall Quality of Service (QoS) of IPv4 and IPv6 networks. The same network can be used for other real-time applications to test the performance. The implementation and analysis of security can be considered in the future analysis of the network. The work can also be done on transition techniques between IPv4 and IPv6.
Acknowledgement
This work is supported by the Guru Gobind Singh Indraprastha University, New Delhi, India, under the Indraprastha Research Fellowship No.182.
References
[1] R. Hinden and S. Deering, “RFC 3513-Internet Protocol Version 6 (IPv6) Addressing Architecture,” Netw. Work. Gr. http//www.faqs.org/rfcs/rfc3513.html, 2003.
[2] S. M. Kerner, “Last of the IPv4 Addresses Allocatede.” [Online]. Available: https://www.enterprisenetworkingplanet.com/news/article.php/3923031/Last-of-the-IPv4-Addresses-Allocated.htm.
[3] O. Babatunde and O. Al-Debagy, “A comparative review of internet protocol version 4 (ipv4) and internet protocol version 6 (ipv6),” arXiv Prepr. arXiv1407.2717, 2014.
[4] J.-J. Kester, “Comparing the Accuracy of IPv4 and IPv6 Geolocation Databases,” Methodology, vol. 10, no. 11, pp. 12–17, 2016.
[5] T. Pellegrini, “IPv4 vs IPv6 Performance Comparison.” [Online]. Available: https://blog.sucuri.net/2016/11/ipv4-vs-ipv6-performance-comparison-part-2.html.
[6] M. A. Mohammed, A. F. Degadzor, and M. Asante, “Performance Analysis of Enhanced Interior Gateway Routing Protocol (EIGRP) Over Open Shortest Path First (OSPF) Protocol with Opnet,” 2016.
[7] W.-X. Wang, C.-Y. Yin, G. Yan, and B.-H. Wang, “Integrating local static and dynamic information for routing traffic,” Phys. Rev. E, vol. 74, no. 1, p. 16101, 2006.
[8] M. Waqas, S. U. R. Malik, S. Akbar, A. Anjum, and N. Ahmad, “Convergence time analysis of OSPF routing protocol using social network metrics,” Futur. Gener. Comput. Syst., vol. 94, pp. 62–71, May 2019.
[9] G. K. Dey, M. M. Ahmed, and K. T. Ahmmed, “Performance analysis and redistribution among RIPv2, EIGRP & OSPF Routing Protocol,” in 1st International Conference on Computer and Information Engineering, ICCIE 2015, 2016, pp. 21–24.
[10] N. Jain and A. Payal, “Comparison Between IPv4 and IPv6 using OSPF and OSPFv3 on Riverbed Modeler,” in 2019 IEEE International Conference on Advanced Networks and Telecommunications Systems (ANTS), 2019, pp. 1–7.
[11] N. Jain and A. Payal, “Performance Evaluation of IPv6 Network for Real-Time Applications using IS-ISv6 Routing Protocol on Riverbed Modeler,” in Procedia Computer Science, 2020.
[12] G. Malkin and R. Minnear, “Ripng for ipv6,” 1996.
[13] G. Malkin, “RIP version 2,” 1998.
[14] P. Wei, Z. Hong, and M. Shi, “Performance analysis of HTTP and FTP based on OPNET,” in 2016 IEEE/ACIS 15th International Conference on Computer and Information Science (ICIS), 2016, pp. 1–4.
[15] K. E. Khadiri, O. Labouidya, N. Elkamoun, and R. Hilal, “Comparative Study Between Dynamic IPv6 Routing Protocols of Distance Vectors and Link States,” in 2018 6th International Conference on Wireless Networks and Mobile Communications (WINCOM), 2018, pp. 1–6.
[16] I. Fictiguau and G. Toderean, “Network performance evaluation for RIP, OSPF and EIGRP routing protocols,” in Electronics, Computers and Artificial Intelligence (ECAI), 2013 International Conference on, 2013, pp. 1–4.
[17] A. Iqbal and S. L. A. Khan, “Performance Evaluation of Real Time Applications for RIP, OSPF and EIGRP for flapping links using OPNET Modeler,” Int. J. Comput. Networks Commun. Secur., vol. 3, no. 1, pp. 16–26, 2015.
[18] M. Syed and I. Y. Ambore, “Performance evaluation of OSPF and RIP on IPv4 and IPv6 technology using G. 711 Codec,” Int. J. Comput. Networks Commun.(IJCNC), vol. 8, no. 6, pp. 1–15, 2016.
[19] S. ShewayeSirika, “Performance Evaluation of Dynamic Routing Protocols for Real time application,” Int. J. Eng. Trends Technol., vol. 32, 2016.
[20] S. S. Samaan, “Performance evaluation of RIPng, EIGRPv6 and OSPFv3 for real time applications,” J. Eng., vol. 24, no. 1, pp. 111–122, 2018.
[21] M. M. H. Sabbir, M. T. Islam, S. Z. Rashid, A. Gafur, and M. H. Kabir, “An Approach to Performance and Qualitative Analysis of Routing Protocols on IPv6,” in 2019 International Conference on Electrical, Computer and Communication Engineering (ECCE), 2019, pp. 1–6.
[22] I. Nedyalkov, A. Stefanov, and P. Apostolov, “Modeling of the convergence time of an IP-based network with different traffic loads,” in IEEE EUROCON 2019-18th International Conference on Smart Technologies, 2019, pp. 1–6.
[23] I. Nedyalkov, “Studying of a Modeled IP – Based Network Using Different Dynamic Routing Protocols,” in 2019 X National Conference with International Participation (ELECTRONICA), 2019, pp. 1–4.
[24] B. Clore, M. Dunlop, R. Marchany, and J. Tront, “An evaluation of IPv6 in simulation using OPNET modeler,” in Proc. of the 8th Advanced International Conference on Telecommunications, 2012, pp. 111–115.
[25] M. N. Ismail and A. M. Zin, “Emulation network analyzer development for campus environment and comparison between OPNET Application and Hardware Network Analyzer?,” Eur. J. Sci. Res. ISSN, pp. 270–291, 2008.
[26] M. Sharma, M. Kumar, and A. K. Sharma, “HTTP and FTP Statistics for Wireless and Wire-Line Network with and without Load Balance Based on OPNET,” Int. J. Inf. Syst. Sci. Inst. Sci. Comput. Information, Canada, vol. 5, no. 1, pp. 112–125, 2009.
[27] X. Tan, Z. Zuo, S. Su, X. Guo, X. Sun, and D. Jiang, “Performance Analysis of Routing Protocols for UAV Communication Networks,” IEEE Access, vol. 8, pp. 92212–92224, 2020.
[28] F. Yakubu and B. I. Ahmad, “Traffic Flows Modeling of a Digital Center at ABU Using OPNET Software,” Int. J. Electr. Electron. Comput. Syst., vol. 2, no. 1, 2011.
[29] “China: number of internet users 2020 |Statista.” [Online]. Available: https://www.statista.com/statistics/265140/number-of-internet-users-in-china/. [Accessed: 26-Nov-2020].
[30] TRAI, “TRAI Performance Indicator Report Oct-Dec 2019.”
[31] P. Rukmani and R. Ganesan, “Scheduling algorithm for real time applications in mobile ad hoc network with opnet modeler,” in Procedia Engineering, 2013, vol. 64, pp. 94–103.
[32] O. Galinina, A. Pyattaev, S. Andreev, M. Dohler, and Y. Koucheryavy, “5G multi-RAT LTE-WiFi ultra-dense small cells: Performance dynamics, architecture, and trends,” IEEE J. Sel. Areas Commun., vol. 33, no. 6, pp. 1224–1240, 2015.
Biographies

Neha Jain is currently a Research Scholar with the University School of Information, Communication & Technology, Guru Gobind Singh Indraprastha University, New Delhi 110078, India. She received the M.Tech. degree in electronics and communication from Indra Gandhi Institute of Technology, Delhi, and the B.Tech. degree in electronics and communication from Institute of Engineering and Technology, Rajasthan University. She is a member of IETE and has more than 10 years of teaching experience. Her research interests include computer networks, wireless sensor networks, and the Internet of Things.

Ashish Payal is currently an Assistant Professor with University School of Information, Communication & Technology, Guru Gobind Singh Indraprastha University, New Delhi 110078, India. He received the Ph.D. degree in the area of wireless sensor networks from Guru Gobind Singh Indraprastha University, New Delhi, India, in 2016. He received the M.Tech. degree in computer science and engineering from Punjabi University, Patiala, Punjab, India, and the M.Sc. degree in applied physics from Guru Nanak Dev University, Amritsar, Punjab, India. He is a member of IEEE and ACM. His teaching and research interests include mobile ad hoc networks, wireless sensor networks, computer networks, and the Internet of Things.

Aarti Jain received the B.Tech. degree in electronics & communication engineering from Beant Govt. College of Engineering, Punjab in 2002, the M.E. degree in electronics & communication engineering from Delhi College of Engineering, New Delhi, India, in 2009. She received her Doctorate in 2016 from Guru Gobind Singh Indraprastha University in the field of wireless sensor networks. She has more than 17 years of teaching experience. Her research interests include the Internet of Things, free-space optics, 5G communications, quality management in wireless sensor networks, fuzzy logistics, and bio-inspired computing and its application. She is a senior member of IEEE and an associate member of IET. She served as chairperson and session chair in various international conferences. She has published several research papers in SCI-indexed journals and international conferences.
Journal of Web Engineering, Vol. 20_5, 1327–1366.
doi: 10.13052/jwe1540-9589.2055
© 2021 River Publishers