Managing Factors to Stages of the Online Customer Journey Influence on Brand Trust
Laksamon Archawaporn and Adisorn Leelasantitham*
Technology of Information System Management Division Faculty of Engineering, Mahidol University Nakhon Pathom, 73170, Thailand
E-mail: laksamon.arh@student.mahidol.ac.th; adisorn.lee@mahidol.ac.th
*Corresponding Author
Received 10 August 2020; Accepted 01 March 2021; Publication 12 July 2021
Abstract
This study examines the possibilities of enhancing relationship between external factors and five main steps of the customer journey influence on brand trust. Our aim is to fill a gap of empirical studies on the online channel in Thailand. We identify four external factors that contribute to each step of customer journey base on customer journey map theory. Data collected from 400 respondents was tested against the research model using a partial least squares (PLS) approach. Our hypotheses testing the determinants set of the customer journey with a statistical inferential analysis that, show the results support 7 of the 9 hypotheses, with a significant relationship between analysed constructs (Social influencer, eWom, and Marketing campaign) which are the factors that might contribute to online customer journey at the present.
Keywords: Customer journey, brand awareness, purchase, brand trust, marketing funnel.
1 Introduction
Technology has changed the world in many ways during the last decade. Evidently online technology and real-time connecting are the heart of our daily life. We can link and collaborate with friends, family, and colleagues instantly moreover, sharing or accessing the information with other people can be also easily [1]. The global expansion of technology has greatly transformed the lifestyle of retailers. Internet is the point for pushing the shop and store to connect with customers. Online shopping is a convenient way for the customer to save cost, save time and save the itinerary. E-commerce statistics confirmed the explosive pace at which this industry has developed as worldwide B2C e-commerce sales amounted to more than 1.2 trillion US dollars in 2016 [2, 3].
Today, technology change our lifestyle to digital life. This situation is call “Digital Disruption” that infiltrate our lifestyle routine and our jobs therefore we need to adapt and finding the new choice from the new business models in digitalization. The phenomenal growth of E-Commerce become the popular platform and to be the new trend in the digital world that get feedback from every age customers as well. Many customer love to shop from online stores and spent much time to compare the price and finding the best price in the selected shop [4]. From 2014 to 2020 the ratio of e-commerce increases around 200% due to the many stores go to online website and application moreover shopping application can respond immediately all twenty-four hours. The changing of e-commerce that rapid growth in Thailand, the relationship between customer and the store has the huge changed when the social media and online communities have occurred [5]. Everyone is getting their information and communicating in new ways today compared to the recent past. This situation affects many retailers in the online market, they have a lot of competition and difficult to launch marketing campaign. Conversely, it is good for the consumers because they have more choices product varieties therefore learning and survey about consumer behaviour is important to enable entrepreneurs to grow and make profits. The interesting issue of this big change in the market shows brand awareness and brand image that the consumers are aware of the product information or product well-known will be able to push up brand value[6]. Hence, the marketing strategy must create customer satisfaction, customer experience and customized experience for build up the awareness. From many researchers found that more over 60 percent of satisfied customers love to purchase more from a shop or retailer that satisfied them just with a good experience. The issue of marketing trend changing reveals that the consumers with strong brand awareness can create value towards brand. In consumers’ perspective, well-known brand or brand with strong brand awareness in consumers’ mind tend to have more advantage and having more successful sales. For the competitive market, consumers need to acquire information that help them make the decision. Besides, consumer must consider various information by using emotions and feeling to make purchasing decision.
The implications of our research are important for retailers or seller how to know the customers finding product information before the purchasing, different process, the seller can better conduct their channels and expand more strong marketing strategies, which can ultimately maximize the process of changing or causing something to change from one to another from finding the information for purchasing. The marketing theory of e-commerce declares the mass product seller or high-profile entrepreneur could effectively build relationships with customers across all channels, nowadays the brands seller is challenged in many questions of how to communicate to the customers and inspire target consumers. Conceptual model of customer journey has changed from the past, from direct step to step changed to more complicated process in the present which is not an easy line and some factor has a big impact as the result of global technology. The aim of the research is that where the customer hops from this step to the next step in another place which difference from a linear line progresses from the past. Therefore, the purpose of this research is to find the real factors that impact to customer journey in online market by analyzing consumers behavior in comprehensive manner [7]. Conceptual model of customer journey is hugely different from the past, simple process to more complicated process in the present which is not a straight line and some factor has a big impact as the result of global technology. The point to study and research is that they have moved from a linear journey, where the customer progresses from one step to the next, into a more networked environment where the customer hops from one place to another. Therefore, the purpose of this research is to find the real factors that impact to customer journey in online market by analyzing consumers behavior in comprehensive manner.
2 Literature Review
The topic research in digital trends have increased especially topic in marketing management and strategy relevant. Customer journeys is the one of any concept to build-up the way to understand the customer. The Customer Journey theory is the simple line for shopping in the past but the current customer journey more complex and a lot of dimensions that tracks options through various channels, many of which are associated. Customers can come in, move out and return back into the journey line at several different points. The customer journey is the complete sum of experiences that customers go through when interacting with the company and brand. The customer journey mapping is the full transaction or experience between the store, that have to learn and record [1, 8].
The Customer Journey Model of Court et al. [9] in the Mckinsey Quarterly article, an improvement from the Marketing Funnel known to marketers in the past. With further improvements that the consumer decision-making process is not a straight line steadily decreasing options in each step previously, but the options may be added or reduced at any stage in the path. Therefore, as a marketer, it should improve the way people communicate and reach consumers, originally aiming to bring the brand into the initial choice group. In the minds of consumers only as a step-by-step analysis Which has the most influence on consumer behaviour, which can be summarized into four main steps as below
1. Initial Consideration Set is the initial choice for consumers. Which may be influenced by sight Attitude towards various brands and past experiences.
2. Active Evaluation is the process of collecting data and evaluating various options. Is when the customer is most exposed to information.
3. Moment of Purchase is the time period for real purchasing decisions Which can still receive the impact of environmental factors before the purchase is completed.
4. Post Purchase Experience is the period that customers recognize and assess the actual use of the product in order to assist in the next decision.
After that, develop to five stages [10, 11] including
1. Awareness from sightings attitude towards various brands and past experiences
2. Consideration from search, data gathering and evaluation of various options
3. Purchase decisions
4. Retention, the ability to keep the customers repurchase frequently.
5. Brand Advocacy, commitment to love the brands continue to support and promote the services or products to new customers organically.
Previously research shown different frameworks or conceptual models for classifying product and service design visualization techniques and purposes provide useful perspectives on the characteristics and purposes of customer journey maps, as shown in Table 1.
Table 1 Comparison customer journey with related literature in the scope of study
| Review | Study | Contributions |
| Shulman and Savaskan, 2009 | Stage of Purchase decisions | Consumer purchase and return decisions are influenced by seller’s promotion campaign [12] |
| Jiang and Rosenbloom, 2005 | Stage of Retention | Customer satisfaction influence on product return intention [13] |
| Peterson and Kumar, 2014 | Stage of Retention and Brand Advocacy | Customer perceived risk of current and future purchases [14] |
| Lee and Yi, 2017 | Stage of Purchase decisions | The relationship between a gift with purchase promotion and consumer behavior [15] |
| Priron and Young, 2000 | Stage of Consideration | The reason of borrowing, gender and income effect on retail [16] |
| Adam Richardson, 2010 | Customer journey map | Using Customer journey Maps to Improve Customer Experience |
| Horsky et al., 2006 | Stage of awareness and retention | Liking brand choice with consumer behavior and loyalty [17] |
| Chaudhuri and Holbrook, 2001 | Stage of Purchase decisions | Attitudinal and purchase brand trust in many categories [18] |
| Halvorsrud et al., 2016 | Customer journey map | Improving service quality through customer journey analysis [19] |
| Anne et al., 2020 | Customer journey map | Clarifies the factors influence consumers’ shopping behavior [3] |
The research consists of studying the factors that influence consumer behavior in the society, the reference group, and the environment, including studying factors affecting brand confidence and trust. Besides, the research is testing and developing the structural equation model of factors that influence the continuous buying decisions of consumers in the sample group that have experience in buying products from e-commerce platform continuously or more than 2 times per month. The acquired data are used to analyse and processed to reach a suitable conclusion as a guideline to be a case study for small retail entrepreneurs. Thus, the small retail entrepreneurs can apply in their business operations for both offline and online markets that are now all connected as one channel. (Omni-channel). In addition, to create a way of business development to win the market sustainably. This study contributes to marketing theory in several ways and helps to understand the relationship between external factors and customer journey. This indicates that a causal relationship is the best way to conceptualize the link between the factors.
The Factors
Social influencer: Our literature review revealed factors that influence consumer behaviour by many shoppers in many areas confirmed that social factors can involve the shopper [20]. The shopping experience, that are good emotional if we buying with other magnifies celebrities such that others’ presence can add to the pleasure and excitement of the shopping experience [21]. Among the existing research that explores some of the retailer when customer interact with the shop by connecting with feedback and opinions from social factors [3]. In addition, the expert interviews and focus groups guideline shown the detailed structure of which relevant phases the choice of the social factors along the journeys.
Word-of-mouth (eWOM): Word of mouth is a marketing communication concept of informal for exchanging news and information with personal recommendations about products or services, it is a guarantee by significant influence on people’s feelings and knowledge. Word-of-mouth is in a fast way to share more information about products or services with known individuals, exchange or respond the reason to purchase the product, with colleagues, friends, and family members believed that WOM is the key point to changing consumer’s attitude more than direct sales or advertising. Moreover WOM can lead augmented by a higher degree of satisfaction, profitability, and loyalty [11, 20].
Market Information: Market Information means any information that is written, printed, audio-visual or graphic information, including advertising, leaflet, flyers, catalogues, posters, and signs, that are used to assist in the sale or promotion of a product. Market Information is an importance wording of product selling and highlight the point of sales in the decision-making processes, related to the spotting of opportunities and to the best business management [22, 23].
Marketing campaigns: Marketing campaigns is part of tools to promote products through different types through many media, such as television, radio, print-ad, online banner, online pop-up, and online platforms. Campaigns can include activities selling support such as demonstrations, video conferencing, and other interactive techniques that are not solely reliant on advertising. Marketing campaigns are important factors for businesses operating in highly competitive markets and entrepreneurs may initiate frequent marketing campaigns and devote significant resources to generating brand awareness and sales [22].
3 Research Model and Hypothesis
The research has been conducted on the basis of the state of customer journey model, this study estimates the factors that contribute to effective the five main states of customer journey. The variables in this research were adapted from external factors in literature which are usually from the consumer’s mind.
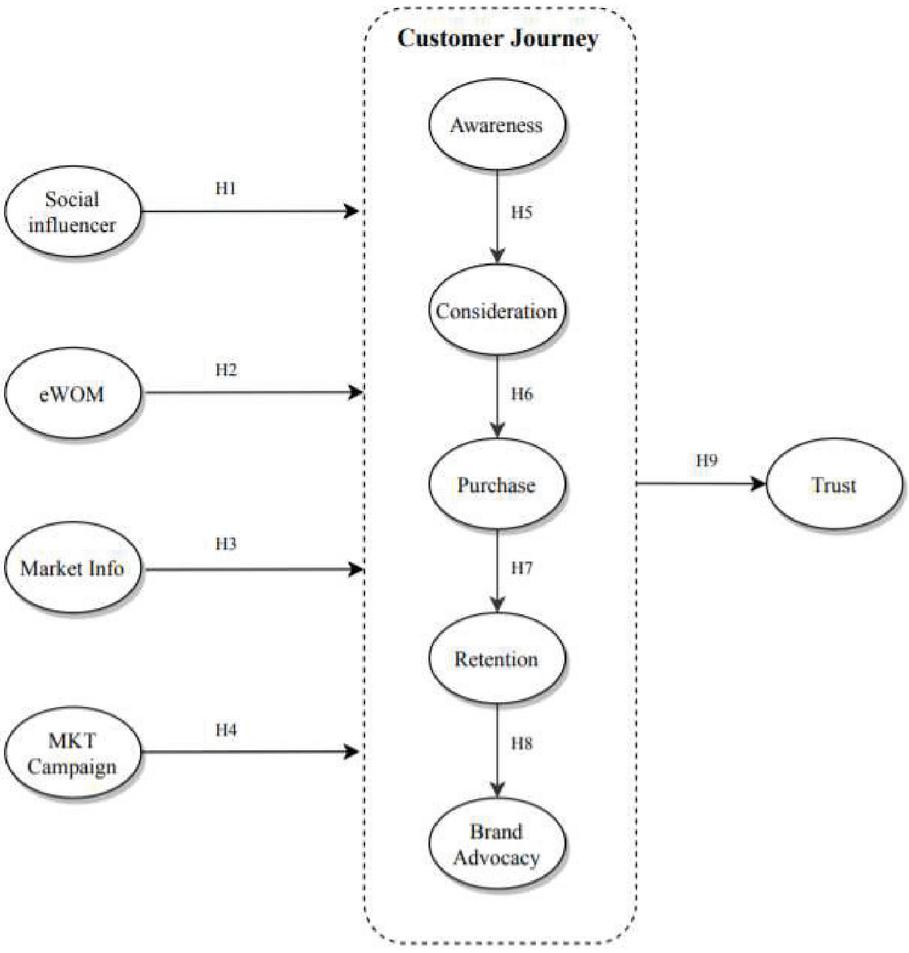
Figure 1 Proposed research model.
3.1 Factors
3.1.1 Social influencer
More than 5 years ago, we have seen social influencer many changes occurred and grow rapidly larger or more important [5, 24] defined social influencer was the well-known person to motivate the purchasing, and more importantly popular factors for shopping online at the present. Social influencers can build strong purchasing decisions of others because of their famous image, recognition, knowledge, position, or relationship with the customer. Therefore, this research will use these factors to understand customer journey, propose the hypotheses as follows:
H1: Social influencer positively influences the customer journey.
H1a: Social influencer positively influences the state of awareness
H1b: Social influencer positively influences the state of consideration.
H1c: Social influencer positively influences the state of purchase.
H1d: Social influencer positively influences the state of retention.
H1e: Social influencer positively influences the state of brand advocacy.
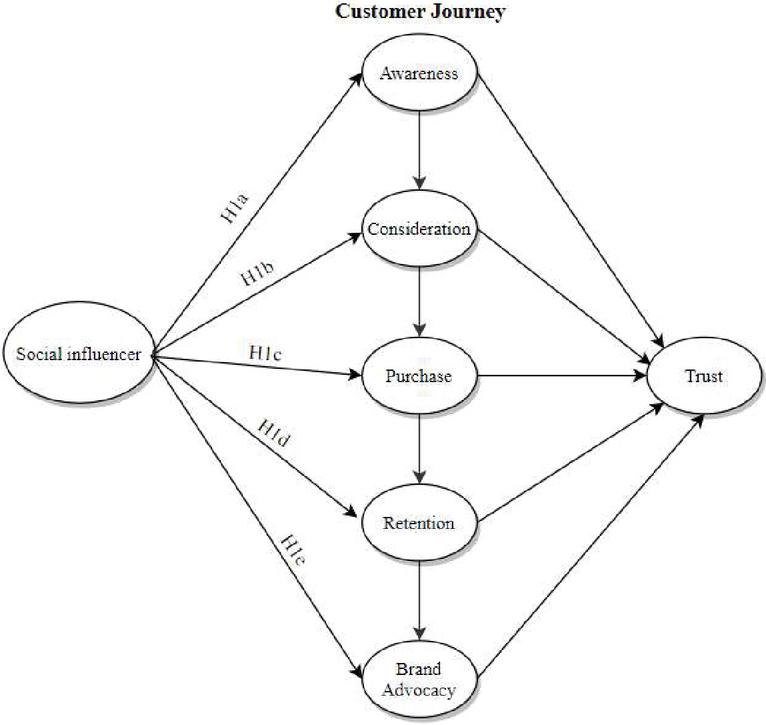
Figure 2 Social influencer hypotheses.
3.1.2 Electronic word-of-mouth (eWOM)
In the present time, electronic word of mouth is a new form of online communication that is the special factors in marketing communication line. This form has taken new online platforms, and social connecting in social media community which have made it one of the most influential information sources [25].
H2: eWOM influencer positively influences the customer journey.
H2a: eWOM influencer positively influences the state of awareness
H2b: eWOM influencer positively influences the state of consideration.
H2c: eWOM influencer positively influences the state of purchase.
H2d: eWOM influencer positively influences the state of retention.
H2e: eWOM influencer positively influences the state of brand advocacy.
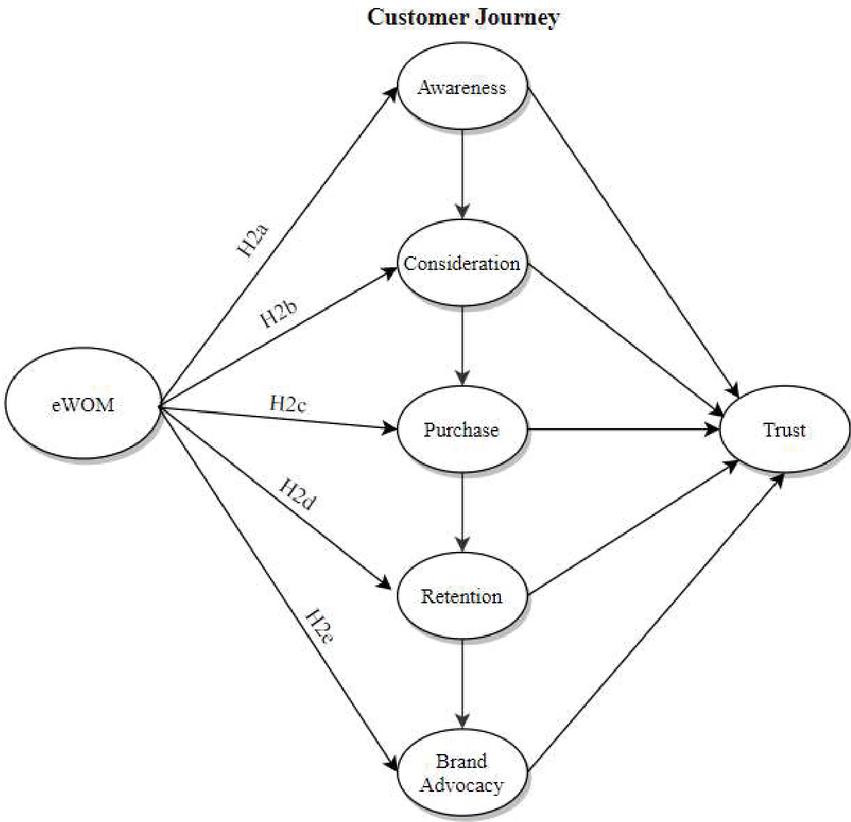
Figure 3 Electronic word-of-mouth (eWOM) hypotheses.
3.1.3 Market information
Customers can be finding, searching, and quickly responding customer need to product based on their interesting product and service. Therefore, marketing information can serve their inherent needs. The use of their information can save the time for decision making. The company can build up the customer satisfaction by provides the product benefit and information to all marketing activities regarding strategic planning, promotion campaign. In order to put the sales volume and market share [26, 27].
H3: Market information influencer positively influences the customer journey.
H3a: Market information influencer positively influences the state of awareness
H3b: Market information influencer positively influences the state of consideration.
H3c: Market information influencer positively influences the state of purchase.
H3d: Market information influencer positively influences the state of retention.
H3e: Market information influencer positively influences the state of brand advocacy.
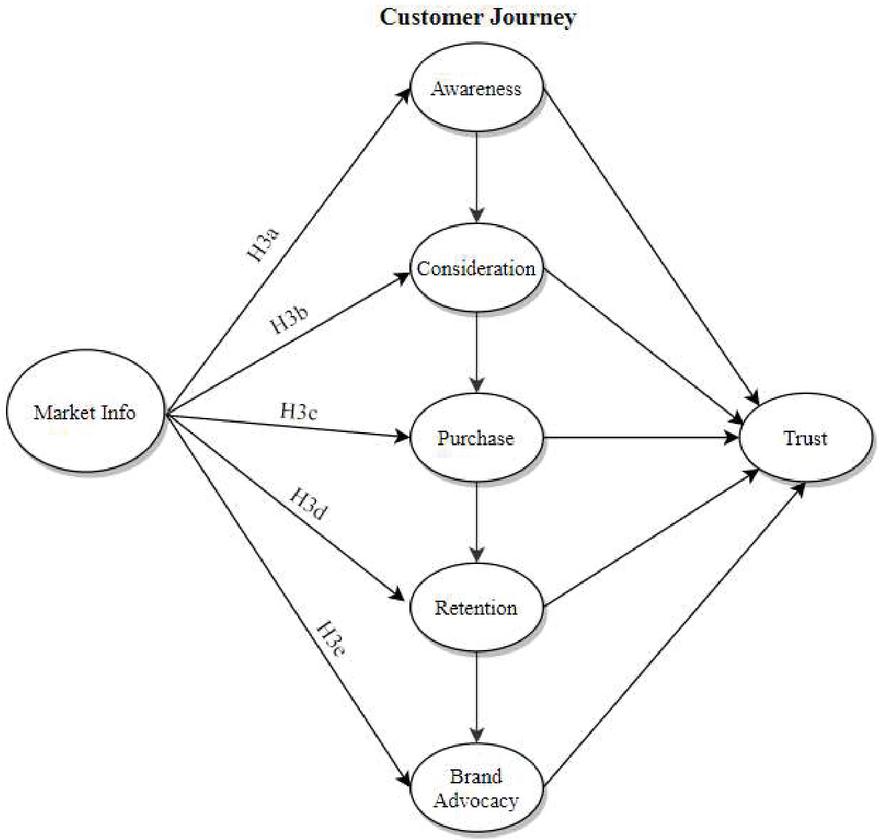
Figure 4 Market information hypotheses.
3.1.4 Marketing campaign
A marketing campaign is any activities in marketing planed, The aim of business need to push marketing campaign both of offline and online achieve the business target, “campaign is defined as a connected series of operations designed to bring about a particular result” [28].
H4: Marketing campaign influencer positively influences the customer journey.
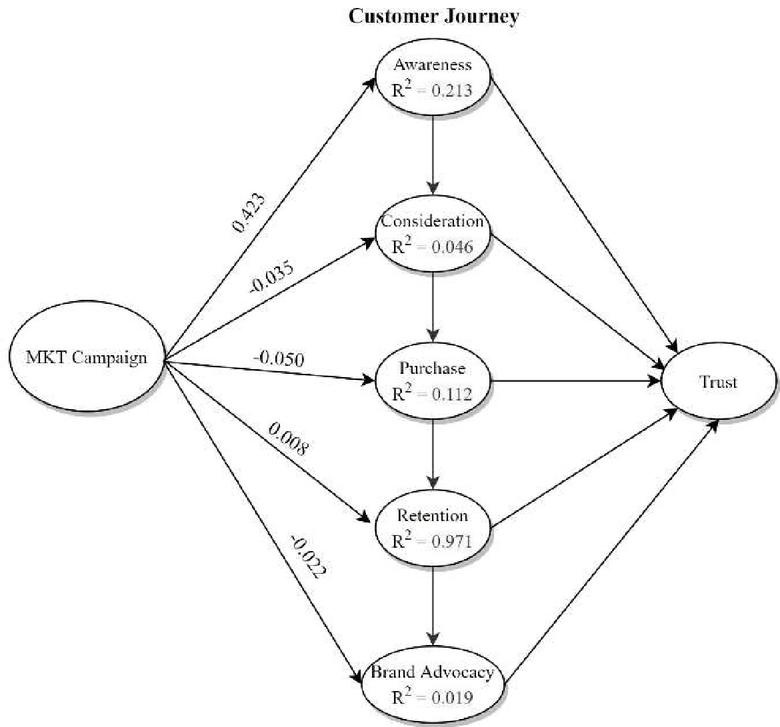
H4a: Marketing campaign influencer positively influences the state of awareness.
H4b: Marketing campaign influencer positively influences the state of consideration.
H4c: Marketing campaign influencer positively influences the state of purchase.
H4d: Marketing campaign influencer positively influences the state of retention.
H4e: Marketing campaign influencer positively influences the state of brand advocacy.
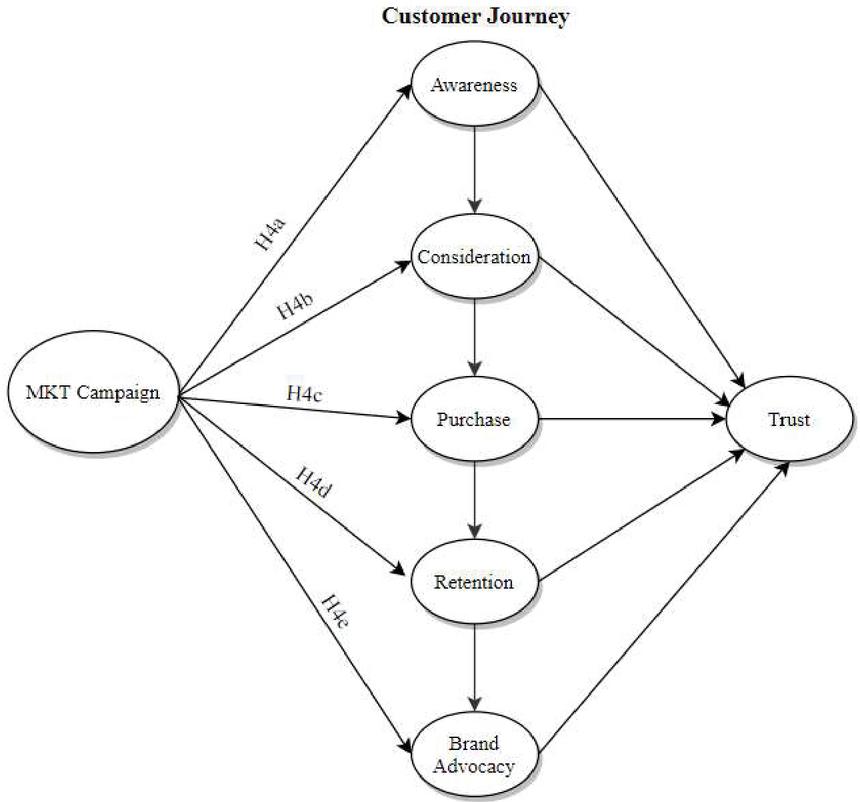
Figure 5 Marketing campaign hypotheses.
3.2 Customer Journey
This research embraced the process as the theoretical perspective of customer journey that general step because it is important to consider not only be active purchase phase. The understanding customer journey can also the accumulated knowledge and attitude formation that happens prior to the consumers need recognition and decision to purchase the products. The view of the customer journey use for the company planning the consumer’s active decision phase, it is often too late if the company not ensure that our brand will sit in the consumer’s mind and considerate the use the brand [30, 31].
H5: Awareness influencer positively influences consideration in customer journey map.
H6: Consideration influencer positively influences purchase in customer journey map.
H7: Purchase influencer positively influences retention in customer journey map.
H8: Retention influencer positively influences brand advocacy in customer journey map.
H9: Customer journey influencer positively the trust.
4 Methodology
4.1 Sampling and Data Collection
The data for this research study and evaluate the hypotheses constructed were collected using an online questionnaire. We collected data using a number of qualitative methods, carried out a web-based survey. The data were collected from August–November 2019, the sampling population was the consumer in Thailand who had used online shopping experience more than 3 times a month. A total of 400 surveys were completed and used in the analysis of this study.
Before the testing, we sent out the questionnaire to the Institutional Review Board of Mahidol University (IRB) for approving. Our questionnaire was passed the rule of ethical research No. CIRB 2018/105.2105. We began our data collection process at the pretest step with the respondents who were a online customer greater than 18 years old for the test of data cleaning and coding. “It was statistically analyzed with a program of PASW Statistics v.18.0.0 and SmartPLS v.3.2.8” [32] employing the descriptive and inferential statistics through the Measurement Model and the Structural Model for the purpose of testing.
4.2 Questionnaire
The questionnaire is divided into 5 parts
• The first part of the questionnaire was aim for screening only consumers who had used online shopping experience more than 3 times a month.
Table 2 The demographic data of respondents
| Demographics | |||
| Variable | Categories | N | % |
| Gender | Male | 100 | 25 |
| Female | 300 | 75 | |
| Total | 400 | 100 | |
| Age | 20 | 5 | 1.25 |
| 20–30 | 68 | 17 | |
| 31–40 | 201 | 50.25 | |
| 41–50 | 81 | 20.25 | |
| 51 | 45 | 11.25 | |
| Total | 400 | 100 | |
| Education | Bachelor’s degree | 27 | 6.75 |
| Bachelor’s degree | 223 | 55.75 | |
| Master’s degree | 135 | 33.75 | |
| Ph.D. | 15 | 3.75 | |
| Total | 400 | 100 | |
| Income | 15,000 THB | 30 | 7.5 |
| 15,000–35,000 THB | 133 | 33.25 | |
| 35,001–50,000 THB | 103 | 25.75 | |
| 50,001–65,000 THB | 51 | 12.75 | |
| 65,001 THB | 83 | 20.75 | |
| Total | 400 | 100 | |
• The second part collected respondent’s information including gender, age, education, income etc., which was used to determine the personal attributes.
• The third part collected respondent’s behavior and buying experience
• The fourth included a series of questions about the factors that influence to purchase intention based on constructs that were measured using and adapting existing scale items in the literature. All responses were recorded by means of an ordinal 5-point Likert scale, that ranged from “completely disagree” to “completely agree.”
• The fifth in included a series of questions about the stages of online customer journey that were measured using and adapting existing scale items in the literature. All responses were recorded by means of “an ordinal 5-point Likert scale”, that ranged from “completely disagree” to “completely agree.”
5 Data Analysis and Results
We organized and confirmed factor analysis to validate “the theory-driven constructs by in partial least squares (PLS) application of SmartPLS v.3.2.8” which a quasi-standard in marketing research for analyzing the cause effect relation among latent constructs [33]. For the best result and supported the data collection, in previous research suggested bootstrapping function to 5,000 samples for assess the path significance.
The 400 customers respondents who had been purchased on online channel more than 3 times a month included 100 males (25.00%) and 300 females (75.00%). The first three ranks of age group identified 31–40 years containing 201 respondents (50.25%), 41–50 years containing 81 respondents (20.25%) and 20–30 years containing 68 respondents (17.00%). The top rank of education was bachelor’s degree 223 respondents (55.75%) and the monthly average income was about 15,000–30,000 THB.
As for the data of customer purchasing behaviours of the respondents, the first consistent buying were 2–3 times per week and the respondents preferred to buying both online channel and offline channel (Omni channel) 49.25%.
Table 3 The purchasing behaviours data of respondents
| Variable | Categories | N | % |
| Consistent buying | Everyday | 7 | 1.75 |
| 2–3 times per week | 50 | 12.5 | |
| Once a week | 46 | 11.5 | |
| 2–3 times per month | 148 | 37.0 | |
| once a month | 39 | 9.75 | |
| 2–3 months | 110 | 27.5 | |
| Total | 400 | 100 | |
| Preference Channel | Online | 116 | 29.0 |
| Traditional | 91 | 22.75 | |
| Omni Channel | 197 | 49.25 | |
| Total | 400 | 100 |
Table 4 The reliability and validity results
| Index | Mean | Standard Deviation | Outer Loading | VIF |
| AW1 | 4.382 | 0.669 | 0.998 | 123.849 |
| AW2 | 4.387 | 0.662 | 0.996 | 91.834 |
| AW3 | 4.387 | 0.662 | 0.992 | 30.503 |
| BA1 | 3.877 | 0.431 | 0.934 | 2.465 |
| BA2 | 3.897 | 0.419 | 0.948 | 2.465 |
| CS1 | 4.096 | 0.388 | 0.875 | 1.470 |
| CS2 | 4.020 | 0.305 | 0.894 | 1.470 |
| MK Info1 | 2.792 | 0.974 | 0.833 | 1.752 |
| MK Info2 | 3.002 | 0.943 | 0.951 | 1.770 |
| MK Info3 | 3.203 | 0.91 | 0.549 | 1.305 |
| MKT1 | 3.706 | 0.596 | 0.397 | 1.122 |
| MKT2 | 4.130 | 0.704 | 0.812 | 1.580 |
| MKT3 | 4.086 | 0.707 | 0.769 | 1.395 |
| MKT4 | 4.150 | 0.76 | 0.842 | 1.663 |
| PH1 | 3.944 | 0.401 | 0.975 | 8.466 |
| PH2 | 3.897 | 0.442 | 0.927 | 3.992 |
| PH3 | 3.922 | 0.419 | 0.950 | 5.671 |
| RT1 | 3.841 | 0.858 | 0.766 | 1.847 |
| RT2 | 3.902 | 0.891 | 0.776 | 1.893 |
| RT3 | 4.005 | 0.786 | 0.849 | 32.156 |
| RT4 | 4.015 | 0.786 | 0.855 | 32.533 |
| SOI1 | 2.801 | 0.925 | 0.871 | 1.620 |
| SOI2 | 3.172 | 0.810 | 0.904 | 1.968 |
| SOI3 | 3.118 | 1.003 | 0.627 | 1.393 |
| TR1 | 4.387 | 0.666 | 0.994 | 41.622 |
| TR2 | 4.385 | 0.669 | 0.995 | 46.691 |
| TR3 | 4.370 | 0.706 | 0.992 | 29.989 |
| eWOM1 | 3.833 | 0.870 | 0.825 | 1.772 |
| eWOM2 | 3.900 | 0.892 | 0.832 | 1.789 |
| eWOM3 | 4.007 | 0.781 | 0.759 | 1.226 |
Table 5 Construct reliability and validity
| Cronbach’s | Composite | Average Variance | ||
| Item | Alpha | Reliability | Extracted (AVE) | |
| Construct | Code | (0.70) | (0.70) | ( 0.50) |
| Awareness | AW | 0.995 | 0.997 | 0.990 |
| Consideration | CS | 0.723 | 0.878 | 0.783 |
| Purchase | PH | 0.946 | 0.966 | 0.903 |
| Retention | RT | 0.827 | 0.886 | 0.660 |
| Brand Advocacy | BA | 0.871 | 0.939 | 0.885 |
| Market Info | MK INFO | 0.752 | 0.832 | 0.633 |
| Marketing Campaign | MKT | 0.701 | 0.809 | 0.529 |
| Social Influencer | SO | 0.751 | 0.848 | 0.656 |
| e-Word of mouth | eWOM | 0.730 | 0.848 | 0.650 |
| Trust | TR | 0.994 | 0.996 | 0.988 |
Table 6 Discriminant validity
| Item | ||||||||||
| Code | AW | BA | CS | MK INFO | MKT | PH | RT | SO | TR | eWOM |
| AW | 0.995 | |||||||||
| BA | 0.065 | 0.941 | ||||||||
| CS | 0.157 | 0.336 | 0.885 | |||||||
| MK | 0.018 | 0.046 | 0.023 | 0.796 | ||||||
| INFO | ||||||||||
| MKT | 0.449 | 0.018 | 0.058 | 0.177 | 0.728 | |||||
| PH | 0.018 | 0.881 | 0.33 | 0.036 | 0.023 | 0.95 | ||||
| RT | 0.27 | 0.069 | 0.081 | 0.173 | 0.417 | 0 | 0.813 | |||
| SO | 0.018 | 0.015 | 0.109 | 0.381 | 0.133 | 0.035 | 0.26 | 0.81 | ||
| TR | 0.993 | 0.088 | 0.169 | 0.022 | 0.448 | 0.044 | 0.272 | 0.015 | 0.994 | |
| eWOM | 0.254 | 0.086 | 0.073 | 0.192 | 0.417 | 0.015 | 0.985 | 0.27 | 0.256 | 0.806 |
Table 7 Structure estimate between constructs
| Path Coefficient | t-Value | p-Values | |||
| Hypotheses | Path | 0.10 | 2.58 | 0.01 | Supported |
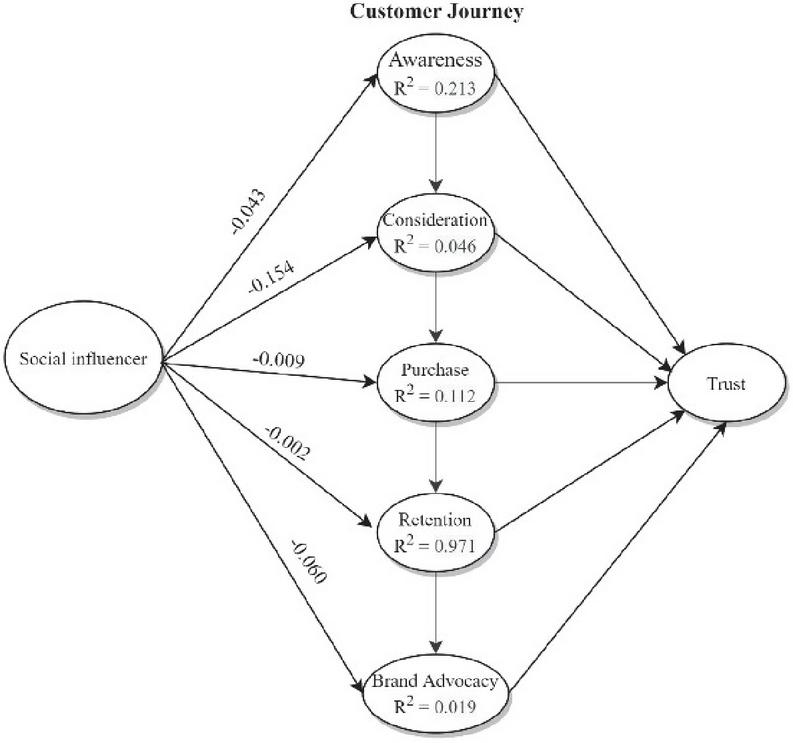
| H1a | SO - AW | -0.043 | 0.832 | 0.406 | No |
| H1b | SO - CS | -0.154 | 2.589 | 0.01 | Yes |
| H1c | SO - PH | -0.009 | 0.159 | 0.874 | No |
| H1d | SO - RT | -0.002 | 0.22 | 0.825 | No |
| H1e | SO - BA | -0.06 | 1.005 | 0.315 | No |
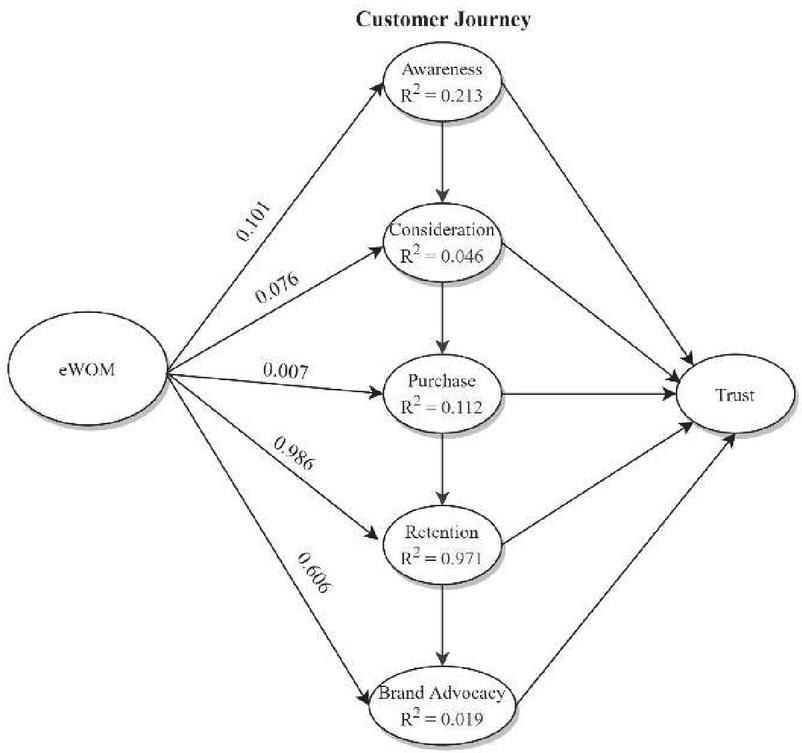
| H2a | eWOM - AW | 0.101 | 1.648 | 0.099 | No |
| H2b | eWOM - CS | 0.076 | 1.209 | 0.227 | No |
| H2c | eWOM - PH | 0.007 | 0.129 | 0.898 | No |
| H2d | eWOM - RT | 0.986 | 150.535 | 0 | Yes |
| H2e | eWOM - BA | 0.606 | 2.215 | 0.027 | Yes |
| H3a | MK INFO - AW | -0.06 | 0.922 | 0.356 | No |
| H3b | MK INFO - CS | 0.07 | 0.788 | 0.431 | No |
| H3c | MK INFO - PH | 0.039 | 0.67 | 0.503 | No |
| H3d | MK INFO - RT | -0.016 | 1.716 | 0.086 | No |
| H3e | MK INFO - BA | 0.044 | 0.686 | 0.493 | No |
| H4a | MKT - AW | 0.423 | 7.253 | 0 | Yes |
| H4b | MKT - CS | -0.035 | 0.63 | 0.528 | No |
| H4c | MKT - PH | -0.05 | 1.014 | 0.311 | No |
| H4d | MKT - RT | 0.008 | 0.7 | 0.484 | No |
| H4e | MKT - BA | -0.022 | 0.409 | 0.683 | No |
| H5 | AW - CS | 0.155 | 2.567 | 0.01 | Yes |
| H6 | CS - PH | 0.331 | 4.369 | 0 | Yes |
| H7 | PH - RT | -0.014 | 1.612 | 0.107 | No |
| H8 | RT - BA | -0.511 | 1.866 | 0.062 | No |
| H9 | AW - TR | 0.991 | 276.013 | 0 | Yes |
| H9 | CS - TR | 0.005 | 0.568 | 0.57 | No |
| H9 | BA - TR | 0.001 | 0.082 | 0.935 | No |
| H9 | PH - TR | 0.024 | 1.554 | 0.12 | No |
| H9 | RT - TR | 0.004 | 0.612 | 0.541 | No |
The data accumulated from 42 questions of factors applying for the Statistics program V.18.0.0 (PASW). We tested acceptable values on “Cronbach’s Alpha that is higher than 0.70” [33] and our variable results were 0.829, which excellently “crossed over the standard criteria”. Later, they were retested with a program of SmartPLS v.3.2.8 for their reliability and validity of each item and the constructs in this research.
The descriptive statistics were primarily used in testing each item to elucidate the overall values of opinions from the respondents. The means gained were 2.792–4.483, the Standard Deviations (S.D.) were 0.305–1.003. The inferential statistics revealed that every research question item used in the qualitative approach has passed the value loading criteria reflected by the assessment.
All constructs used in the qualitative research have passed the value loading criteria based on “Cronbach’s Alpha evaluation with acceptable value higher than 0.70” [33] at 0.701–0.995. Evaluating the internal consistency calculated from “the Composite Reliability (CR)” with adequate values higher than at 0.809–0.997 The evaluation of the convergent validity calculated from “the Average Variance Extracted (AVE)” was acceptable if higher than 0.50 at 0.529–0.990, as shown in Table 5.
Hypothesis Testing
The program of SmartPLS v.3.2.8 was used in the hypothesis testing through applying Bootstrapping Algorithm to evaluate 5,000 subsamples with the significance level at 0.01 or/and acceptable error values at 1% to find their paths coefficients (), t-value and p-value. The t-value earned higher than 2.58 “higher than 1.96 significance level 1/4 5% *, 2.58 significance level 1% ** and 3.29 significance level 1/4 0:1%”.

The calculation on Goodness of Fit (GoF) with the formula of the square root of the multiplied results between the coefficient of determination (R2) and the Average Variance Extracted(AVE), having the No Fit criteria of less than 0.10, the small criteria were between 0.10 and 0.25, the moderate criteria were between 0.25 and 0.36, and high criteria were higher than 0.36, respectively [34]
The calculation results had high criteria at 0.5481. Therefore, the research model earned GoF at good criteria
6 Discussion & Conclusion
Our research was aims to fill a gap of empirical studies on the online channel in Thailand, where is the online shopping sector valued at $26.2 billion. Because many entrepreneurs have already risen and expanded into the e-commerce market in large numbers over the past five years. The implications of this study show that, we can contribute customer journey theory to prior literature in marketing factor by identifying each stage, what strengthen or weaken for the line. we matched the data from the survey, the sample of the online customer to test the relationship between the revealed behavioral customer journey and the factors that moderate this relationship. Next, we determined the specific dimensions of the customer journey in each step that influence brand trust.
This study support to marketing theory in many points of study , simulate the relationship between external factors and customer journey. This study identifies a correlation between these constructs. This indicates that a causal relationship is the best way to conceptualize the link between the factors [10, 19, 35] (Social influencer, eWom, Market information, and Marketing campaign) and customer journey, in spite of valid arguments for causal effects. The hypotheses were tested using structural equation modeling. Results support 7 of the 9 hypotheses, with a significant relationship between analyzed constructs. The four external factors (Social influencer, eWom, Market information, Marketing campaign) only 1 factor which is not the factors that might contribute to online customer journey at the present because the main phase of customer journey.
From the perspective of business administration, the entrepreneurs must understand customer journey or responsibilities in their industry and try to adapt each type of factor appropriately in their country. The critical management is to understand the diversity of consumer behaviour to reach consumers in the right place, at the right time with the correct communication form. Among the existing research that explores some of the retailer when customer interact with the shop by connecting with feedback and opinions from the factors. In addition, the expert interviews and focus groups guideline shown the detailed structure of which relevant phases the choice of the factors along the journeys.
Acknowledgments
This research was phenomenally successful because participants have biased responded to the questionnaire in each phase of data collection. Gratitude was extended to friends, and colleagues who help promote the questionnaire. Deep thanks to the advisor and co-advisors of Technology of Information System Management Division, Faculty of Engineering, Mahidol University, who advised conducting this research.
Appendix: Questionnaires items
| Construct | Index | Items | Source |
| Social Influencer | SOI1 | Often decide to buy products that celebrities have told | Paswan and Pei (2007) |
| Social Influencer | SOI2 | Often decide to buy products that see the influencer use | Paswan and Pei (2007) |
| Social Influencer | SOI3 | Many products I own are similar to those of my celebrities | Paswan and Pei (2007) |
| e-Word of mouth | eWOM1 | Recommended the brands online pages to lots of people | Park and Kim (2014) |
| e-Word of mouth | eWOM2 | Acquaintance positively to use this brand | Melis et al. (2015) |
| e-Word of mouth | eWOM3 | Perceived subject matter expertise influences interaction choice | Dalla Pozza (2014) |
| Market Info | MK Info1 | Information gathering from the brand | Alba et al. (1997) |
| Market Info | MK Info2 | Feeling to connect the brand | Wolter et al. (2016) |
| Market Info | MK Info3 | The brand has an interesting personality | Aaker (1997) |
| Marketing Campaign | MKT1 | Buy the product from advertising | Park and Kim (2014) |
| Marketing Campaign | MKT2 | Buy the product from promotion | Park and Kim (2014) |
| Marketing Campaign | MKT3 | Like the brand for use campaign | Park and Kim (2014) |
| Marketing Campaign | MKT4 | Prefer to purchase the brand with activities | Park and Kim (2014) |
| Awareness | AW1 | This brand is always easy to remember | Winner and Ferraro (2009) |
| Awareness | AW2 | I know more about the brand | Cornwell et al. (2011) |
| Awareness | AW3 | Quickly recognize the symbol or logo | Buil et al. (2013) |
| Consideration | CS1 | This brand is always easy to fine in any channel | Winner and Ferraro (2009) |
| Consideration | CS2 | This brand has an interesting personality | Aaker (1997) |
| Purchase | PH1 | This is a high-quality brand | Washburn and Plank (2002) |
| Purchase | PH2 | This brand offers good value for the money | Aaker (1997) |
| Purchase | PH3 | Willing to pay the price | Park and Kim (2014) |
| Retention | RT1 | Often buy the brand again without thinking | Paswan and Pei (2007) |
| Retention | RT2 | The brand has compated with lifestyle | Paswan and Pei (2007) |
| Retention | RT3 | Prefer to purchase the brand more than others | Chaudhuri and Ligas (2009) |
| Retention | RT4 | This brand is favorable | Colliander (2011) |
| Brand Advocacy | BA1 | The image of the brand is consistent with how I like to see myself | Boo et al. (2009) |
| Brand Advocacy | BA2 | Like the brand compared to other the same | Foroudi et al. (2014) |
| Trust | TR1 | Seeking relational value use personal channel, rarely switch | Barnes (1994) |
| Trust | TR2 | Feeling trust this brand | Chaudhuri and Holbrook (2001) |
| Trust | TR3 | This brand can be counted on | Chaudhuri and Holbrook (2001) |
References
[1] Chheda, S., E. Duncan, and S. Roggenhofer. Putting Customer Experience at the Heart of Next-Generation Operating Models. 2017 [cited 2020 1 Feb 2020].
[2] Grewal, D. and A.L. Roggeveen, Understanding Retail Experiences and Customer Journey Management. Journal of Retailing, 2020. 96(1): p. 3–8.
[3] Roggeveen, A.L., D. Grewal, and E.B. Schweiger, The DAST Framework for Retail Atmospherics: The Impact of In- and Out-of-Store Retail Journey Touchpoints on the Customer Experience. Journal of Retailing, 2020. 96(1): p. 128–137.
[4] Hughes, S., Growth And Implications Of Social E-Commerce And Group Buying Daily Deal Sites: The Case Of Groupon And Livingsocial. International Business & Economics Research Journal (IBER), 2012. 11.
[5] Yuan, C., J. Kim, and S.J. Kim, Parasocial relationship effects on customer equity in the social media context. Journal of Business Research, 2016. 69.
[6] Zhang, R., G. Li, W. Zhengpei, and H. Wang, Relationship value based on customer equity influences on online group-buying customer loyalty. Journal of Business Research, 2016. 69.
[7] Hu, T.-I. and A. Tracogna, Multichannel customer journeys and their determinants: Evidence from motor insurance. Journal of Retailing and Consumer Services, 2020. 54: p. 102022.
[8] Thomas, T.C., A.M. Epp, and L.L. Price, Journeying Together: Aligning Retailer and Service Provider Roles with Collective Consumer Practices. Journal of Retailing, 2020. 96(1): p. 9–24.
[9] Court, D., D. Elzinga, S. Mulder, and O.J. Vetvik. The consumer decision journey. McMinsey Quarterly 2009 [cited 2020 1 Apr].
[10] Edelman, D.C. and M. Singer, Competing on customer journeys. Harvard Business Review, 2015. 93(11): p. 88–100.
[11] Chanda, U. and S. Das, Multi-stage diffusion dynamics in multiple generation high technology products. The Journal of High Technology Management Research, 2015. 26(1): p. 88–104.
[12] Shulman, J.D., A.T. Coughlan, and R.C. Savaskan, Optimal Restocking Fees and Information Provision in an Integrated Demand-Supply Model of Product Returns. Manufacturing & Service Operations Management, 2009. 11(4): p. 577–594.
[13] Rosenbaum, M.S. and R. Kuntze, The relationship between anomie and unethical retail disposition. Psychology & Marketing, 2003. 20(12): p. 1067–1093.
[14] Leeflang, P.S.H., P.C. Verhoef, P. Dahlström, and T. Freundt, Challenges and solutions for marketing in a digital era. European Management Journal, 2014. 32(1): p. 1–12.
[15] Lee, S. and Y. Yi, “Seize the Deal, or Return It Losing Your Free Gift”: The Effect of a Gift-With-Purchase Promotion on Product Return Intention. Psychology & Marketing, 2017. 34(3): p. 249–263.
[16] Piron, F. and M. Young, Retail borrowing: insights and implications on returning used merchandise. International Journal of Retail & Distribution Management, 2000. 28(1): p. 27–36.
[17] Horsky, D., S. Misra, and P. Nelson, Observed and Unobserved Preference Heterogeneity in Brand-Choice Models. Marketing Science, 2006. 25: p. 322–335.
[18] Chaudhuri, A. and M. Holbrook, The Chain of Effects From Brand Trust and Brand Affect to Brand Performance: The Role of Brand Loyalty. Journal of marketing, 2001. 65: p. 81–93.
[19] Halvorsrud, R., K. Kvale, and A. Følstad, Improving service quality through customer journey analysis. Journal of Service Theory and Practice, 2016. 26: p. 840–867.
[20] Grewal, D., C.-P. Ahlbom, L. Beitelspacher, S. Noble, and J. Nordfält, In-Store Mobile Phone Use and Customer Shopping Behavior: Evidence from the Field. Journal of Marketing, 2018. 82.
[21] Ntioudi, C. Brand Value and Marketing Strategies of Cosmetics Brands in the Greek Market. 2019.
[22] Argo, J.J., D.W. Dahl, and A.C. Morales, Positive Consumer Contagion: Responses to Attractive Others in a Retail Context. Journal of Marketing Research, 2008. 45(6): p. 690–701.
[23] Martin, B.A.S., A Stranger’s Touch: Effects of Accidental Interpersonal Touch on Consumer Evaluations and Shopping Time. Journal of Consumer Research, 2012. 39(1): p. 174–184.
[24] Cole, D.A., E.A. Nick, R.L. Zelkowitz, K.M. Roeder, and T. Spinelli, Online Social Support for Young People: Does It Recapitulate In-person Social Support; Can It Help? Comput Human Behav, 2017. 68: p. 456–464.
[25] Huete-Alcocer, N., A Literature Review of Word of Mouth and Electronic Word of Mouth: Implications for Consumer Behavior. Frontiers in psychology, 2017. 8: p. 1256–1256.
[26] Wagner, G., H. Schramm-Klein, and S. Steinmann, Online retailing across e-channels and e-channel touchpoints: Empirical studies of consumer behavior in the multichannel e-commerce environment. Journal of Business Research, 2020. 107: p. 256–270.
[27] Witell, L., C. Kowalkowski, H. Perks, C. Raddats, M. Schwabe, O. Benedettini, and J. Burton, Characterizing customer experience management in business markets. Journal of Business Research, 2020. 116: p. 420–430.
[28] Hallikainen, H., A. Alamäki, and T. Laukkanen, Individual preferences of digital touchpoints: A latent class analysis. Journal of Retailing and Consumer Services, 2019. 50: p. 386–393.
[29] Yachin, J.M., The ‘customer journey’: Learning from customers in tourism experience encounters. Tourism Management Perspectives, 2018. 28: p. 201–210.
[30] Barwitz, N. and P. Maas, Understanding the Omnichannel Customer Journey: Determinants of Interaction Choice. Journal of Interactive Marketing, 2018. 43: p. 116–133.
[31] Ryu, D.-H., C. Lim, and K.-J. Kim, Development of a service blueprint for the online-to-offline integration in service. Journal of Retailing and Consumer Services, 2020. 54: p. 101944.
[32] Ringle, C.M., S. Wende, and J.-M. Becker. SmartPLS 3. Boenningstedt: SmartPLS GmbH. 2015 [cited 2020].
[33] Hair, J.F.J., G.T.M. Hult, C.M. Ringle, and M. Sarstedt, A Primer on Partial Least Squares Structural Equation Modeling (PLS-SEM). 2nd ed. 2017.
[34] Phaosathianphan, N. and A. Leelasantitham, Understanding the Adoption Factors Influence on the Use of Intelligent Travel Assistant (ITA) for Eco-Tourists: An Extension of the UTAUT. International Journal of Innovation and Technology Management, 2019. 16(08): p. 1950060.
[35] Anderl, E., I. Becker, F. von Wangenheim, and J.H. Schumann, Mapping the customer journey: Lessons learned from graph-based online attribution modeling. International Journal of Research in Marketing, 2016. 33(3): p. 457–474.
Biographies

Laksamon Archawaporn is a Ph.D. student at IT Management Division, Faculty of Engineering, Mahidol University, Bangkok Thailand. Her research interest in consumer digital lifestyle, branding, data analytics and marketing application.
This is her 15th years in Marketing Strategies, with responsibility for design and implement marketing projects and campaigns, including ideation, creation of collaterals, distribution of collaterals in various media and measurement and analysis of impact. She is currently working with several companies in the marketing consultant, brand management and sales stratrgies, to monitor and maximize customer lifetime value strategies ensuring maximum profitability.

Adisorn Leelasantitham received the B.Eng. in Electronics and Telecommunications and M. Eng. in Electrical Engineering from King Mongkut’s University of Technology Thonburi (KMUTT), Thailand, in 1997 and 1999, respectively. He received his PhD degree in Electrical Engineering from Sirindhorn International Institute of Technology (SIIT), Thammasat University, Thailand, in 2005. He is currently the Associate Professor in Technology of Information System Management Program, Faculty of Engineering, Mahidol University, Thailand. His research interests include Applications of Blockchain Technology and Cryptocurrency, e.g. electricity trading platform etc., conceptual models for IT managements, image processing, AI, neural networks, machine learning, IoT platforms, data analytics, chaos systems and healthcare IT. He is a member of the IEEE.
Journal of Web Engineering, Vol. 20_5, 1367–1396.
doi: 10.13052/jwe1540-9589.2056
© 2021 River Publishers