A Novel Processing Model for P300 Brainwaves Detection
Wanus Srimaharaj1 and Roungsan Chaisricharoen2,*
1Department of Information Technology, The International College, Payap University, Thailand
2Computer and Communication Engineering for Capacity Building Research Center, School of Information Technology, Mae Fah Luang University, Thailand
E-mail: Wanus_s@payap.ac.th; Roungsan.cha@mfu.ac.th
*Corresponding Author
Received 10 August 2020; Accepted 17 August 2021; Publication 06 November 2021
Abstract
Event-related potential (ERP) is a distinctive pattern of brain activity that is elicited by the brain’s sensitivity and cognition whereas P300 evoked potential changes in cognitive functions. Since P300 wave is a cognitive response across multiple brain channels correlated between the measured electroencephalogram (EEG) and deviant stimulus in a specific period, it requires a suitable signal processing application for interpretation. Moreover, multiple steps of data processing under neuroscience criteria make the P300 reflection difficult to analyze by common methods. Therefore, this study proposes the processing model for brainwave applications based on P300 peak signal detection in multiple brain channels. This study applies 64 channels ERP datasets throughout bandpass filter in fast Fourier transform (FFT) with the specific ranges of signal processing while ERP averaging is applied as a feature extraction method. Furthermore, the experimental metadata is applied with the filtered P300 peak signals in channel classification via a machine learning method, the Decision Tree. The experimental results indicate the accurate mental reflection of P300 evoked potential in different brain channels with high classification accuracy relying on the contrast condition throughout the original data source averaged across the individual electrodes.
Keywords: Event-related potential, ERP, P300, signal processing, bandpass filter, fast fourier transform, feature extraction, classification, machine learning, decision tree.
1 Introduction
Event-related potential or ERP waveforms are the brain’s response directly resulting from the sensory and cognitive events. In general, it is the same type of electrical physiological response to the stimuli, called stereotyped. This method elicits brain functions without having the body invasion. It is based on neuroscience research on the processes of cognition, emotion, and sensitivity [1–4]. ERPs can be elicited via electroencephalogram or EEG recording. The equal measurement of a signal of ERP is an event-related field (ERF), which is done by recording magnetic fields in the brain, called magnetoencephalography or MEG [5]. Besides, there are sub-types of ERPs which are called evoked potential. It is separated by the responsive time after stimuli. Each evoked potential can be detected in a specific range. Therefore, applying appropriate tools and specific methods for each evoked potential is necessary. P300 or P3 is an evoked potential, a subsection of the ERP component that is presented in the decision-making process. It is considered as the external potential that arises due to the experience linking, not the physical properties of stimulation. However, P300 is thought to reflect the processes involved in evaluating stimulation or classification, called cognitive performance or cognition. Identifying P300 evoked potential determines the learning ability of humans [6]. Generally, it can be interpreted by the oddball paradigm, the psychology research experimental design in which the low probability target list is mixed with the highly unlikely target or standard when recorded by EEG method. ERP techniques have been used to study knowledge and the basis for extensive work on P300 in the past decade. While the neurological precursors of this ERP component are still vague, the repeatability and adaptation of these signals make them a common option for psychological testing in both clinics and laboratories.
Clinical and scientific research often relies on P300 measurements to determine the potential of relevant events, especially in decision-making. Since intellectual disabilities are often associated with modifications in the P300 evoked potential, it can be used as a measure of the effectiveness of various treatments in cognitive function. There are multiple uses for P300 in clinical cases [7]. Its surface has a positive deflection of voltage with latency, delayed between stimulation and response. It is about 250 and 400 milliseconds for adults aged between 20 and 70 years old [8, 9]. The signal is most strongly measured by the parietal lobe electrodes. The presence, size, topography, and time of this signal are often used in clinical cases as a measure of cognitive function in the decision-making process.
Furthermore, P300 is mainly required in the brain–computer interface (BCI) application [10–12] because this waveform can be continuously detected and taken out in response to precise stimuli. The P300 waveform can appear in almost all subjects with slightly different measurement techniques, which may engage in reducing the complexity. The interface design collaborated with P300 reflection increases the usability of system interaction. The speed of the interface depends on how the signal is detected even in the presence of noise. Noise is the negative amplitude whereas the characteristic of the P300 is the positive amplitude of the waveform. Moreover, it has to average the multiple recordings or separate trials into a single trial to interpret the correct ERPs. This processing step and other post-recording steps determine the overall speed and correction of the interface [13].
Although the applications for monitoring and measuring the P300 are continuously developed and diverse, the clinical application underlying neurophysiology and signal processing is too complex [14]. Commercial EEG measurements are typically designed to record nerve impulses or brain signals through electrodes. Basic tools are presented at a low price that serves reliable quality and performance. Since human brainwaves are highly complex and can be interpreted in many ways, there are no tools or methods that have been agreed upon or identified as academic and medical standards. The organization and the company have designed the EEG measuring instrument according to the requirements and unique formats. However, there is still a lack of control systems or software to access brainwaves in different ways. Fortunately, commercial devices are offered in a format that can be applied extensively. Many software packages can be adapted to use with the same device type. Therefore, researchers and developers have to design a method or software, allowing them to create and distribute new research.
Besides MATLAB, which is a general tool for signal and data analysis, OriginLab, GNU Octave, and SciPy are the most popular simulating systems for data analysis. OriginLab and GNU Octave are designed for signal processing through a unique interface, while SciPy is designed as a Python-based application, which causes some interactive limitations, especially the brainwave analysis. The specific tools used to mainly analyze brain waves in the form of EEG and ERP are more appropriate. EEGLAB was designed as a plugin MATLAB. It is considered as the most popular application for brain signal processing due to its various features that meet the requirements in both research publication and medical analysis. EEGLAB provides a one-time collection process along with EEG data averaging for a particular channel of the brain. This plugin relies on a rich array of channels. It also has the function of data visualization. The data visualization consists of scalp map scrolling, dipole model planning, and multiple image plotting as the main functions. Besides, it also supports the preprocessing features that comprise the artifacts rejecting, filtering, selecting, and averaging. The existing functions of independent component analysis (ICA) and time domain with frequency decay consist of channels and cross-linking elements. Apart from general features for EEG analysis, it is encouraged by the bootstrap statistical methods based on data sampling. The EEGLAB function is divided into three layers: the upper layer, middle layer, and user interface. The top layer functions allow users to interact with the data processing through the graphical user interface (GUI) without the knowledge in command syntax of MATLAB. The mid-layer function allows users to customize and repeat data processing by using command history. The user interface functions allow the user to customize the operation of EEGLAB. It has an extensive function to support and tutorial information. Nevertheless, this application lacks features that can be accessed with particular brain functions like evoked potential.
The ERPLAB outperforms in ERPs detection. It is an integrated toolbox that is exclusively developed for MATLAB applications [15]. It is widely used in research works that are relevant to human brain signal processing. Nonetheless, ERPLAB interfaces are included in the GUI of EEGLAB. It means that both ERPLAB and EEGLAB can be active in the MATLAB programming environment. This toolbox is extensively used in engineering and science research based on neuroscience due to the complete functions to interpret several evoked potentials. In particular, it has many features that are easy to write simple scripts for beginners, yet it has a more complex function in creating new data processing for advanced users. However, it requires a specific format and steps to implement the research works. As ERP is presented as time-locked signals, knowledge of time-related events and brain activity meanings are necessary for assessing the unique functions of the brain. Although it can be applied for many kinds of ERP analysis, users have to be familiar with the features of the evoked potential.
Since P300 evoked potential is a special peak signal in ERP, users and researchers must know about signal processing under the regulations of neuroscience. This study proposes a model for processing P300 evoked potential focused on fast, simple, and accurate processes. The preprocessing of ERP experiment depends on the psychological method which has to be manipulated by an expert in psychology for avoiding ethical problems. This study applied the open-source datasets from the expert psychologist, Assoc. Prof. Daniel Baker, a senior lecturer at York Biomedical Research Institute (YBRI), the University of York, England [16]. The signal processing relies on fast Fourier transform (FFT) bandpass filtering which is adapted as a raw signal filter. Afterward, trial averaging will be filtered waves to understand the responsive reflection of each channel. Finally, a machine learning method, Decision Tree, will be used to classify the P300 peak signal position on the scalp. The P300 values are presented in a simple format so that different clinical staff can recognize the location of peak signal on scalps and analyze various medical effects accurately.
2 Literature Review
Although the application design can be done based on signal analysis, other relevant theories can improve the accuracy and efficiency of the proposed method. Several theories related to this study are presented as follows.
2.1 Categories of Event-Related Potential
ERP waveforms in the human brain can be divided into two types: early and late waves. The early wave or component occurs at the highest point within the first 100 milliseconds after the stimulation. It is called sensory or exogenous as a physical parameter, which has a stimulating effect on brain wave activity. On the other hand, the late waves generated the later reflection as the characteristics that demonstrate the evaluation of stimuli. It is called cognitive or endogenous. The format of the ERP waveforms can be determined from latency and potential (amplitude) in Figure 1.
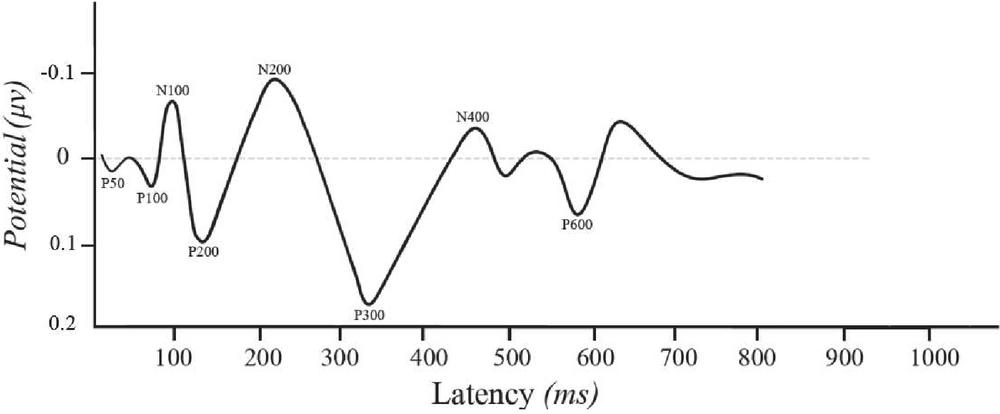
Figure 1 Sample of ERP waveforms.
According to Figure 1, N refers to the negative component, while P is the positive peak signal in microvolt. ERP waveforms can be divided into subsections following the latency (time-lapse in millisecond) of peak signal after stimulus activation, called evoked potential, presented as follows.
2.1.1 P50 wave
This is the earliest event-related potential that occurs at 50 milliseconds after stimuli activation. It has been adapted as a paradigm test of sensory gating, which is an ability to attend to respond or ignore redundant external information for preventing the information overflow issues [17]. P50 appears at the positive peak from 40 to 75 milliseconds [18]. Normally, P50 can be interpreted via the paired click and steady-state paradigm [9].
2.1.2 N100 wave
N100 or N1 wave is activated when an unexpected stimulus is presented. This negative deflecting peak signal occurs from 90 to 200 milliseconds after the stimuli. It is considered as the matching process, which paired the experience with new knowledge. It is also called vertex potential due to the maximum amplitude over Cz or central sulcus of brain position [19].
2.1.3 P200 wave
P200 or P2 amplitude refers to the positive peak signal deflected from the baseline between 100 and 250 milliseconds after activating the stimulus. The latest research work demonstrates that the N1 and P2 wave has a relevant component that reflects the sensitivity of human behavior [9].
2.1.4 N200
N200 or N2 wave is a negative deflection peak signal that appears approximately at 200 milliseconds after stimuli. Besides, there are three sub-components, including N2a, N2b, and N2c. N2a or Mismatch Negativity (MMN) can be obtained via an auditory paradigm for observing the discriminable change [20, 21]. MMN represents the brain’s automatic process involved in the encoding of the stimulus difference or change in the simulation. N2b slightly appears after N2a, which changes the physical task performance in human. N2c is a common N2 that is used only for different stimulus classification.
2.1.5 N300
This peak signal is expected to appear in the collapse time between N200 and N300. Previous research stated that it is an ongoing process in the context of semantic congruity [9].
2.1.6 P300
P300 or P3 wave is the major component for interpreting cognitive performance or learning ability in the human brain. Since it was found by Sutton et al. in 1965 [8], it has been applying in the field of ERP. Generally, auditory stimulation is used for this peak signal. The latency range after stimuli is set between 250 and 400 milliseconds for adults aged between 20 and 70 years old [8, 9]. This stimulus evaluation time reflects the stimulus, whether short or long latency for assessing the cognitive function [22]. Normally, an oddball paradigm, a psychological task, is used to investigate this kind of potential. It presents the sequences of the repetitive stimulus that is interrupted by the deviant stimulus, which is slightly lower and higher than the standard stimulus. To observe how the human brain attends and learns the new information, P300 is the most optimal amplitude dedicated to the interpretation of cognitive performance [23].
2.1.7 N400
N400 is part of the responsiveness in word processing along with other meaningful information such as language signs and understandable pictures [24]. It can appear from 300 to 600 milliseconds after the stimuli [25].
2.1.8 P600
This is the domain of language processing which occurs when the human brain responds to the syntactic violation and structure [5]. It performs grammatical errors and syntactic anomalies [26]. It can be elicited by either hearing or reading at 600 milliseconds after the presentation of a stimulus, approximately.
2.2 Event-Related Potential Processing
There are many ways to deal with EEG signal filtering [27]. Generally, there is no algorithm to manipulate poor quality recorded data; proper recording is mandatorily performed at first measurement. EEG with eight channels is the minimum requirement for optimal channel configuration [28]. However, the implementation of more channels is not entirely solving the signal recording issue. The ERPs-based system consists of three stages of processing, which include preprocessing, feature extraction, and channel classification of P300 evoked potential.
2.2.1 Preprocessing
Preprocessing can be achieved after obtaining the raw data and before extracting brain signal features. It refers to a key step to leave the entire significant information while amplifying EEG signals and simplifying subsequent processing operations [29]. The performance of classifiers depends on the stage of efficient data preprocessing. Signal strengthening can be performed by improving the signal-to-noise ratio (SNR) for the signal quality. The presence of background noise can interrupt the interesting brain patterns into the rest of the signal, which is challenging to detect P300 response and eventually results in a bad or small SNR. On the contrary, a high SNR of the input EEG signal can quickly generate P300 detection and classification.
The bandpass filter is used to eliminate the direct current (DC) bias and high-frequency noise for realizing the high SNR. Researchers sometimes integrate transformation and filtering techniques for removing and abating signal components that are unnecessary for the application [30, 31]. As analog computer (AC) current is generally at 50–60 Hz, which depends on the particular living zone of the globe. The power line effect on EEG can be removed by a notch filter at 50–60 Hz, exact classes of artifacts generate at known frequencies, and cognitive activity usually limits itself in the 3–40 Hz range during the filter setup.
2.2.2 Signal processing
Since ERP appears in the form of time-locked frequency, discrete wavelet transforms (DWT) are one of the most commonly used methods for long-term ERP feature extraction. However, the high-pass filter and the cascade of low-pass filters followed by a high-pass filter are the roles of the wavelet. Due to the requirement of P300 detection, bandpass filtering with trial averaging offers more accurate results than DWT in ERPs interpretation. FFT is a robust algorithm to convert signals from time domains into a frequency domain [32]. It is considered the most critical numerical algorithm [33, 34]. Its popularity is proven in variety of areas such as communication, applications, signal processing, and biomedical engineering [35]. This algorithm provides the basis of signal processing to avoid unwanted or disturbing signals. Signals and noise from recording ERP can be plotted in the form of power-spectrum frequency [36]. However, it can be used to analyze signal records in terms of time series [37].
FFT is considered the best bandpass filter in ERP processing [38]. This method reduces redundancy and calculation time with less complexity. This technique offers an easier and faster process when compared to other popular algorithms such as the discrete Fourier transform [39]. In MATLAB applications, the FFT expression is represented by general parameter calculations [40]. It can provide high accuracy and flexibility, which is suitable for use with application bases [41]. Many research also suggested that 0.1–15 Hz is the most suitable range for bandpass filtering P300 evoked potential [41, 42]. Thus, it is necessary to use a simple bandpass filter to maintain this frequency [43].
2.2.3 Feature extraction
ERP responses have many factors that are smaller than the magnitude of the background in EEG. Accordingly, signal processing methods are used for the identification and characterization of these event-related brain responses to enhance their SNR ratio. All methods have to repeat the interesting events according to the specified range of times. Scalp recordings are divided into epochs, which are in the center of all epoch events. All are average to a single waveform, called time-domain averaging [44, 45]. The received waveform indicates the average scalp potential as a function of time relative to the onset of the event. Latency and morphology are stationary, which is used for the stable ERP process. It will not be affected by the averaging procedure, which results in the bandpass filtering on the scalp channels. It can calculate the cut-off frequencies and signal powers as well as providing accurate filtered data.
2.2.4 Channel classification
Many approaches can be used to extract the features of brain signals. The channel classification is related to P300 evoked potential detection. A classification step is a process to identify the affected channels. The classifier can be applied as either an unsupervised or supervised algorithm. The feature vectors are labeled as target and non-target before classifying the P300, especially in BCI cases [31]. On the other hand, the feature vectors consistent with known stimuli are applied to an unsupervised classifier during the classification process. The trained classifier distinguishes the best brain response that resembles a target stimulus from the non-target stimulus. The classifier can detect the letter with a maximum probability in the case of a P300 Speller [46].
In feature extraction, numerous methods have been employed through several algorithms such as DWT [11], principal component analysis [47], and ICA [48, 49]. The extracted features are used as input for P300 evoked potential identification and classification by using the signal processing application with different classification techniques. Linear discriminant analysis (LDA) is a pattern classification method, which is used in many ERP studies [50]. Stepwise linear discriminant analysis (SWDA) was developed from the LDA classification method by applying only particular features. SWDA was used to classify the ERP by applying individual averages as a 6 6 matrix paradigm [13]. Also, there are some classification methods employing machine learning techniques for P300 detection, such as a support vector machine (SVM) [51]. SVM is beneficial for small data size to provide high throughput at a high transfer rate. Nevertheless, LDA outperforms SVM classifiers if the size of input data is significant in P300 detection [52]. Besides, many BCI groups have trained their study with other classifiers such as linear support vector machine (LSVM), Pearson’s correlation method (PCM), Gaussian support vector machine (GSVM), and Bayesian linear discriminant analysis (BLDA) [53]. A comprehensive comparison of all different features extraction and classification techniques.
Generally, P300 waveform is used for the application in BCI [54]. The optimization of performance in detection methods is associated with the accuracy and several details including speed and resource consumption. It found that the speed of P300 detection depends on a suitable signal processing, which is the feature extraction method. Discrete wavelet transform (DWT) with 6 6 targets and 36 feature vectors provides 7.8 bits per minute and 80% accuracy. Also, it provides 2.3 bits per minute and up to 90% accuracy [55, 56]. Meanwhile, the Genetic algorithm consumes high resources and achieves 34–90% accuracy [57]. Also, BLDA uses a feature vector that is labeled to the class of probability and provides 7 bits per minute with 95% accuracy [58]. The linear discriminant analysis offers almost 100% accuracy in able-bodied subjects and 100% for disabled subjects with 15.9 and 29.3 bits per minute [59, 60]. Besides, the SVM offers faster processing with 96.5% accuracy [61]. Moreover, the data transfer rate takes up to 84.5% accuracy with 84.7 bits per minute [62]. Last but not least, the maximum likelihood applies the thresholds for classes setting that provide 90% accuracy with 4.19 bits per minute [63]. Regarding the performance comparison in previous work [54], these classification methods were applied to the same dataset where the overall classification performance is different in each case of resources. However, each type of evoked potential can appear and relate to different brain channels. It results in the detection of ERP evoked potential with different rules. P300 is a positive voltage peak between 2 and 5 V [64]. Since there are specific ranges of frequency to detect P300 evoke potential, decision-making rules can manage to get the P300 peak signal classification properly. Therefore, Decision Tree, one of the popular classification methods offers the classification result can also be used to identify or predict the unknown class label throughout many types of training methods for decision-making under specific rules [65].
3 Methodology
The procedure of this process relies on the conceptual diagram, shown in Figure 2.
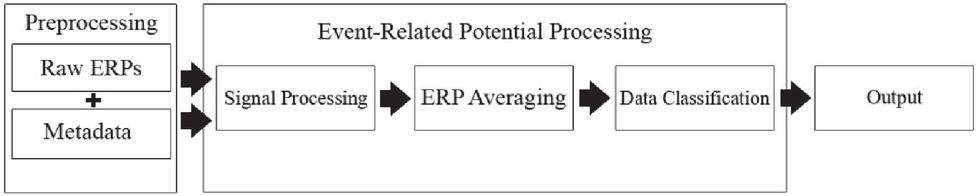
Figure 2 System procedures.
This operation begins with preprocessing that includes raw data and metadata perceiving. The applied dataset will be filtered in the signal processing step. A component of P300 evoked potential will be specified in the feature extraction process. At last, the classification algorithms will be performed as P300 peak signal and brain channel classification.
3.1 Preprocessing
Normally, a psychological expert is required for data collection in preprocessing to avoid ethical problems. This study applies the open-source ERP dataset collected via contrast discrimination for research implementation [16, 66]. ERP raw data were recorded via the WaveGuard cap and ANT Neuroscan EEG system collaborated with 64 electrodes arranged in a 10/20 system. The ground electrode was set to AFz as normally. Data were sampled at 1 kHz using the ASALab software. Stimuli were applied and demonstrated via VIEWPixx 3D display, running in 16-bit luminance resolution with a mean luminance of 51 cd/m and 120 Hz refresh rate throughout the Psychophysics Toolbox in MATLAB application. The display was gamma-corrected using a Minolta LS110 photometer. The data were fitting with 4-parameters with stimulus intensities transformation using the linear inverse function. Samples were in sitting status in a dark room, 57 cm far from the display. The participants followed the instruction and used a mouse to indicate their responses regarding the display. The task was run in five blocks that last for an 8-minute trial throughout 200 trials per target contrast. However, 20 trials with 20,000 milliseconds were used in this study. The sample of the raw dataset is presented in Table 1.
Table 1 Sample of raw dataset
| Time | Signals (V) | ||||||||
| (ms) | Fp1 | Fpz | Fp2 | F7 | F3 | Fz | F4 | : | PO8 |
| 1 | -16620.8 | -19731.6 | -14382.7 | 3720.683 | 2290.548 | -14409.9 | -2767.49 | : | 9042.124 |
| 2 | -16616.8 | -19730.0 | -14375.7 | 3718.292 | 2290.732 | -14407.2 | -2765.19 | : | 9041.370 |
| 3 | -16611.4 | -19724.8 | -14366.2 | 3715.497 | 2290.235 | -14404.2 | -2762.66 | : | 9040.561 |
| 4 | -16608.1 | -19722.3 | -14360.3 | 3720.003 | 2294.594 | -14400.0 | -2761.48 | : | 9039.200 |
| 5 | -16599.8 | -19719.3 | -14353.6 | 3723.993 | 2295.513 | -14400.8 | -2763.72 | : | 9038.280 |
| 6 | -16606.2 | -19721.7 | -14349.6 | 3725.262 | 2294.171 | -14404.3 | -2765.87 | : | 9038.501 |
| 7 | -16615.2 | -19731.5 | -14355.8 | 3724.527 | 2292.902 | -14410.3 | -2769.61 | : | 9041.646 |
| 8 | -16611.9 | -19727.9 | -14361.3 | 3724.269 | 2293.104 | -14412.6 | -2765.29 | : | 9040.304 |
| 9 | -16610.8 | -19729.1 | -14375.2 | 3724.196 | 2293.969 | -14415.4 | -2763.58 | : | 9040.708 |
| 10 | -16610.2 | -19729.1 | -14379.4 | 3725.244 | 2292.148 | -14417.6 | -2763.15 | : | 9038.299 |
| : | : | : | : | : | : | : | : | : | : |
| 19998 | -16928.0 | -19444.9 | -14784.7 | 3843.289 | 2279.496 | -14065.4 | -3000.79 | : | 9135.711 |
| 19999 | -16924.5 | -19440.4 | -14782.8 | 3840.751 | 2283.817 | -14060.4 | -2999.13 | : | 9135.178 |
| 20000 | -16921.6 | -19436.5 | -14778.6 | 3837.956 | 2282.677 | -14053.6 | -2995.68 | : | 9132.823 |
There are pre-frontal (Fp), frontal (F), temporal (T), parietal (P), occipital (O), and central (C). Also, Z (zero) denotes an electrode placed on the midline sagittal plane of the skull including FpZ, Fz, Cz, and Oz. It is usually often defined as grounds or references. Besides, the triggers had been turned out to be zeros and removed in this study due to the rare trigger events during EEG detection.
3.2 Signal Processing
In neuroscience, the human brain signal has bandpass responsiveness properties [67]. It performs frequency passes within a specific range. Generally, it can limit the bandwidth of output signals during the process. The recorded human brain signals will be optimized in cutoff frequencies. It can provide the cutoff frequency by using attenuation values. Analog signals from ERPs are properly filtered through this filter, and provide an output in the digital signal. Since P300 evoked potential can be found in the range of 0.1–15 Hz, low-pass and high-pass filters in discrete wavelet transforms are not appropriate for this study. Therefore, this study applies a bandpass filter in FFT to pass the required frequency. The formula of the FFT bandpass filter is shown in Equation (1).
| (1) |
Where is signal data that is normally presented as complex numbers. is a primitive root of 1. n denotes the number of signal data. However, there are used NlogN for each signal for N size. The bandpass filter can be calculated by Equation (2).
| (2) |
is the raw signal. is the frequency whereas stands for bandpass signal. The value is swapped to make as a real number, shown as Equation (3)
| (3) |
Thus, the bandpass filtered signal can be used in the FFT formula with a specific range. The sample of the filtered signal is shown in Figure 3.
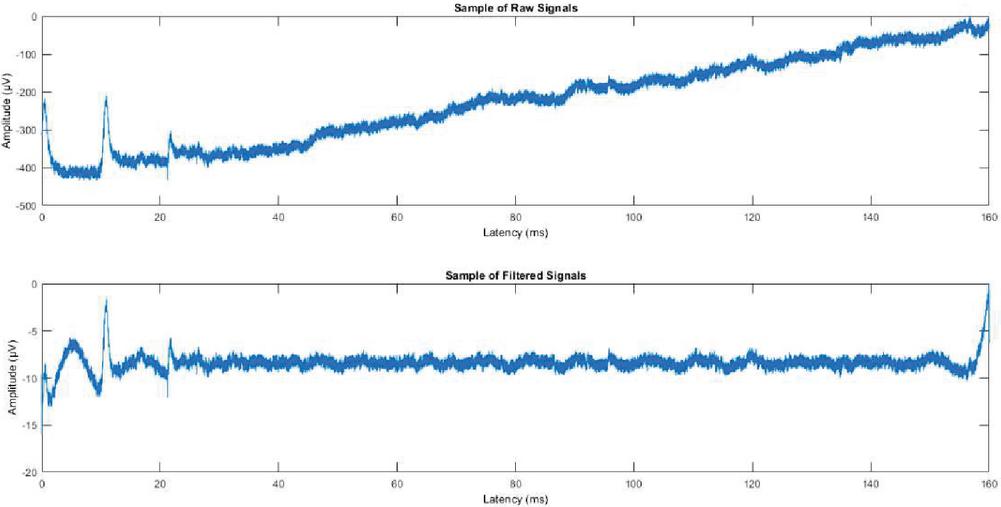
Figure 3 Sample of signal processing.
According to Figure 3, the filtered signals are capped to the specific range which has to be averaged altogether in the feature extraction process.
3.3 Feature Extraction
There are 20,000 milliseconds per single trial for the applied datasets. Consequently, this study has to separate each filtered signal into 20 trials. Averaging process is performed crossing the split group for various channels. Afterward, the averaged signals will be cut off from 20,000 milliseconds to 1000 milliseconds.
To perform the signal averaging in MATLAB, it has to be converted as the mean of matrix rows. All trials will turn into a single trial and one column per channel. Subsequently, the new records are ready for implementation in the channel classification step.
3.4 Channel Classification
P300 evoked response potential can be specified in the frequencies range of positive voltage peak 2–5 V. It has to begin at 250 milliseconds to 400 milliseconds after the post-stimulus. The Decision Tree for decision-making rules can overwhelm the P300 peak signal classification. It requires a training set to predict various unseen examples [68]. Its limitation would be poor accuracy if the training set used to train a new model is too small [69]. It is a top-down tree diagram, which is based on entropy. Entropy measures sample attribute purity, shown in Equation (4).
| (4) |
Where is a sample of training attributes. is a proportion of attribute . Entropy expects the number of bits for attribute classification. It defines the optimal decision attribute by observing all instances within the recursion. Additionally, Information Gain or IG is used for splitting instances [70], shown in Equation (5)
| (5) |
is IG of attribute and instances stands for the set of proportion . is a subset of instances for attribute A with value . It expects entropy reduction by sorting attribute A. This algorithm implements a training set and provides a classification model for a P300 classification by identifying maximum absolute value over multiple channels. Identifying peak signals demonstrate the change in the specific period. The maximum absolute value is used for finding the most significant responsibility for each detected peak signal. The classification rules of the Decision Tree are implemented to define the channel that the maximum absolute value belongs to. It is presented in Table 2.
Table 2 Classification rules
| No. | Descriptions |
| Rule 1 | Maximum absolute value 2 V |
| Rule 2 | Maximum absolute value 5 V |
Precisely, the maximum absolute values will be limited in this amplitude range. The peak signals out of this cap will be dropped during the classification process. Finally, the results will yield the detected P300 peak signal along with the responsive channels relying on electrode positions in metadata.
4 Experimental Results
4.1 Data Processing
The dataset has to be prepared in the specific format as Table 1. The several records of each sample contain 20,000 milliseconds of frequency ranges. The results of one sample throughout the fast Fourier transform bandpass filtering are shown in Table 3.
Table 3 Filtered signals of one sample
| Time | Signals (V) | ||||||||
| (ms) | Fp1 | Fpz | Fp2 | F7 | F3 | Fz | F4 | : | PO8 |
| 1 | 2.422815 | -1.25422 | 2.212070 | -0.53447 | 0.146128 | -1.95701 | 1.594086 | : | -0.79539 |
| 2 | 5.897450 | -4.29197 | 6.815477 | -1.84224 | 0.261544 | -5.63397 | 4.136063 | : | -1.83262 |
| 3 | 8.474314 | -6.47500 | 10.27934 | -2.75953 | 0.359991 | -8.32226 | 5.957122 | : | -2.58841 |
| 4 | 9.840415 | -7.55465 | 12.19317 | -3.18525 | 0.435765 | -9.71388 | 6.859584 | : | -2.97716 |
| 5 | 10.04588 | -7.62819 | 12.59587 | -3.16327 | 0.483357 | -9.90225 | 6.923533 | : | -3.02333 |
| 6 | 9.450054 | -7.06883 | 11.91041 | -2.85337 | 0.498673 | -9.30857 | 6.449523 | : | -2.84195 |
| 7 | 8.562402 | -6.35883 | 10.75372 | -2.46343 | 0.481441 | -8.49499 | 5.825859 | : | -2.58856 |
| 8 | 7.847555 | -5.89834 | 9.704513 | -2.17154 | 0.437293 | -7.94581 | 5.377946 | : | -2.40005 |
| 9 | 7.573540 | -5.86877 | 9.120838 | -2.06891 | 0.377891 | -7.90541 | 5.260952 | : | -2.35012 |
| 10 | 7.757721 | -6.20083 | 9.070525 | -2.14361 | 0.318439 | -8.33163 | 5.434660 | : | -2.43509 |
| 11 | 8.219567 | -6.64968 | 9.384833 | -2.30693 | 0.273317 | -8.96983 | 5.721734 | : | -2.59232 |
| 12 | 8.703793 | -6.93363 | 9.794112 | -2.44650 | 0.251753 | -9.50210 | 5.915172 | : | -2.73948 |
| 13 | 9.011781 | -6.86941 | 10.07566 | -2.48076 | 0.255623 | -9.69890 | 5.882872 | : | -2.81559 |
| 14 | 9.083233 | -6.44520 | 10.14873 | -2.39183 | 0.280522 | -9.50749 | 5.623658 | : | -2.80597 |
| 15 | 8.999242 | -5.80612 | 10.08414 | -2.22538 | 0.319543 | -9.04741 | 5.255325 | : | -2.74227 |
| 16 | 8.917109 | -5.16891 | 10.03893 | -2.06206 | 0.367718 | -8.52784 | 4.947778 | : | -2.68083 |
| 17 | 8.977286 | -4.71336 | 10.15932 | -1.97664 | 0.424590 | -8.13593 | 4.838058 | : | -2.67186 |
| 18 | 9.230970 | -4.50402 | 10.50337 | -2.00494 | 0.493303 | -7.95239 | 4.968686 | : | -2.73489 |
| 19 | 9.621192 | -4.47622 | 11.01854 | -2.13225 | 0.576501 | -7.93129 | 5.275865 | : | -2.85116 |
| 20 | 10.02062 | -4.48654 | 11.57761 | -2.30612 | 0.671250 | -7.94596 | 5.628164 | : | -2.97506 |
| : | : | : | : | : | : | : | : | : | : |
| 19998 | -7.18038 | 7.317671 | -10.4446 | 3.338407 | -0.22461 | 8.325825 | -5.75603 | : | 2.149539 |
| 19999 | -4.74161 | 5.141995 | -7.23109 | 2.311607 | -0.10748 | 5.711787 | -3.83948 | : | 1.388955 |
| 20000 | -1.35372 | 2.105217 | -2.76663 | 0.941538 | 0.02019 | 2.076195 | -1.23960 | : | 0.348376 |
The filtered signals for each channel will be split into 20 separate trials before averaging into a single trial in Table 4.
Table 4 Averaged ERPs of one sample
| Time | Signals (V) | ||||||||
| (ms) | Fp1 | Fpz | Fp2 | F7 | F3 | Fz | F4 | : | PO8 |
| 1 | 0.053941 | -0.04182 | 0.100714 | -0.01108 | 0.051265 | -0.06198 | 0.112290 | : | -0.07872 |
| 2 | 0.256380 | -0.15944 | 0.376365 | -0.08680 | 0.066727 | -0.23168 | 0.228535 | : | -0.13144 |
| 3 | 0.411526 | -0.24466 | 0.584655 | -0.13800 | 0.084036 | -0.35410 | 0.308060 | : | -0.17013 |
| 4 | 0.499925 | -0.28845 | 0.700274 | -0.16040 | 0.102062 | -0.41367 | 0.345862 | : | -0.18893 |
| 5 | 0.520789 | -0.29523 | 0.725962 | -0.15843 | 0.119193 | -0.41465 | 0.349117 | : | -0.18824 |
| 6 | 0.489713 | -0.28025 | 0.688229 | -0.14294 | 0.133370 | -0.37819 | 0.333028 | : | -0.17424 |
| 7 | 0.431382 | -0.26282 | 0.625154 | -0.12658 | 0.142488 | -0.33335 | 0.314189 | : | -0.15619 |
| 8 | 0.370573 | -0.25850 | 0.571597 | -0.11880 | 0.145045 | -0.30591 | 0.304310 | : | -0.14289 |
| 9 | 0.324963 | -0.27331 | 0.547755 | -0.12240 | 0.140744 | -0.30952 | 0.306798 | : | -0.13951 |
| 10 | 0.302031 | -0.30235 | 0.555094 | -0.13304 | 0.130696 | -0.34246 | 0.317274 | : | -0.14621 |
| 11 | 0.300287 | -0.33313 | 0.580248 | -0.14179 | 0.117066 | -0.39079 | 0.327359 | : | -0.15891 |
| 12 | 0.313295 | -0.35174 | 0.604140 | -0.13966 | 0.102279 | -0.43591 | 0.329699 | : | -0.17161 |
| 13 | 0.334137 | -0.34917 | 0.611795 | -0.12207 | 0.088149 | -0.46291 | 0.321845 | : | -0.17930 |
| 14 | 0.358305 | -0.32480 | 0.598610 | -0.09125 | 0.075366 | -0.46612 | 0.307351 | : | -0.18003 |
| 15 | 0.384231 | -0.28590 | 0.570993 | -0.05575 | 0.063599 | -0.44983 | 0.293849 | : | -0.17544 |
| 16 | 0.411984 | -0.24374 | 0.542024 | -0.02712 | 0.052156 | -0.42452 | 0.289261 | : | -0.16965 |
| 17 | 0.441432 | -0.20820 | 0.524855 | -0.01527 | 0.040826 | -0.40093 | 0.298090 | : | -0.16712 |
| 18 | 0.471144 | -0.18379 | 0.527159 | -0.02459 | 0.030441 | -0.38489 | 0.319509 | : | -0.17057 |
| 19 | 0.498540 | -0.16856 | 0.548878 | -0.05229 | 0.022804 | -0.37547 | 0.347994 | : | -0.17984 |
| 20 | 0.520955 | -0.15640 | 0.583649 | -0.08975 | 0.019978 | -0.36673 | 0.375991 | : | -0.19212 |
| : | : | : | : | : | : | : | : | : | : |
| 998 | -0.48809 | 0.294802 | -0.63622 | 0.226379 | 0.023635 | 0.429710 | -0.26051 | : | 0.061062 |
| 999 | -0.35300 | 0.207059 | -0.45559 | 0.161241 | 0.029111 | 0.307681 | -0.15577 | : | 0.027110 |
| 1000 | -0.16197 | 0.088312 | -0.19493 | 0.077010 | 0.038490 | 0.138992 | -0.02378 | : | -0.02219 |
Consequently, the averaged will be combined with metadata (brain channels) to define the peak signal along with maximum absolute values, presented in Figure 4.
The absolute values of peak signal values will be used in the classification step to define whether it is P300 evoked potential or common attention. The Decision Tree is performed to classify the P300 peak signal as the specific criteria, declared in Table 2. Twenty samples with 20 trials were used as the training set in the machine learning process. The results of the confusion matrix of the proposed method are represented in Table 5.
This classification applies 10-fold cross-validation with an 80/20 ratio of the training set and testing set for performance prediction. There are 1280 instances (64 channels for each sample). The scatter plot of classified results is presented in Figure 5.
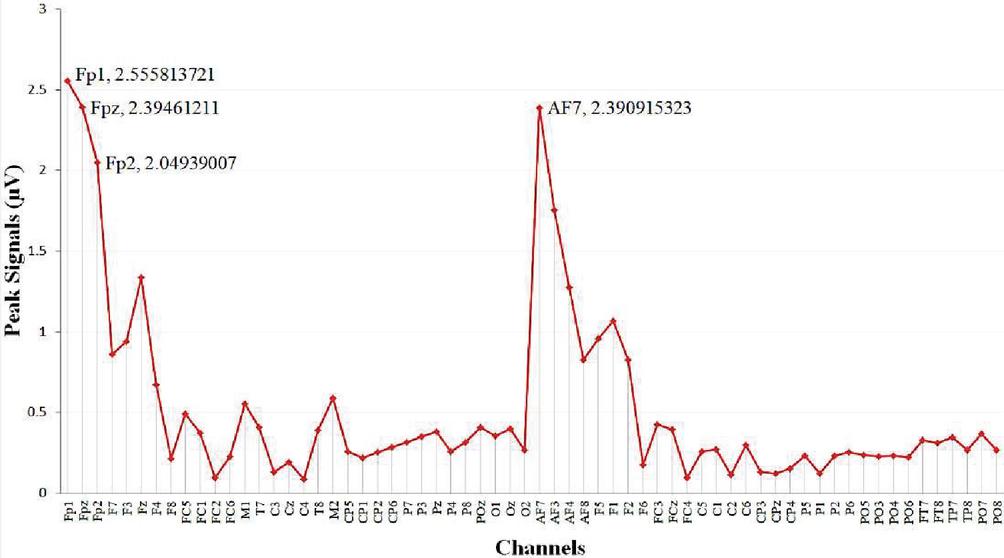
Figure 4 Maximum absolute value of peak signal over brain channels.
Table 5 Confusion matrix of decision tree
| Actual | Actual | Class | Class | |||
| P300 Detected | No | Yes | Precision | Recall | TP Rate | FP Rate |
| No | 1274 | 0 | 99.75% | 100.00% | 100.00% | 66.75% |
| Yes | 4 | 2 | 100.00% | 33.33% | 33.33% | 0.00% |
| Weighted Avg. | 99.75% | 99.75% | 99.75% | 66.45% |
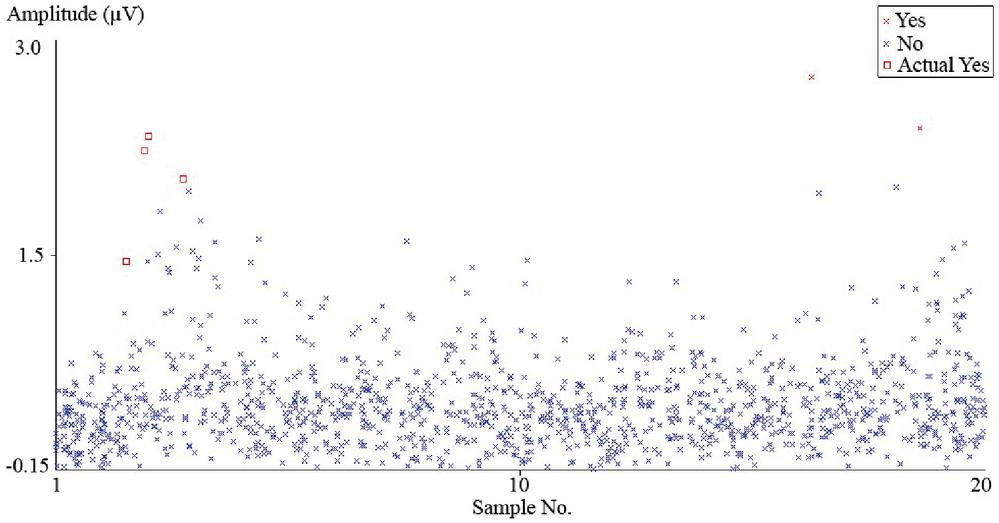
Figure 5 Scatter plot of classified results.
According to Figure 5, four instances were presented as actual yes, which were errors. Corresponding to the reliable classification method, the prepared dataset was classified through the proposed method, and compared with results of other popular methods including Neural Network, Naïve Bayes, and K-nearest Neighbor; shown in Table 6.
Table 6 Comparison of classification results
| Algorithms | Accuracy (%) | Precision | Recall | Execution Time (s) |
| Decision Tree | 99.6875 | 0.997 | 1.00 | 0.03 |
| Neural Network | 99.6875 | 0.997 | 0.997 | 21.97 |
| Naïve Bayes | 99.0625 | 0.997 | 0.991 | 0.01 |
| K-Nearest Neighbor | 99.5313 | 0.995 | 0.995 | 0.01 |
It indicates that the Decision Tree outperforms in this experiment. Although Neural Network provides the same accuracy as Decision Tree, it has lower recall and higher execution time. Therefore, the Decision Tree is the most suitable classification method for this study.
4.2 Results and Discussion
The results of two samples which reflected P300 evoked potential, sample no.17 and no.19 are presented in Tables 7 and 8. The classified detection status is presented by ‘Yes’ and ‘No.’
Table 7 Classification results of sample No.17
| Electrode | P300 Detected |
| Fp1 | No |
| Fpz | Yes |
| Fp2 | No |
| F7 | No |
| F3 | No |
| Fz | No |
| F4 | No |
| F8 | No |
| : | : |
| PO8 | No |
Table 8 Classification results of sample No.19
| Electrode | P300 Detected |
| Fp1 | No |
| Fpz | Yes |
| Fp2 | No |
| F7 | No |
| F3 | No |
| Fz | No |
| F4 | No |
| F8 | No |
| : | : |
| PO8 | No |
According to Tables 7 and 8, Fpz reflected P300 evoked potential in this study. There is only one channel that presented the cognitive performance with high classification accuracy in this experiment. The classification accuracy relies on the contrast condition throughout the sensor space and source space conducted in the original EEG data collection experiment [66]. The classifier accuracy was conducted to average across the individual electrodes which are marked as significant clusters that can be used by clinical staff can apply the results to indicate the learning ability in several medical cases.
5 Conclusion
Although the general tools of ERPs provide adequate results, it requires specific knowledge-based neuroscience for interpretation which is difficult for common clinical staff. An implementation of the proposed processing model provides a simpler and faster process that can be used to assess and identify the cognitive performance of the human brain via P300 evoked potential detection for every clinical staff. Bandpass filter in fast Fourier transform offers appropriate signal processing while ERP averaging accurate the trial investigations in the feature extraction process. Finally, the Decision Tree associated yields the results with high classification accuracy for multiple brain channels that P300 evoked potential appears. In addition, it can be further developed and applied in several applications, especially bioinformatics and neuroscience.
However, P300 only happened in some channels during the experiments [54]. It might be affected by the different stimulus for target or non-target type or varied by individual health [71]. There are no standard or complete applications to define the full features of this waveform [72]. Therefore, studying P300 evoked potential properties and its application have to be developed continuously.
Acknowledgment
This research was supported by Mae Fah Luang University. Also, authors would be grateful to Assoc. Prof. Daniel Baker, a senior lecturer at York Biomedical Research Institute (YBRI), the University of York, England, for his helpful information and suggestions during this study.
References
[1] Hillyard, S. A., & Picton, T. W. (2011). Electrophysiology of cognition. Comprehensive Physiology, 519–584.
[2] Kutas, M., & Dale, A. (1997). Electrical and magnetic readings of mental functions. Cognitive Neuroscience, 53(4), 197–242.
[3] Luck, S. J. (2005). An Introduction to the Event-Related Potential Technique. Cambridge, MA: MIT Press.
[4] Rugg, M. D., & Coles, M. G. (1995). Electrophysiology of mind: Event-related brain potentials and cognition. Oxford University Press.
[5] Osterhout, L., & Holcomb, P. J. (1992). Event-related brain potentials elicited by syntactic anomaly. Journal of Memory and Language, 31(6), 785–806.
[6] Srimaharaj, W., Chaising, S., Sittiprapaporn, P., Temdee, P., & Chaisricharoen, R. (2020). Effective method for identifying student learning ability during classroom focused on cognitive performance. Wireless Personal Communications, 1–18.
[7] Hansenne, M. (2000). Le potentiel évoqué cognitif P300 (II): variabilité interindividuelle et application clinique en psychopathologie. Neurophysiologie Clinique/Clinical Neurophysiology, 30(4), 211–231.
[8] Sutton, S., Braren, M., Zubin, J., & John, E. R. (1965). Evoked-potential correlates of stimulus uncertainty. Science, 150(3700), 1187–1188.
[9] Sur, S., & Sinha, V. K. (2009). Event-related potential: an overview. Industrial Psychiatry Journal, 18(1), 70.
[10] Piccione, F., Giorgi, F., Tonin, P., Priftis, K., Giove, S., Silvoni, S., …& Beverina, F. (2006). P300-based brain computer interface: reliability and performance in healthy and paralysed participants. Clinical Neurophysiology, 117(3), 531–537.
[11] Donchin, E., Spencer, K. M., & Wijesinghe, R. (2000). The mental prosthesis: assessing the speed of a P300-based brain-computer interface. IEEE Transactions on Rehabilitation Engineering, 8(2), 174–179.
[12] Nijboer, F., Sellers, E. W., Mellinger, J., Jordan, M. A., Matuz, T., Furdea, A., …& Wolpaw, J. R. (2008). A P300-based brain–computer interface for people with amyotrophic lateral sclerosis. Clinical Neurophysiology, 119(8), 1909–1916.
[13] Farwell, L. A., & Donchin, E. (1988). Talking off the top of your head: toward a mental prosthesis utilizing event-related brain potentials. Electroencephalography and Clinical Neurophysiology, 70(6), 510–523.
[14] Bricker, S. (2017). The anaesthesia science viva book. Cambridge University Press.
[15] Delorme, A., & Makeig, S. (2004). EEGLAB: an open source toolbox for analysis of single-trial EEG dynamics including independent component analysis. Journal of Neuroscience Methods, 134(1), 9–21.
[16] Baker, D. H. (2019, February 23). Raw ERP data in csv format. Retrieved April 2, 2020, from osf.io/xu87h
[17] Light, G. A., & Braff, D. L. (2003). Sensory gating deficits in schizophrenia: can we parse the effects of medication, nicotine use, and changes in clinical status?. Clinical Neuroscience Research, 3(1–2), 47–54.
[18] Olincy, A., & Martin, L. (2005). Diminished suppression of the P50 auditory evoked potential in bipolar disorder subjects with a history of psychosis. American Journal of Psychiatry, 162(1), 43–49.
[19] Aertsen, A., & Braitenberg, V. (Eds.). (2012). Information processing in the cortex: Experiments and theory. Springer Science & Business Media.
[20] Näätänen, R., & Tiitinen, H. (2014). Auditory information processing as indexed by the mismatch negativity. Advances in Psychological Science Biological and Cognitive Aspects, 2, 145–170.
[21] Winkler, I., Karmos, G., & Näätänen, R. (1996). Adaptive modeling of the unattended acoustic environment reflected in the mismatch negativity event-related potential. Brain Research, 742(1–2), 239–252.
[22] Kügler, C. F. A., Taghavy, A., & Platt, D. (1993). The event-related P300 potential analysis of cognitive human brain aging: a review. Gerontology, 39(5), 280–303.
[23] Pavarini, S. C. I., Brigola, A. G., Luchesi, B. M., Souza, É. N., Rossetti, E. S., Fraga, F. J., …& Pedroso, R. V. (2018). On the use of the P300 as a tool for cognitive processing assessment in healthy aging: a review. Dementia & Neuropsychologia, 12(1), 1–11.
[24] Kutas, M., & Federmeier, K. D. (2000). Electrophysiology reveals semantic memory use in language comprehension. Trends in Cognitive Sciences, 4(12), 463–470.
[25] Kutas, M, Lindamood, T, & Hillyard. (1984). Word probability and event related potentials during sentence processing. In S. Kornblum & J. Requin (Eds.), Preparatory states and processes. (pp. 217–238). Erlbaum.
[26] Brown, C. M., & Hagoort, P. (1999). The cognitive neuroscience of language: challenges and future directions. The Neurocognition of Language, 3–14.
[27] Herman, P., Prasad, G., McGinnity, T. M., & Coyle, D. (2008). Comparative analysis of spectral approaches to feature extraction for EEG-based motor imagery classification. IEEE Transactions on Neural Systems and Rehabilitation Engineering, 16(4), 317–326.
[28] Sannelli, C., Dickhaus, T., Halder, S., Hammer, E. M., Müller, K. R., & Blankertz, B. (2010). On optimal channel configurations for SMR-based brain–computer interfaces. Brain Topography, 23(2), 186–193.
[29] Krusienski, D. J., Sellers, E. W., Cabestaing, F., Bayoudh, S., McFarland, D. J., Vaughan, T. M., & Wolpaw, J. R. (2006). A comparison of classification techniques for the P300 Speller. Journal of Neural Engineering, 3(4), 299.
[30] Azinfar, L., Ravanfar, M., Kim, E., Amiri, S., & Fazel-Rezai, R. (2014). EEG Channel Optimization Based on Differential Evolutionary Algorithm for BCI Application. In Fifth International Brain-Computer Interface Meeting. Pacific Gove, CA.
[31] Fazel-Rezai, R., & Ramanna, S. (2005, August). Brain signals: Feature extraction and classification using rough set methods. In International Workshop on Rough Sets, Fuzzy Sets, Data Mining, and Granular-Soft Computing (pp. 709–718). Springer, Berlin, Heidelberg.
[32] Heideman, M. T., Johnson, D. H., & Burrus, C. S. (1985). Gauss and the history of the fast Fourier transform. Archive for History of Exact Sciences, 34(3), 265–277.
[33] Strang, G. (May–June 1994). Wavelets. American Scientist. 82(3), 250–255. JSTOR 29775194.
[34] Kent, R. D. & Read, C. (2002). Acoustic Analysis of Speech. ISBN 0-7693-0112-6. ISBN 978-0-7693-0112-9.
[35] Brigham, E. O., & Morrow, R. E. (1967). The fast Fourier transform. IEEE Spectrum, 4(12), 63–70.
[36] Cerna, M., & Harvey, A. F. (2000). The fundamentals of FFT-based signal analysis and measurement. National Instruments, Junho, 54.
[37] Gribble, P. (2018). Signals, sampling and filtering Scientific Computing Fall, 1–16.
[38] Štìbeták, J. (2013). Analytic methods and workflows for EEG/ERP domain: technical report number: DCSE/TR-2013-02.
[39] Schatzman, J. C. (1996). Accuracy of the discrete Fourier transform and the fast Fourier transform. SIAM Journal on Scientific Computing, 17(5), 1150–1166.
[40] Rao, K. R., Kim, D. N., & Hwang, J. J. (2011). Fast Fourier transform-algorithms and applications. Springer Science & Business Media.
[41] Bougrain, L., Saavedra, C., & Ranta, R. (2012). Finally, what is the best filter for P300 detection?.
[42] De Paolis, L. T., Bourdot, P., & Mongelli, A. (2017, April). Augmented reality, virtual reality, and computer graphics. In 4th International Conference, AVR 2017, Ugento, June 12–15, 2017, Proceedings Springer.
[43] Jaswal, R. (2016). Brain wave classification and feature extraction of EEG signal by using FFT on Lab View. International Research Journal On Engineering and Technology, 3(7), 1208–1212.
[44] Duncan-Johnson, C. C., & Donchin, E. (1982). The P300 component of the event-related brain potential as an index of information processing. Biological Psychology, 14(1–2), 1–52.
[45] Gonsalvez, C. J., & Polich, J. (2002). P300 amplitude is determined by target-to-target interval. Psychophysiology, 39(3), 388–396.
[46] Fazel-Rezai, R., Allison, B. Z., Guger, C., Sellers, E. W., Kleih, S. C., & Kübler, A. (2012). P300 brain computer interface: current challenges and emerging trends. Frontiers in Neuroengineering, 5, 14.
[47] McGillem, C. D., & Aunon, J. I. (1977). Measurements of signal components in single visualy evoked brain potentials. IEEE Transactions on Biomedical Engineering, (3), 232–241.
[48] Xu, N., Gao, X., Hong, B., Miao, X., Gao, S., & Yang, F. (2004). BCI competition 2003-data set IIb: enhancing P300 wave detection using ICA-based subspace projections for BCI applications. IEEE Transactions on Biomedical Engineering, 51(6), 1067–1072.
[49] Serby, H., Yom-Tov, E., & Inbar, G. F. (2005). An improved P300-based brain-computer interface. IEEE Transactions on Neural Systems and Rehabilitation Engineering, 13(1), 89–98.
[50] Guger, C., Daban, S., Sellers, E., Holzner, C., Krausz, G., Carabalona, R., …& Edlinger, G. (2009). How many people are able to control a P300-based brain–computer interface (BCI)?. Neuroscience Letters, 462(1), 94–98.
[51] Thulasidas, M., Guan, C., & Wu, J. (2006). Robust classification of EEG signal for brain-computer interface. IEEE Transactions on Neural Systems and Rehabilitation Engineering, 14(1), 24–29.
[52] Mirghasemi, H., Fazel-Rezai, R., & Shamsollahi, M. B. (2006, September). Analysis of P300 classifiers in brain computer interface speller. In 2006 International Conference of the IEEE Engineering in Medicine and Biology Society, 6205–6208. IEEE.
[53] Huang, A., & Zhou, W. (2008). BLDA approach for classifying p300 potential. In 7th Asian-Pacific Conference on Medical and Biological Engineering (pp. 341–343). Springer, Berlin, Heidelberg.
[54] Haider, A., & Fazel-Rezai, R. (2017). Application of P300 event-related potential in brain-computer interface. Event-related Potentials and Evoked Potentials. INTECH, 19–38.
[55] Donchin, E., Spencer, K. M., & Wijesinghe, R. (2000). The mental prosthesis: assessing the speed of a P300-based brain-computer interface. IEEE Transactions on Rehabilitation Engineering, 8(2), 174–179.
[56] Farwell, L. A., & Donchin, E. (1988). Talking off the top of your head: toward a mental prosthesis utilizing event-related brain potentials. Electroencephalography and Clinical Neurophysiology, 70(6), 510–523.
[57] Dal Seno, B., Matteucci, M., & Mainardi, L. (2010). Online detection of P300 and error potentials in a BCI speller. Computational Intelligence and Neuroscience, 2010.
[58] Pires, G., Castelo-Branco, M., & Nunes, U. (2008, August). Visual P300-based BCI to steer a wheelchair: a Bayesian approach. In 2008 30th Annual International Conference of the IEEE Engineering in Medicine and Biology Society, 658–661. IEEE.
[59] Hoffmann, U., Yazdani, A., Vesin, J. M., & Ebrahimi, T. (2008, August). Bayesian feature selection applied in a P300 brain-computer interface. In 2008 16th European Signal Processing Conference, 1–5. IEEE.
[60] Rakotomamonjy, A., & Guigue, V. (2008). BCI competition III: dataset II-ensemble of SVMs for BCI P300 speller. IEEE Transactions on Biomedical Engineering, 55(3), 1147–1154.
[61] Garrett, D., Peterson, D. A., Anderson, C. W., & Thaut, M. H. (2003). Comparison of linear, nonlinear, and feature selection methods for EEG signal classification. IEEE Transactions on Neural Systems and Rehabilitation Engineering, 11(2), 141–144.
[62] Kaper, M., Meinicke, P., Grossekathoefer, U., Lingner, T., & Ritter, H. (2004). BCI competition 2003-data set IIb: support vector machines for the P300 speller paradigm. IEEE Transactions on Biomedical Engineering, 51(6), 1073–1076.
[63] Serby, H., Yom-Tov, E., & Inbar, G. F. (2005). An improved P300-based brain-computer interface. IEEE Transactions on Neural Systems and Rehabilitation Engineering, 13(1), 89–98.
[64] Ekanayake, H. (2010). P300 and Emotiv EPOC: Does Emotiv EPOC capture real EEG (2010). Web publication.
[65] Fazel-Rezai, R., Amiri, S., Rabbi, A., & Azinfar, L. (2013). A Review of P300, SSVEP, and Hybrid P300/SSVEP Brain-Computer Interface Systems.
[66] Vilidaite, G., Marsh, E., & Baker, D. H. (2019). Internal noise in contrast discrimination propagates forwards from early visual cortex. Neuroimage, 191, 503–517.
[67] De Ridder, D., Manning, P., Leong, S. L., Ross, S., Sutherland, W., Horwath, C., & Vanneste, S. (2016). The brain, obesity and addiction: an EEG neuroimaging study. Scientific Reports, 6, 34122.
[68] Rokach, L., & Maimon, O. Z. (2008). Data mining with decision trees: theory and applications. World scientific, 69, 3–9.
[69] Rokach, L., & Maimon, O. (2005). Decision trees. In Data mining and knowledge discovery handbook, 165–192.
[70] Rokach, L., & Maimon, O. (2014). Data mining with Decision Tree; Series in machine perception and artificial intelligence. World Scientific, 81, 61–62.
[71] Picton, T. W. (1992). The P300 wave of the human event-related potential. Journal of Clinical Neurophysiology, 9(4), 456–479.
[72] Wöhrle, H., Tabie, M., Kim, S. K., Kirchner, F., & Kirchner, E. A. (2017). A hybrid FPGA-based system for EEG-and EMG-based online movement prediction. Sensors, 17(7), 1552.
Biographies

Wanus Srimaharaj received Ph.D. in Computer Engineering from Mae Fah Luang University, Thailand. He is currently a lecturer at Payap University, Thailand. His research interests are bioinformatics, neuroscience, brain-computer interface, and machine learning.

Roungsan Chaisricharoen received B.Eng. and M. Eng. in Computer Engineering, and Ph.D. in Electrical and Computer Engineering from King Mongkut’s University of Technology Thonburi. He is currently a lecturer at School of Information Technology, Mae Fah Luang University, Chiang Rai, Thailand. His research interests are analogue circuit and IC design, continuous-time active filter, compensation/optimization techniques, data and computer communication, networking, active inductor simulation, design and analysis of experiments, and computational intelligence.
Journal of Web Engineering, Vol. 20_8, 2545–2570.
doi: 10.13052/jwe1540-9589.20815
© 2021 River Publishers