A Hybrid Recommendation System Based on the Supply Chain in Social Networks
Abolfazl Zare1, Mohammad Reza Motadel1,* and Aliakbar Jalali2
1Department of Management, Central Tehran Branch, Islamic Azad University, Tehran, Iran
2Department of Computer Science, University of Maryland, Maryland, USA
E-mail: Zare.Phd@Gmail.com; Dr.Motadel@Gmail.com; DrJalali@UMD.Edu
*Corresponding Author
Received 15 August 2021; Accepted 02 December 2021; Publication 12 February 2022
Abstract
With the expansion of virtual social networks, finding and recommending appropriate and favorite information and items to users is one of the severe issues in their development. To this end, recommender systems predict and recommend interests based on past behavior reviews and user preferences. However, less research has been done on people to people in social networks, and it is still based on exploring communication and friendship circles, which is generally not desirable for specialized users. Social networks include a variety of entities such as individuals, businesses, companies, and technical communications that also contain a variety of information related to the supply chain interaction, such as industries, functions, and communications between them and users.
This paper provides a recommendation system framework for recommending people to people in social networks based on supply chain interactions. For this purpose, it has presented five hybrid methods based on artificial neural networks and fuzzy strategies to provide better and more accurate recommendations than basic methods. Eventually, a case study was conducted on the LinkedIn social network to show the improvements in applying this new approach to primary methods. In this regard, seven specific evaluation criteria of recommender systems have been used.
Keywords: Recommendation system, social networks, supply chain, artificial neural network, fuzzy logic.
1 Introduction
The present century is called the era of communication. Large amounts of information are stored exponentially as a potential challenge to find information tailored to users’ needs [1]. The recommendation system has emerged in social networks to solve this problem. RS are effective systems for guiding the user, among the vast array of possible choices, are helpful and favored for the option so that the process is personalized to the same user.
Despite advances in the development of RS, these systems still face potential challenges such as cold start, data dispersion, and scalability [2]. By looking at the research and finding the gap analysis, we found that few studies were conducted on people’s recommendations in social networks. Nowadays, people’s recommendation in social networks is generally base on contact list contacts or friendship circles, which is not a specific recommendation, does not have the necessary efficiency and effectiveness, and is not desirable by many users. Because these recommendations are generally superficial, while much deeper recommendations can be made about more severe issues such as supply chain communication. The rapid growth of users and the increasing amount of information social networks collect about their users have made them less capable of matching people. In addition to the basic methods of RS like CF, little attention has been paid to human relationships and the hierarchy of individuals and their associated needs. Specialized social networks are a complex environment of companies, individuals, and other entities in different industries and functions. In the reviewed studies of RS, particular attention did not recommend individuals to individuals concerning supply chain interactions.
This paper aims to solve the problem for the first time, presents a new framework for RS in social networks based on supply chain interactions. Our goal is to increase the accuracy and efficiency of the social network RS based on supply chains. This framework has introduced several new strategies using artificial neural networks and fuzzy for people recommending, which, also, to engage the supply chain in recommendations, has more efficiency and accuracy than basic methods. LinkedIn’s social network applies to test the hybrid methods presented in this article. For this purpose, five specialized fields related to supply chain use and data related to 1404 users select in a specific area in five random industries and five random functions. Cross-validation was also used to evaluate methods.
For the first time, supply chain interactions have been used to recommend people on social networks to improve the quality and accuracy of recommendations, leading to recommendations in industry and performance related to their activities in the supply chain.
Secondly, several weighted and non-weighted methods have been proposed using different approaches such as neural network and fuzzy theory, which reduce the volume of data and provide more relevant results based on the specific characteristics of individuals in social networks.
This paper has the following two-fold contributions:
1. For the first time, supply chain interactions have been used to recommend people to people on social networks to improve the quality and accuracy of recommendations, which ultimately leads to recommendations in industry and function related to the user activities in the supply chain.
2. Secondly, several weighted and non-weighted methods have been proposed using different approaches such as neural network and fuzzy theory, which reduce the volume of data and provide more relevant results based on the specific characteristics of individuals in social networks.
The paper is structured as follows. In Section 2, Related work is provided on the literature on recommender systems and people-to-people RS, evaluation of RS, and related works done in the field of the fuzzy, artificial neural network, and supply chain with the RS. Section 2. discusses the strategies and hybrid methods used. Results and experiments are presented in Section 4, and, finally, the conclusion and future study are drawn in Section 5.
2 Related Literature and Background
Fuzzy techniques, neural networks, and similarity criteria are all tools that are used in combination in recommendation systems today. These techniques are commonly used to increase the accuracy of recommender methods [3]. In this section, we review some of the literature on these concepts.
2.1 Recommendation Systems
For the first time, the RS was introduced when a word vector-based algorithm was presented for searching amongst textual documents [4]. RS is a type of information filtering system that predicts a user’s ratings or preferences. The underlying principle in recommender algorithms is a certain threshold of dependency between the user and item attributes. RS recommends related items by discovering users’ implicit or explicit interests and preferences [5, 6].
Discovering this relationship can be made with various methods, such as predicting the relationship between users and recommending each user’s favorite items. More precisely, relevance is the most critical operational purpose of the recommender system. Other goals may not be as important as relevance, such as novelty, serendipity, and diversity [7].
Nowadays, many online companies and businesses, such as Amazon, Netflix, Google, and Facebook, use RS to gain a competitive advantage [8]. Cold start, data sparsity, a big data problem, and over-fitting are the main problems with RS [4, 9]. Based on how a recommender system operates, several categories are identified in the literature, most notably: collaborative-filtering, content-base, knowledge-base, and hybrid-base [10, 11]. Other RS available in the literature include constraint-based, case-based, conversational, search-based, critiquing, utility-based, demographic, and ensemble-based [7, 12].
One of the most critical and common issues in recommending people to people on social networks is matching demographic and psychological information of users and their interests while in product recommendation systems that generally use collaborative filtering methods, identifying similar users by purchases behavior [13] uses a baseline Profile Matching method and focuses on the over-recommending popular user’s issue. To overcome this problem, the authors have used a decision tree derived from interactive data between peoples based on collaborative filtering, and they have applied a Success Rate measure to evaluate it.
[14] uses a weighted harmonic mean-based aggregation function strategy to integrate people’s interests on social networks that can a sender initiates interaction by sending a message to a recipient [15] uses an innovative recommendation engine to recommend people based on semantic features such as sentiment, volume, and objectivity extracted from user-generated content. This paper uses a three-dimensional matrix factorization method to overcome the big data problem and Accuracy Success at Rank K (S@K) to evaluate it [16] has developed a neighborhood-based collaborative filtering algorithm to recommend people to people on social networks based on user similarity in terms of both attractiveness and taste called SocialCollab. This algorithm also uses the Success Rate for evaluation.
2.2 RS Evaluation
The proper design of an evaluation system is critical for achieving maximum performance in different recommender algorithms. A wrong evaluation design can lead to a deviation in the precision of the model or algorithm accuracy [17]. Online or offline methods can evaluate RS. In the online system, user reactions are measured according to the given recommendations. In these cases, offline assessments are used with historical datasets. Offline methods are primarily used in researches and experiments for RS evaluations [7].
The most important criterion in evaluating an RS is accuracy, but it often provides a flawed picture of reality. Therefore, precision metrics are undoubtedly important components of evaluation, but many other secondary goals, such as innovation, reliability, coverage, and serendipity, are crucial for the user experience as they have short-term and long-term effects on conversion rates [17].
2.3 Artificial Neural Networks
Artificial neural networks are one of the branches of machine learning in artificial intelligence that was first introduced [18]. The purpose of ANN is to develop machine learning systems based on biological models of the brain, especially the bioelectric activities of brain neurons [19]. An ANN is a signal or information processing system consisting of many simple computational elements that are directly related to each other and are all used in a parallel distributed process for computational tasks [20].
Deep learning is an emerging phenomenon in machine learning that creates powerful models derived from a deep structured neural network. By choosing a suitable nonlinear activation function, the ANN can be used to model complex nonlinear relationships between features and independent variables, identify higher polynomial features, interact with them, and use multiple optimization algorithms [21].
The ANN is one of the methods used by researchers in hybrid RS. The use of ANNs can increase model prediction accuracy and can be used in combination with other methods [22]. [23] first introduced a hybrid recommender system engine based on content profile analysis of users to cluster similar users [21] also presented a hybrid deep learning neural network framework that utilized content features to predict model-based recommenders in business.
2.4 Fuzzy Logic
First, fuzzy logic was introduced in the fuzzy set theory, a generalized standard set theory [24]. In science, uncertainty is an undesirable phenomenon that must be avoided in every way possible. In the past, phenomena were seen as binary, 0, and 1. So a phenomenon was either 0 or 1, and there was no third state [25].
The membership function defines the fuzzy set, a continuous interval range [0, 1]. In the fuzzy set, X is a universal set, each point represented by x. By this definition, fuzzy set A is defined as ordered pairs as Equation (1) and is the membership function of A:
| (1) |
There are several membership functions in the fuzzy theory literature, each of which has its functions and uses. In this paper, a Gaussian function will be used. A Gaussian membership function is determined by c and ; c represents the MFs center, and determines the MFs width (Equation (2)).
| (2) |
Fuzzy theory is one of the methods used in hybrid RS. [26] presented a new fuzzy method to control the uncertainty of natural noise to improve recommendation accuracy. Also, [27] presented a hybrid multi-criteria recommender system by ontology and neuro-fuzzy techniques.
2.5 Supply Chain Management and Social Networks
In the past century, various sociologists explored social networks to describe social activities and organizational behaviors. Social networks are a set of and social relationships among them. Social networks reveal the strengths or weaknesses of communication between two nodes based on the frequency of similarity or relationship between them [28].
Although integrated supply chain with such attitudes and tasks have emerged, the rapid growth of information technology in recent years and its widespread use in SCM have transformed many of the core activities, and paid particular attention to communication technologies is more necessary [29] found a significant relationship between the competency of the supply chain and its agility, which necessitated the use of new technologies. Also, in a study, [30] pointed to the necessity of a direct link between social media and supply chain management [31] also stated that social media use is inevitable to promote the supply chain.
[32] consider creating knowledge networks, balancing speed and contemplation, portable information vaults, replacing collaboration with the community, and building a platform for innovation as the benefits of social networking and supply chain management [33] considered the key to success in the supply chain as the trust between partners and their capabilities and stated that special attention should be paid to social networking in developing the supply chain [34] noted that social media features related to the supply chain include more immediate interactions, greater transparency of decision making, personal and professional growth of employees and managers, more reliable global connectivity, and access to comprehensive information.
Companies are constantly faced with the two severe challenges of finding new customers and providing cheap and quality resources. One of the specialized networks is Linkedin that hosts many different entities, such as individuals, businesses, and companies, and has collected valuable information. Some of the site’s information fields, such as industry, performance, and management level, have been adapted to research and test RS in the social network with a supply chain approach. The site currently has over 774 million users from more than 200 countries. LinkedIn is suitable for this study because LinkedIn has stored the data of millions of users in more than 147 industries and 26 functions.
On the other hand, it was pointed out that these types of fields are directly related to the supply chain. In this article, all the experiments will be done on this network [35]. LinkedIn uses a horizontal collaborative filtering infrastructure for the recommendation, known as browsemaps. The Browsemaps is an item-to-item collaborative filtering platform, where member browsing histories are used to build a latent graph of co-occurrences of entities. Recommendations on LinkedIn are generally based on similarities in profiles [36].
3 Proposed Model
Hybrid models are an advanced type of RS that achieves more accurate and efficient results by combining RS and prediction techniques. This paper presents a novel hybrid model approach for combining underlying RS with fuzzy, ANN, and several other techniques for recommending people in the social network based on supply chain interactions.
Generally, the literature describes the five phases for building an RS: data collection, user profiling, calculation of similarity, neighborhood selection, and eventually, prediction and recommendation [37]. Accordingly, the implementation model of this paper is presented in three phases. In the first phase, supply chain data is collected and pre-processed. In phase II, the methods of calculating similarity and classical strategies are combined with new strategies, and phase three proposes five new hybrid methods, each of which yields user recommendation lists. The accuracy of these lists is evaluated by evaluation methods and compared with each other and with basic methods. In this paper, five attributes related to the supply chain were collected from LinkedIn to test and evaluate the methods. Figure 1 illustrates the research implementation model and related phase to this part.
In this paper, five LinkedIn data fields have been used for recommendation. Industry and Function is the industry of the target user, and Function is the function in which the target user is employed in that field of industry. For example, the target user may be active in the telecommunication industry and sales function. Seniority level, company headcount, and degree of expertise are other features that, together with the above two features, indicate the target user’s position in the supply chain.
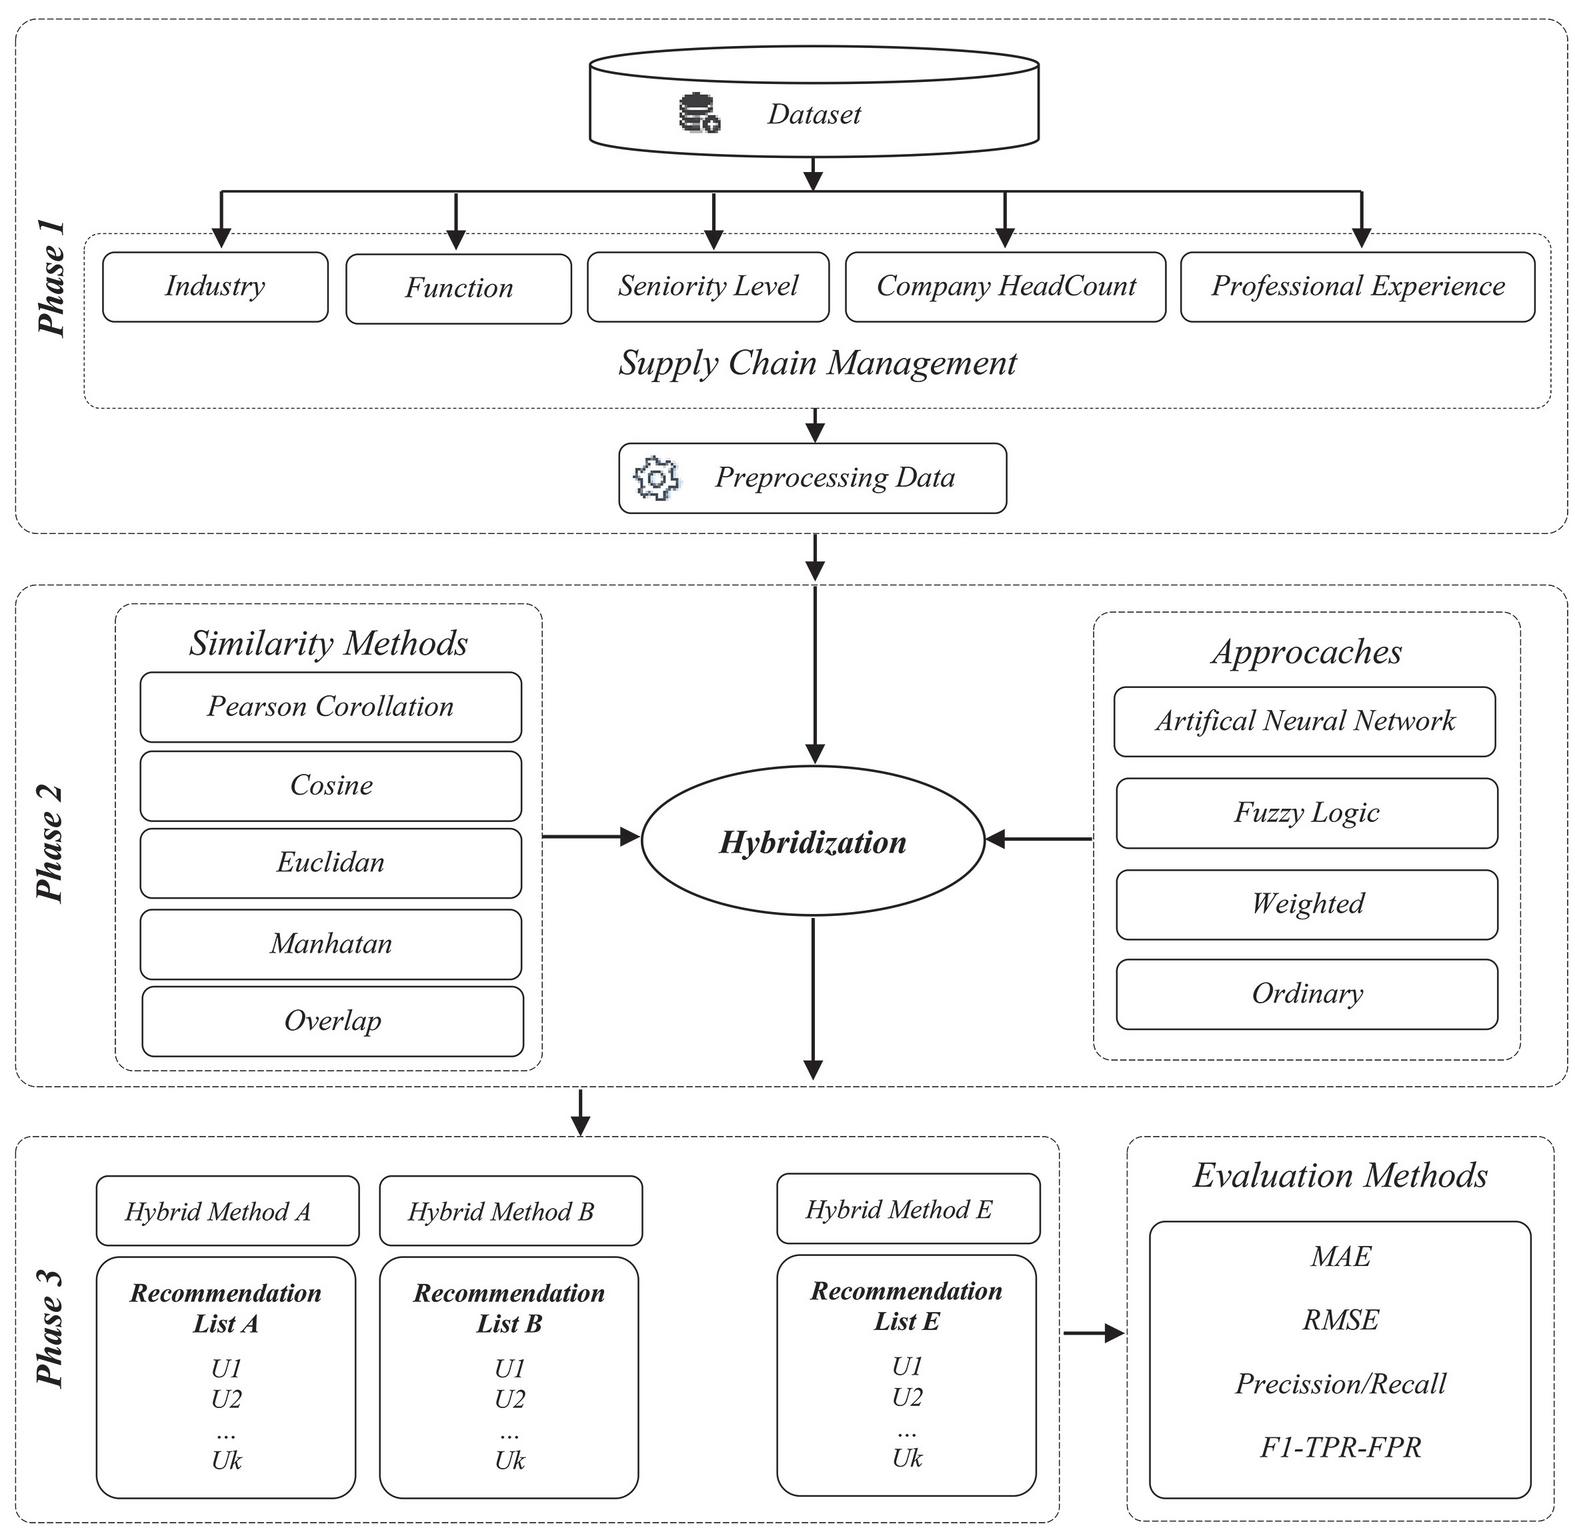
Figure 1 The research implementation model and related phase.
In statistics and related fields, a similarity measure or similarity function is a real-valued function that quantifies the similarity between two objects [38]. Different elements may be involved in calculating and comparing the similarity of two users. In a hybrid model, each user attribute may be calculated in a specific way. In this case, the total of similarity is equal to the algebraic sum of each attribute. The Equation (3) relationship illustrates how the features of the two users of A and B integrate. Here is N the number of features.
| (3) |
It may be necessary for the researcher to influence the similarity of a feature. The above method affects all properties equally. For this reason, a method called weighting was developed that would give each of the similarity features a weight. However, the algebraic sum of all weights is equal to one. In Equation (4) relation is the weight of similarity measure between and .
| (4) |
One of the techniques commonly used in statistics is normalization. In the simplest case of rate normalization, we have different scales of measurement to compare on a single scale. The uniformity of a vector obtains from the subtraction between each element and the smallest vector element divided by the subtraction of the largest and smallest vector elements (Equation (5)).
| (5) |
3.1 RS Similarity Measures
In statistical methods, a similarity criterion is a method to measure the actual degree of similarity between two objects. The similarity measures are close to the ranking of vectors related to the two users [39]. The basis of many similarities and non-similarity criteria is the Euclidean distance. Generally, the distance between two vectors A and B is defined as Equation (6) [40]:
| (6) |
In this respect, and variables are detailed ratings between two users of A and B for a particular item. The Euclidean distance is the second root of the sum of the squares of the difference between the corresponding elements in the two vectors.
There is another commonly used function called the Pearson correlation coefficient as Equation (7). The Pearson correlation coefficient of the two variables is always in between . The more naturally the value of this function tends to 1, the two vectors below are more similar [40]:
| (7) |
Correlation 1 indicates that the data points in the graph are in a straight descending line, and the two variables are precisely negative in linearity. Conversely, output 1 shows that the correlation coefficients of the two variables are linearly positive, and the points are on a straight ascending line. Correlation 0 means that the two variables have no linear relationship with each other.
Another standard criterion and similarity function that is often used in information retrieval literature is the Cosine similarity measure. This function is the point multiplication of two properties, and the Cosine is the angle between two vectors. For two vectors, the angle zero and the value of the function are precisely equal. This value is less than one for other vectors, and the vector angle is between [0,0.5). So the higher the output of the function, the two vectors are more similar. The Cosine function is defined as Equation (8) [40]:
| (8) |
The Manhattan function uses the absolute magnitude of the distance between the components instead of the squared distance between the components and defines as Equation (9).
| (9) |
One of the most common criteria for comparing two categorical fields is the Overlap Measure. In this method, two criteria, if the two fields are in the same category, the value of the similarity function will be equal to one and otherwise equal to zero as Equation (10).
| (10) |
3.2 ANN Approach
The two saved attributes (Industry and Function) at the LinkedIn database are required in supply chain interactions. Each of these industries or functions has equal importance and relevance to itself and has a different degree of relevance to other industries or functions, depending on the type of communication in the supply chain. For example, the Telecommunications weight is one on its graph and 0.55 on the Computer and Software. These weights can be learned from the subject literature or expert opinions. This communication is directional, and therefore the associated matrix is a directed adjacency matrix.
In the ANN strategy, the initial population of the relevant users is selected based on the target user industry and function. The weights obtained from the associated matrix make only the relevant industries and functions selected. These weights are also used to calculate the highest similarity of each user to the target user, and ultimately the recommendations will be entirely relevant and consistent with SCM. The function of the neural network here is to select a related subset of the overall Industries and Functions set that are related to the industry, function, and supply chain of the target user. Therefore, this technique reduces the volume of data.
The ANN used here is a fully connected layer, a perceptron ANN that connects all inputs to all outputs. The input vector is a binary vector in which only the target user industry or function is one, and the other elements are zero. Nevertheless, the output layer is a vector that activates some related industries and functions. The activation function used in this ANN is a hard-limit function where values equal to and higher than the specified threshold are activated. The weights required in this neural network are derived from the corresponding proximity matrix (Figure 2).
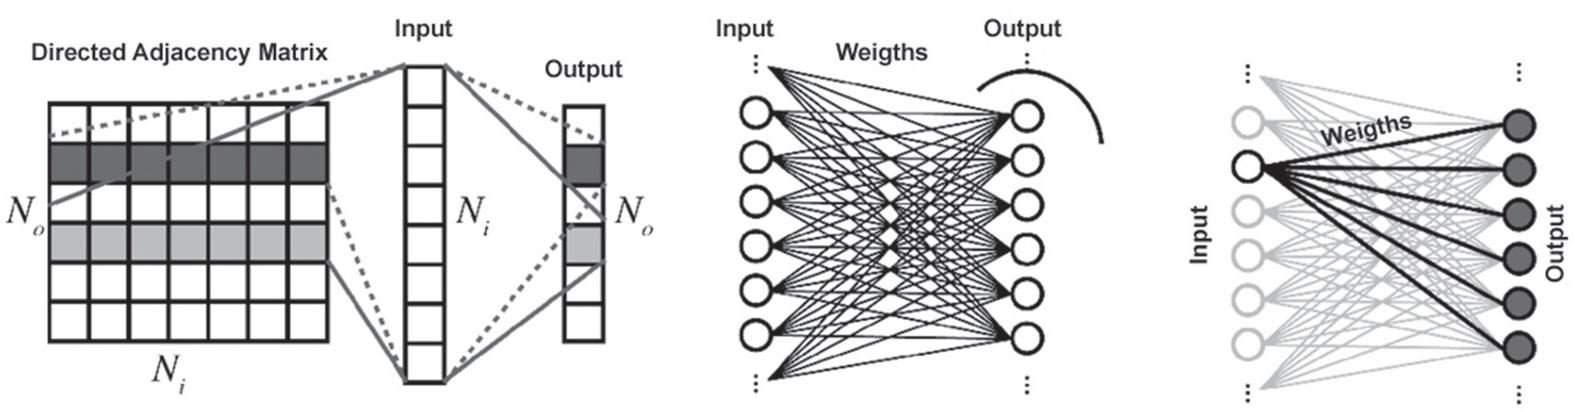
Figure 2 Directed adjacency matrix, weights, and fully-connected neural networks layers.
3.3 Fuzzy Approach
This paper also uses a fuzzy approach to characterize the professional background of individuals in the organization. The months of specialized activity in the company can be shown in fuzzy form. If the overlap measure is used to compare the characteristics of two users in the field, users who are in the vicinity of the target user may be missed.
Dreyfus’s model divides people into five groups, including Novice, Advanced Beginner, Competent, Proficient, and Expert, based on expertise in the organization [41]. Due to the nature of these five categories and their overlap, this paper uses the fuzzy form and Gaussian function [42].
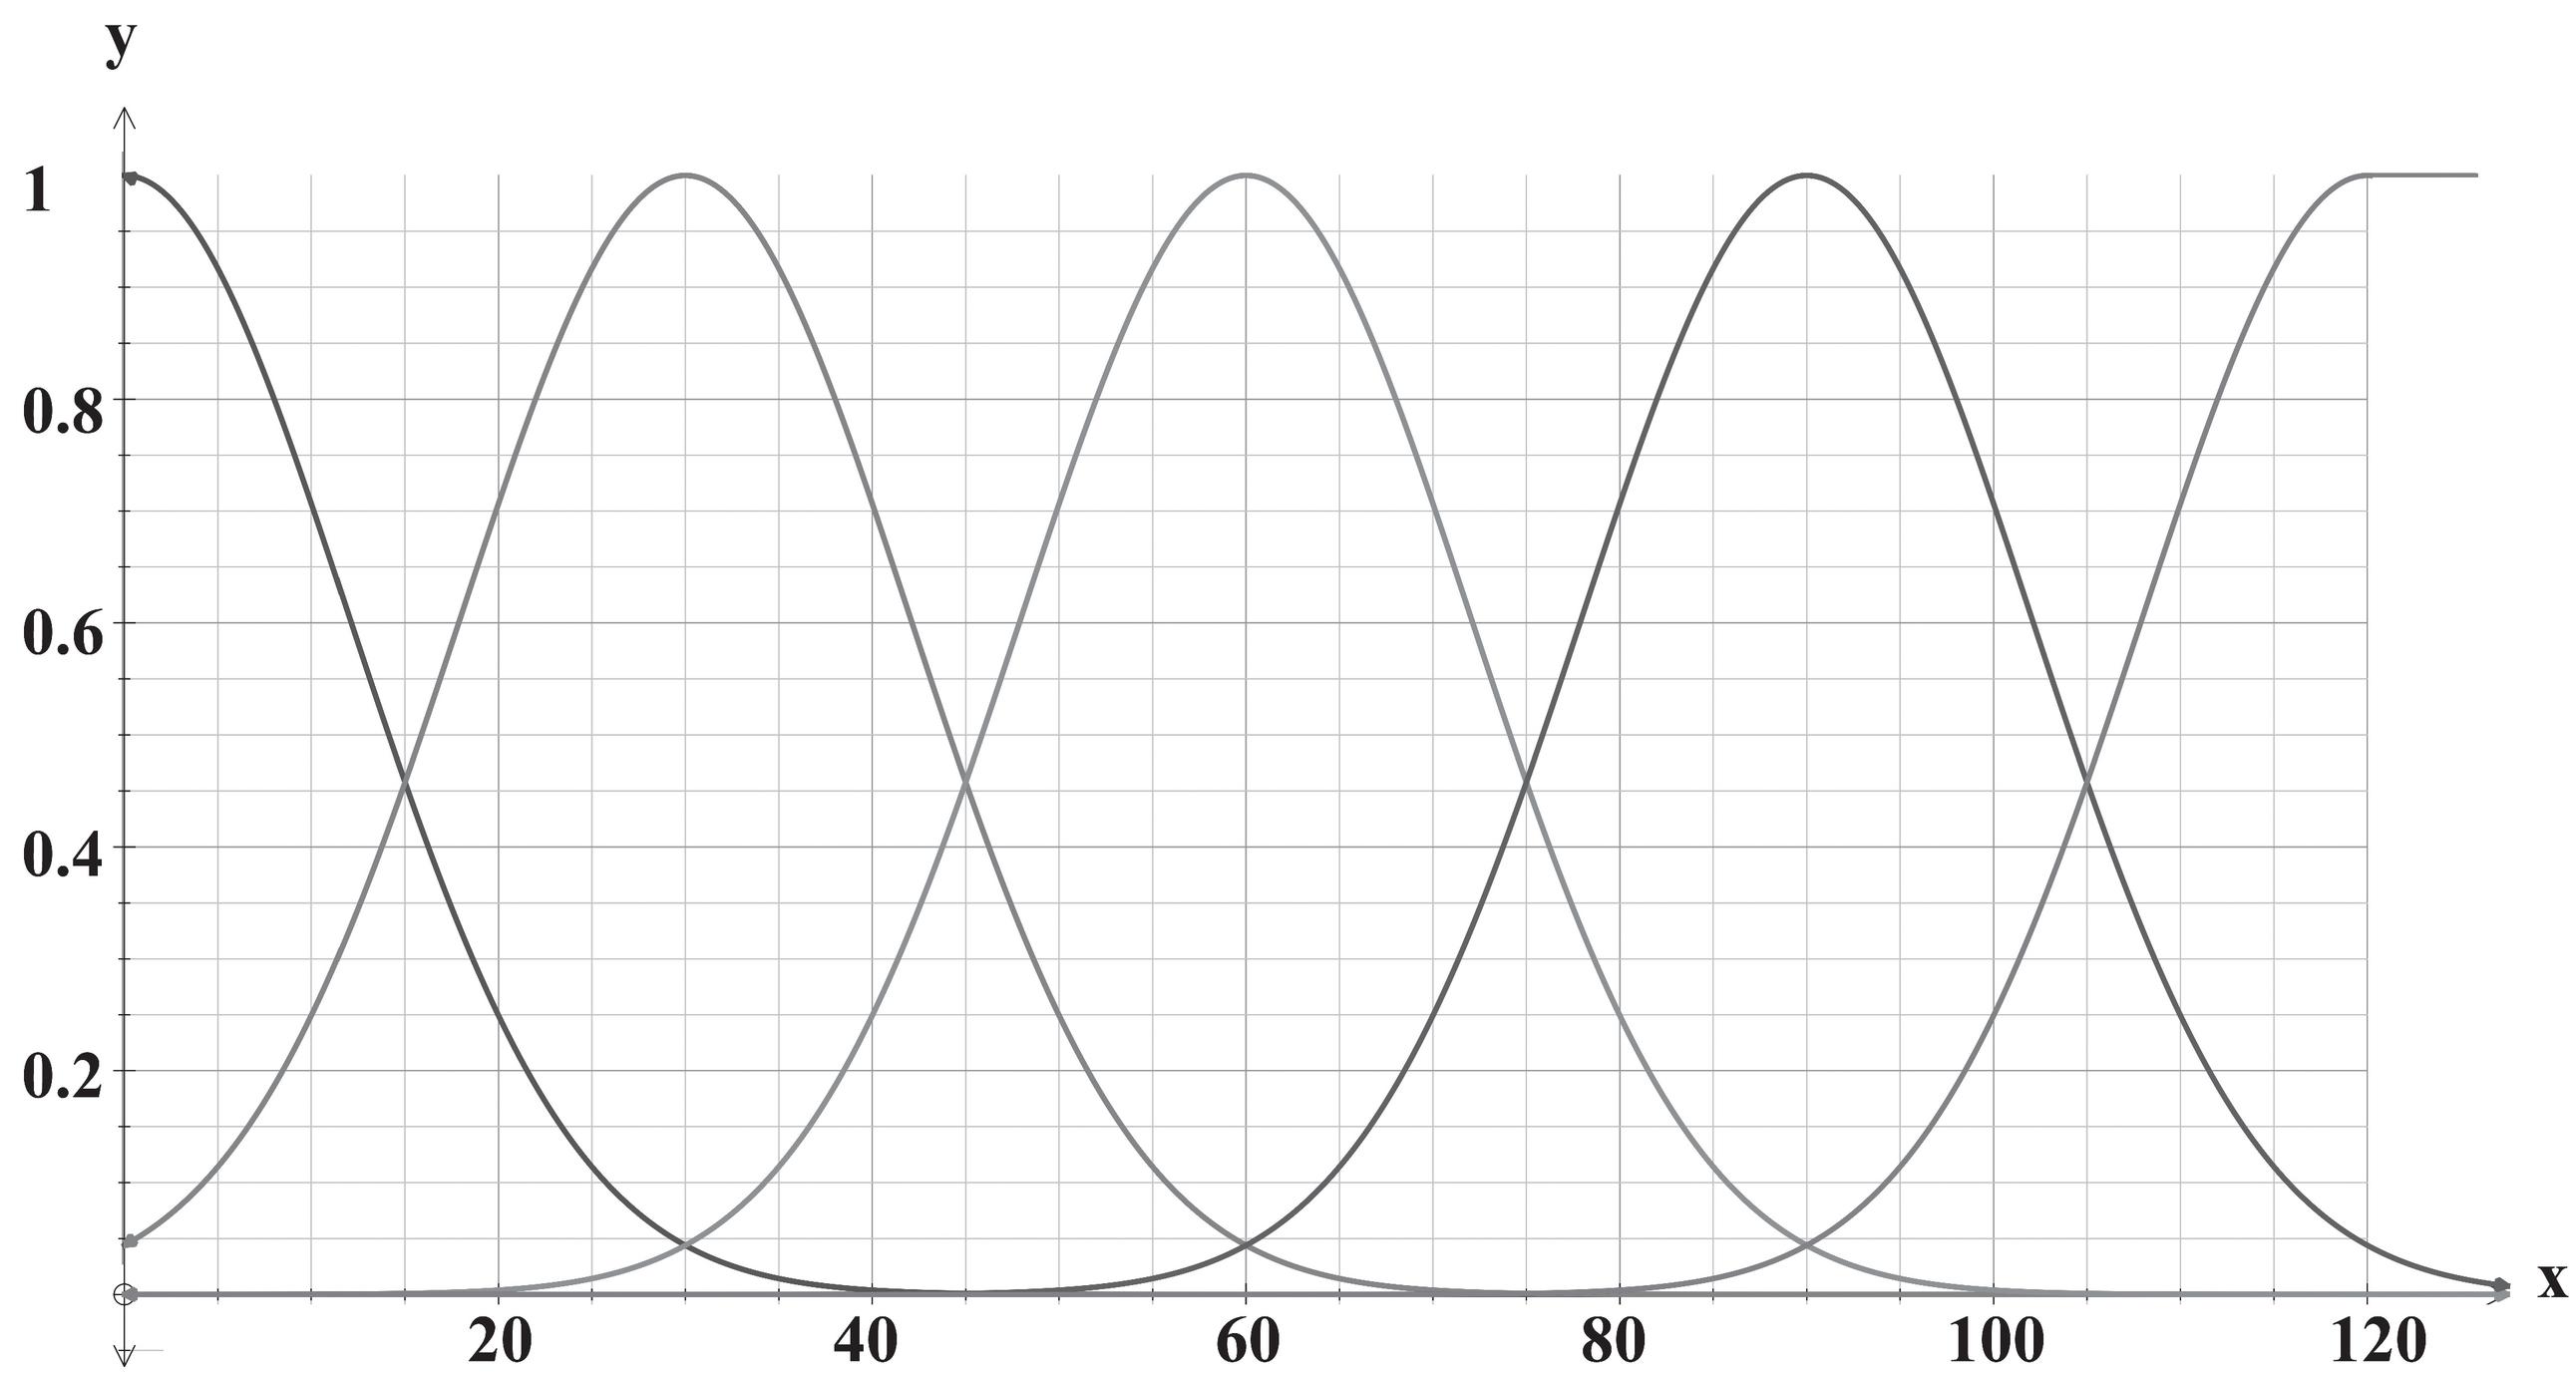
Figure 3 Gaussian membership function plots.
Figure 3 plots show a Gaussian membership function defined by (; , 12) and for professional background field based on five levels. Concerning the five categories considered, the five MF is defined as Equations (11)–(15):
| (11) | |
| (12) | |
| (13) | |
| (14) | |
| (15) |
In these relations, the maximum and minimum amplitude of the Gaussian function is considered to be between 120 and 0, so is considered. Given that each value of this property in each function will have a specific value, the Equation (16) relation is used to represent in a fuzzy form:
| (16) |
There are two fuzzy functions, each with five members, which are five fuzzy values. The distance of two fuzzy values is obtained from the sum of the absolute values of the difference of each of the corresponding elements in the function. Like any other attribute value, the similarity of the two users can be calculated. However, the Manhattan distance is used for this feature in this paper as Equation (17):
| (17) |
Given that a threshold is needed to calculate similarity, the Equation (18) function is used by the overlay strategy:
| (18) |
The larger the value of this function, the higher the similarity of the two users in this feature. This strategy can be applied to both other fields.
3.4 Hybrid Methods
Based on the strategies and methods presented in this paper, five new hybrid methods have been proposed. These methods are labeled Hybrid Method A to E. In addition to these methods, three primary methods, Cosine, Pearson, and Euclidean, will also be tested. All of these methods will be implemented on a LinkedIn dataset. The used evaluation measures are MAE, RMSE, Precision, Recall, TPR, F1, and FPR. Therefore the implementation output of the methods will be an 8 in 7 matrices.
3.4.1 Hybrid method A
In this method, the proposed ANN strategy is first used to reduce the data volume. This approach makes it appropriate to select the primary data related to the target user supply chain. It is also used to calculate the similarity of two industry and function attributes based on ANN weights and proximity matrices. Because of the class nature of the two attributes of the seniority level and company headcount, the overlap measure is used. This method uses the Manhattan measure for the professional experience attribute. Finally, the weighting strategy is used to integrate the similarity functions of each of these five properties. The weights of industry, function, seniority level, company headcount, and degree of expertise fields are, respectively, 0.4, 0.2, 0.1, 0.1, and 0.2, according to experts. These weights have been obtained before the opinions of ten experts in this field. The average opinions of all experts have been used as the final weight. Equation (19) relation shows the cumulative function of the similarity functions of this hybrid method:
| (19) |
3.4.2 Hybrid method B
In this method, the overlap is used for all four industry, function, seniority level, and company headcount attributes. The fuzzy strategy is used to professional experience attribute. The cumulative function of this method is also a weighted function, and the weights are the same as in the previous part as Equation (20):
| (20) |
3.4.3 Hybrid method C
The C hybrid method uses the ANN approach to calculate the similarity of industry and function attributes of two users, and the OM method is used to calculate the similarity of seniority level and company headcount. The proposed fuzzy strategy is used to calculate the similarity of two users in the professional experience attribute. The weighting strategy is used to calculate the overall similarity and the cumulative relationship is as Equation (21):
| (21) |
3.4.4 Hybrid method D
In the D hybrid method, the presented neural network approach is used to calculate the similarity of industry and function fields of two users. The overlap measure is used to calculate the degree of similarity of seniority level and company headcount of the two users, and the proposed fuzzy approach is used to calculate the similarity of professional experience attribute.
Since the weighting method was presented in the previous section, the weighting strategy is not used to allow comparison, and the general relation of this method is as Equation (22):
| (22) |
3.4.5 Hybrid method E
In this method, the proposed ANN approach is used to calculate the similarity of industry and function fields between two users. The overlap measure is also used to calculate the similarity of seniority level and company headcount. Finally, the Manhattan distance is used to calculate the similarity for the professional experience attribute.
This method does not use the weighting approach to compare the weighting effect with other methods. The cumulative relation of similarity criteria to obtain the total similarity criterion is as Equation (23):
| (23) |
4 Experiments and Results
4.1 Dataset
A dataset is required to test and evaluate the proposed hybrid methods. For this purpose, five specialized features related to users were collected from the LinkedIn social network with data collection tools. There were 1404 users, 9891 interest titles, and 3336 like records within a specified geographical area.
4.2 Evaluation Metrics
Error metrics are widely used to predict accuracy in clustering, classification, and recommender system techniques. The Mean Absolute Error is one of the primary metrics that compare actual and predicted ratings. Naturally, the lower the error, the higher the accuracy of the model. This criterion is defined as Equation (24) [43]:
| (24) |
The Root Mean Square Error is another metric that considers the difference between the more substantial errors in the rating prediction, and its advantage over the MAE is adjusting significant errors. The RMSE is defined as Equation (25) [44]:
| (25) |
Two criteria of Precision and Recall are also used to measure the accuracy of recommendation predictions. Precision means the ratio of related selected items to the total of selected items (Equation (26)). The Recall is also the percentage of selected items relative to the total of related items [44], and defined as Equation (27):
| (26) | ||
| (27) |
The two criteria of Recall and Precision are fundamentally related to each other but do not necessarily have a monotonic relationship. To be able to represent both relationships in a relationship, a criterion called F1 is defined as Equation (28):
| (28) |
The other two evaluation criteria used in evaluating RS are the True-Positive Rate and the False-Positive Rate. The TPR (which is equal to the Recall criterion) is defined as the percentage of relevant items selected to total selected items. FPR is calculated as the ratio between the number of adverse events wrongly categorized as definite (false positives) and the total number of actual adverse events. The U is the set of all items [7]. TPR and FPR are defined as Equations (29) and (30):
| (29) | ||
| (30) |
4.3 Results and Discussions
The five presented new hybrid methods and the three basic recommendation methods were implemented on the dataset. Also, seven evaluation measures include MAE, RMSE, Precision, Recall, TPR, F1, and FPR, were used to evaluate the presented methods.
One of the model validation methods in data mining is cross-validation. In the cross-validation method, the data entries are divided into q same datasets. If S is the specified set of entries in the rating matrix R, each segment volume is obtained by the formula . One part of q is used for testing, and the other part is used for training. This process is repeated q until all parts of q are tested. The average q accuracy of the various sections is used as the absolute accuracy of the system. Note that the larger the q value, the higher the accuracy of the system.
A typical example of this system is that the value of q is equal to all system-specified inputs, which is an ideal case. In this case, rating input is used for training, and only one input is used for testing. This article uses the same validation method. The name of this method is leave-one-out cross-validation, and this method is also used in this article.
Given that the number of data collected from LinkedIn is 1404, the data set was divided into 1404 sections. Each section was selected as the target, and the other 1403 users assessed similarities based on the related hybrid method. Then the ten nearest neighbors to the target user are selected, and all evaluation measures are evaluated. This process is repeated 1404 times, and the average of each criterion and method obtain to compare the efficiency and accuracy. Based on each method, the ten similar users to the target user are selected, and finally, the evaluation criteria are measured on each of the output lists of each method to determine the best method in each criterion.
Then, the performance charts of the methods are presented separately in each evaluation measure. As shown in Figure 4, the lowest MAE value belongs to the C hybrid method. This method was the one that used all three approaches of the ANN, fuzzy theory, and weighting. So this method works best in the case of minor errors. The three A, B, and D hybrid methods also perform much better than other basic methods with proximity to the C method. Method A uses weighting and ANN approaches, method B uses fuzzy and weighting approaches and method D uses a fuzzy approach alone. The worst performance among these methods was for the Pierson method is in the MAE measure.
In the RMSE measure, the best performance is related to the D hybrid method. This method only uses a fuzzy strategy without a weighting approach, so it performs better in significant errors. The three A, B, and C hybrid methods are almost identical after this method, and they perform much better than basic methods. As mentioned earlier, method A uses an ANN weighting strategy, B method uses a fuzzy weighting strategy, and method C uses a fuzzy, weighted, and ANN approach. The worst performance in this criterion also belongs to the Pierson method (Figure 4).
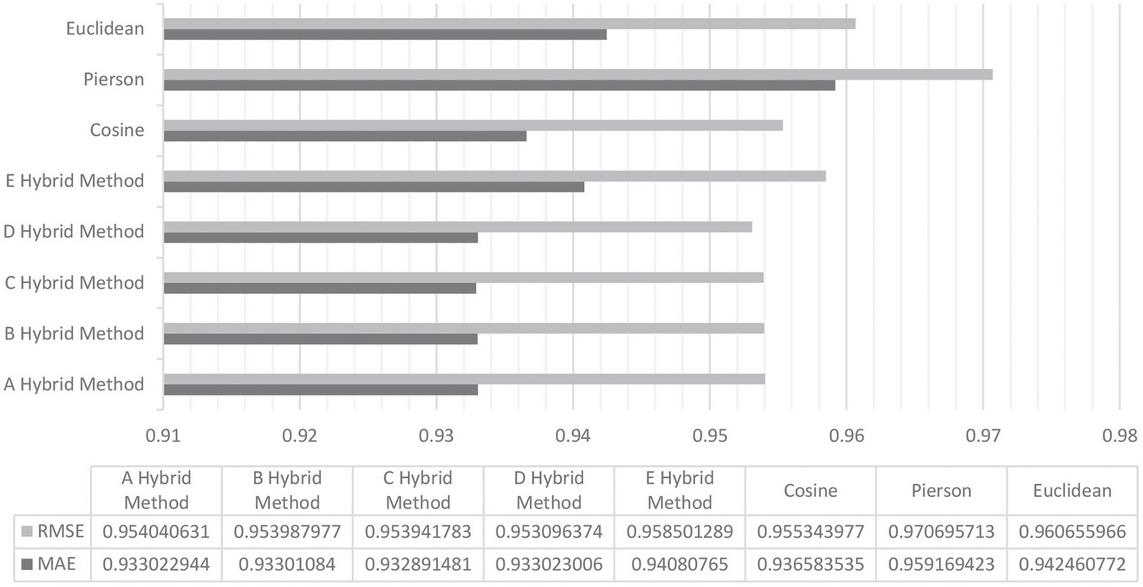
Figure 4 The result of the MAE and RMSE on the presented hybrid methods and basic methods.
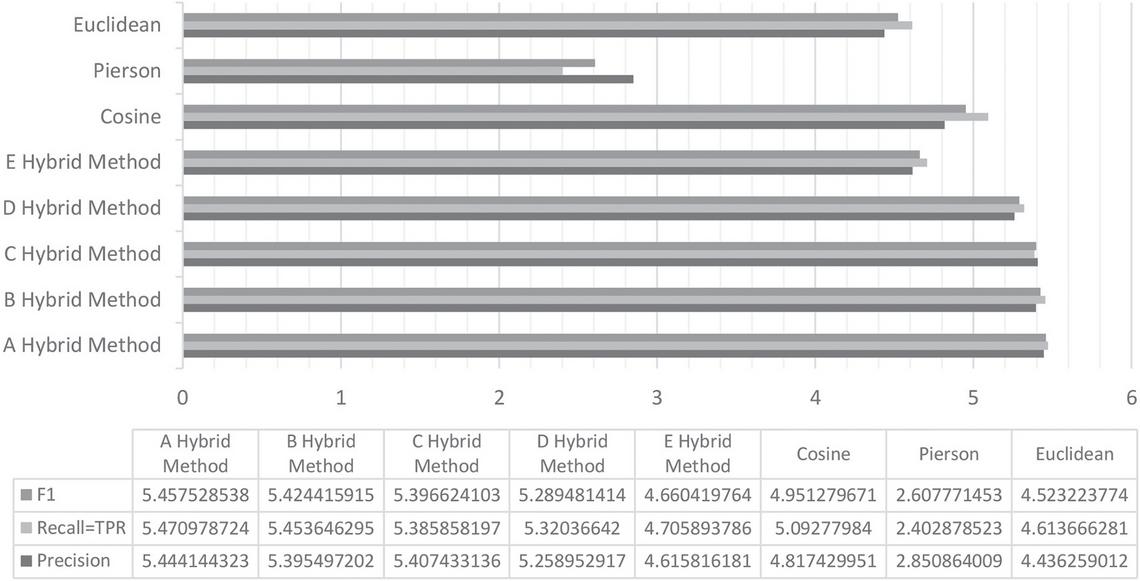
Figure 5 The result of the Precision, Recall, F1, and TPR on the presented hybrid methods and basic methods.
Concerning the Precision measure, the best performance belongs to the A method. Then the best performance in this criterion belongs to the C, B, and D hybrid methods, respectively. The results show that the proposed hybrid methods perform better than the basic methods in this measure. The worst performance in this regard again belongs to the Pierson method (Figure 5). The two criteria of TPR and Recall are almost identical. The best performance on this criterion belongs to A, B, C, and D hybrid methods, respectively. The worst performance belongs to the Pierson method (Figure 5).
The best performance in the FPR measure belongs to the E hybrid method. After that, the best results belong to A, C, B, and D methods, respectively. Like all previous benchmarks, the worst performance in this area also belongs to the Pierson criterion (Figure 6). In the F1 criterion, the best performance belongs to the A method. The best performance then belongs to the B, C, and D methods, respectively. The worst results in this criterion belong to the Pierson method (Figure 5).
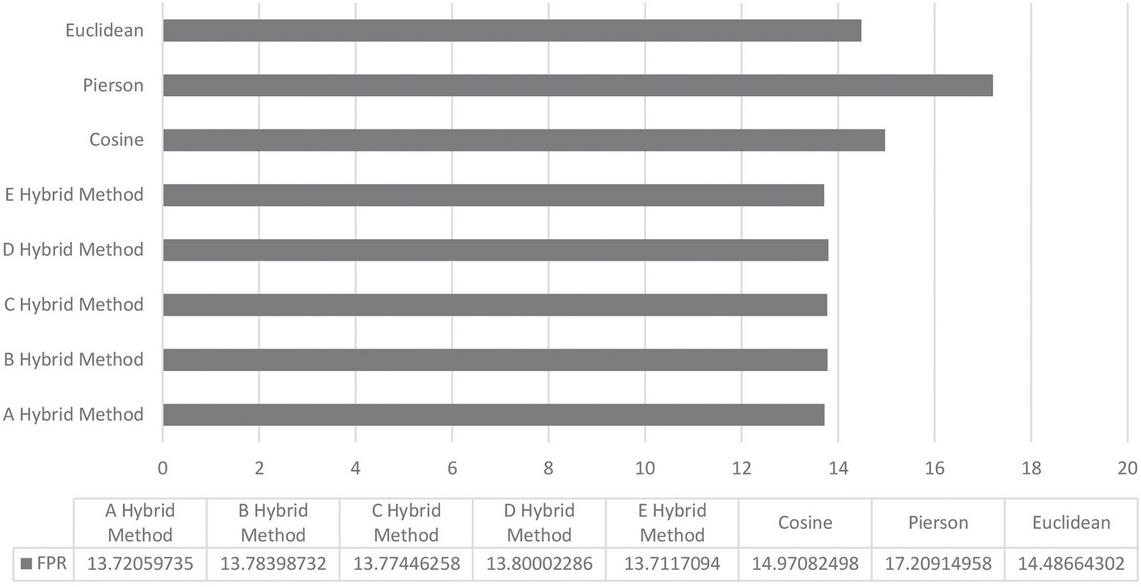
Figure 6 The result of the FPR on the presented hybrid methods and basic methods.
5 Conclusion and Future Study
Today, the rapid growth of the rapid development of IT has led to the emergence of specialized social networks. These networks encompass various entities, including individuals, companies, goods, services, and interests. It was then that RS emerged to overcome the problem of searching for relevant information and recommending items to individuals and vice versa based on the interests and preferences of users on social networks.
Little research was done in literature review on RS recommendation in social networks. The recommendations in this area are merely based on demographic characteristics and the discovery of relationships such as mobile or email contact lists, which are generally not desirable for professional users. As the information on social networks becomes specialized, supply chain interactions are increasingly entering these networks. For this reason, this paper, for the first time, proposes RS recommendations based on supply chain communication.
Accordingly, two ANN and fuzzy theory strategies have been proposed for use in the hybrid RS. Due to the large amount of information available, the ANN strategy initially identified the population of users related to the target user in the supply chain. Then, this approach in different methods made the recommendation based on industry and function attributes. The advantages of the proposed fuzzy strategy with Gaussian function were also used in some new hybrid methods. Also, five new hybrid strategies named the A-E hybrid method were presented. These five methods were implemented with three basic methods on the collected dataset from the LinkedIn social network. All methods were evaluated using seven evaluation measures, including MAE, RMSE, Pression, Recall, TPR, and FPR, and the results were obtained.
The results show that the proposed hybrid methods performed better and more accurately than all the primary methods. The best value of MAE belongs to the C hybrid method, which used a combination of all three weighting, ANN, and fuzzy approaches. It shows that this method works best for small errors, and it is the most accurate method. The A hybrid method uses ANN and weighting approaches and gets the best result on the Precision, Recall, TPR, and F1 measures. These results show that this method also performs best in recall accuracy, correct positive rate, and coverage of recommendations. The D hybrid method that used an independent fuzzy strategy also obtained the best value of the RMSE measure and shows that this method works best for significant errors. The E hybrid method also has the lowest false positive rate and is the best among all methods. This method utilized both the proposed ANN and fuzzy approaches without a weighting strategy.
Other values of the proposed hybrid methods are generally close to the best results, and in general, the accuracy, coverage, and performance of the proposed hybrid methods are higher than the used basic methods.
In future researches, advise considering the presented hybrid methods in other social networks. Genetic algorithm methods should also be used in hybrid methods, and their effect on improving the results will be investigated.
References
[1] Khoshnood F, Mahdavi M, Sarkaleh MK. Designing a recommender system based on social networks and location based services. International Journal of Managing Information Technology. 2012;4(4):41.
[2] Natarajan S, Vairavasundaram S, Natarajan S, Gandomi AH. Resolving data sparsity and cold start problem in collaborative filtering recommender system using Linked Open Data. Expert Systems with Applications. 2020;149:113248.
[3] Sinha BB, Dhanalakshmi R. Building a Fuzzy Logic-Based Artificial Neural Network to Uplift Recommendation Accuracy. The Computer Journal. 2020;63(11):1624–32.
[4] Kunaver M, Požrl T. Diversity in recommender systems–A survey. Knowledge-Based Systems. 2017;123:154–62.
[5] Damiani E, Ceravolo P, Frati F, Bellandi V, Maier R, Seeber I, et al. Applying recommender systems in collaboration environments. Computers in Human Behavior. 2015;51:1124–33.
[6] Cai X, Hu Z, Zhao P, Zhang W, Chen J. A hybrid recommendation system with many-objective evolutionary algorithm. Expert Systems with Applications. 2020;159:113648.
[7] Aggarwal CC. Recommender systems: Springer; 2016.
[8] Hwangbo H, Kim YS, Cha KJ. Recommendation system development for fashion retail e-commerce. Electronic Commerce Research and Applications. 2018;28:94–101.
[9] Sun Z, Han L, Huang W, Wang X, Zeng X, Wang M, et al. Recommender systems based on social networks. Journal of Systems and Software. 2015;99:109–19.
[10] Lu J, Wu D, Mao M, Wang W, Zhang G. Recommender system application developments: a survey. Decision Support Systems. 2015;74:12–32.
[11] HaiHong E, JianFeng W, MeiNa S, Qiang B, YingYi L. Incremental weighted bipartite algorithm for large-scale recommendation systems. Turkish Journal of Electrical Engineering & Computer Sciences. 2016;24(2).
[12] Cui Z, Xu X, Fei X, Cai X, Cao Y, Zhang W, et al. Personalized recommendation system based on collaborative filtering for IoT scenarios. IEEE Transactions on Services Computing. 2020;13(4):685–95.
[13] Krzywicki A, Wobcke W, Kim YS, Cai X, Bain M, Mahidadia A, et al. Collaborative filtering for people-to-people recommendation in online dating: Data analysis and user trial. International Journal of Human-Computer Studies. 2015;76:50–66.
[14] Kim YS, Mahidadia A, Compton P, Cai X, Bain M, Krzywicki A, et al., editors. People recommendation based on aggregated bidirectional intentions in social network site. Pacific Rim Knowledge Acquisition Workshop; 2010: Springer.
[15] Gurini DF, Gasparetti F, Micarelli A, Sansonetti G. Temporal people-to-people recommendation on social networks with sentiment-based matrix factorization. Future Generation Computer Systems. 2018;78:430–9.
[16] Cai X, Bain M, Krzywicki A, Wobcke W, Kim YS, Compton P, et al., editors. Collaborative filtering for people to people recommendation in social networks. Australasian Joint Conference on Artificial Intelligence; 2010: Springer.
[17] Raghuwanshi SK, Pateriya R. Recommendation Systems: Techniques, Challenges, Application, and Evaluation. Soft Computing for Problem Solving: Springer; 2019. pp. 151–164.
[18] McCulloch WS, Pitts W. A logical calculus of the ideas immanent in nervous activity. The bulletin of mathematical biophysics. 1943;5(4): 115–133.
[19] Walczak S. Artificial neural networks. Advanced Methodologies and Technologies in Artificial Intelligence, Computer Simulation, and Human-Computer Interaction: IGI Global; 2019. pp. 40–53.
[20] Macukow B, editor Neural networks–state of art, brief history, basic models and architecture. IFIP international conference on computer information systems and industrial management; 2016: Springer.
[21] Paradarami TK, Bastian ND, Wightman JL. A hybrid recommender system using artificial neural networks. Expert Systems with Applications. 2017;83:300–313.
[22] Tsai C-F, Hung C. Modeling credit scoring using neural network ensembles. Kybernetes. 2014.
[23] Balabanović M, Shoham Y. Fab: content-based, collaborative recommendation. Communications of the ACM. 1997;40(3):66–72.
[24] Zadeh LA, Klir GJ, Yuan B. Fuzzy sets, fuzzy logic, and fuzzy systems: selected papers: World Scientific; 1996.
[25] Klir G, Yuan B. Fuzzy sets and fuzzy logic: Prentice hall New Jersey; 1995.
[26] Yera R, Castro J, Martínez L. A fuzzy model for managing natural noise in recommender systems. Applied Soft Computing. 2016;40:187–198.
[27] Kermany NR, Alizadeh SH. A hybrid multi-criteria recommender system using ontology and neuro-fuzzy techniques. Electronic Commerce Research and Applications. 2017;21:50–64.
[28] Lu HE, Potter A, Rodrigues VS, Walker H. Exploring sustainable supply chain management: a social network perspective. Supply Chain Management: An International Journal. 2018.
[29] Ngai EW, Chau DC, Chan T. Information technology, operational, and management competencies for supply chain agility: Findings from case studies. The Journal of Strategic Information Systems. 2011;20(3):232–49.
[30] Palacios-Marques D, Popa S, Mari MPA. The effect of online social networks and competency-based management on innovation capability. Journal of Knowledge Management. 2016.
[31] Hamilton JW, Kwon I-W. Strategic Success, Supply Chain Performance, and Social Media. 2016.
[32] Markova S, Petkovska-Mirèevska T. Social media and supply chain. Amfiteatru Economic Journal. 2013;15(33):89–102.
[33] Lambert DM. Supply chain management: processes, partnerships, performance: Supply Chain Management Inst; 2008.
[34] Cox DD, McLeod S. Social media marketing and communications strategies for school superintendents. Journal of Educational Administration. 2014.
[35] Linkedin. 2021 [Available from: https://about.linkedin.com/].
[36] Wu L, Shah S, Choi S, Tiwari M, Posse C. The browsemaps: Collaborative filtering at LinkedIn. RSWeb@ RecSys. 2014;1271.
[37] Al-Shamri MYH. User profiling approaches for demographic recommender systems. Knowledge-Based Systems. 2016;100:175–187.
[38] Choi K, Suh Y. A new similarity function for selecting neighbors for each target item in collaborative filtering. Knowledge-Based Systems. 2013;37:146–153.
[39] Sert SY, Ar Y, Bostanci GE. Evolutionary approaches for weight optimization in collaborative filtering-based recommender systems. Turkish Journal of Electrical Engineering & Computer Sciences. 2019;27(3):2121–2136.
[40] Sondur MSD, Chigadani MAP, Nayak S. Similarity measures for recommender systems: a comparative study. Journal for Research. 2016;2(3).
[41] Ogbuanya TC, Chukwuedo SO. Career-training mentorship intervention via the Dreyfus model: Implication for career behaviors and practical skills acquisition in vocational electronic technology. Journal of Vocational Behavior. 2017;103:88–105.
[42] Hameed IA, Elhoushy M, Osen OL, editors. Interval Type-2 Fuzzy Logic Systems for Evaluating Students’ Academic Performance. International Conference on Computer Supported Education; 2016: Springer.
[43] Isinkaye F, Folajimi Y, Ojokoh B. Recommendation systems: Principles, methods and evaluation. Egyptian Informatics Journal. 2015;16(3): 261–273.
[44] Silveira T, Zhang M, Lin X, Liu Y, Ma S. How good your recommender system is? A survey on evaluations in recommendation. International Journal of Machine Learning and Cybernetics. 2019;10(5):813–831.
Biographies

Abolfazl Zare received a Ph.D. degree in Information Technology Management (Business Intelligence) from the Islamic Azad University, Central Tehran Branch, in 2020. Zare has been working on web development for nearly a decade and is interested in smart cities, big data and data mining, social mining, artificial neural networks, business intelligence, and recommendation systems and has written in these fields.

Mohammad Reza Motadel received his Ph.D. in Production Operation Management from the Islamic Azad University, Science and Research Branch in 2004. He is currently a faculty member of the Islamic Azad University, Central Tehran Branch, and has more than twenty years of teaching experience. He specializes in Business Intelligence, production management, and data analysis.

Aliakbar Jalali received the B.S. degree from K. N. Tosi University of Technology in 1984, MSc. Degree from Oklahoma University (OU) in 1988 and a Ph.D. degree from West Virginia University (WVU) in 1993. Jalali worked for 30 years in the college of Electrical Engineering at the University of Science and Technology in Iran. He currently is working as an adjacent professor in the department of CSEE at the University of Maryland Baltimore County (UMBC).
Journal of Web Engineering, Vol. 21_3, 633–660.
doi: 10.13052/jwe1540-9589.2133
© 2022 River Publishers