Discovery and Analysis About the Evolution of Service Composition Patterns
Zhenfeng Gao1,2, Yushun Fan3,*, Xiu Li1,*, Liang Gu2, Cheng Wu3 and Jia Zhang4
1 Graduate School at Shenzhen, Tsinghua University, Shenzhen, China
2 Sangfor Technologies Inc., Shenzhen, China
3 Tsinghua National Laboratory for Information Science and Technology, Beijing, China
4 Department of Electrical and Computer Engineering, Carnegie Mellon University, Silicon Valley, California, USA
E-mail: li.xiu@sz.tsinghua.edu.cn; gzf@sangfor.com.cn; guliang@sangfor.com.cn;
fanyus@tsinghua.edu.cn; wuc@tsinghua.edu.cn; jia.zhang@sv.cmu.edu
* Corresponding Authors
Received 7 January 2019; Accepted 19 November 2019; Publication 28 November 2019
Abstract
Service ecosystems, consisting of various kinds of services and mashups, usually keep evolving over time. Existing works on the evolution of service ecosystems focus on either evaluating the impacts of single services’ changes on the usage of services and the stability of the whole ecosystem, or discovering co-occurrence relationship between services, but fail to disclose any knowledge from the aspect of the evolution of service composition patterns. Based on our previous work, this paper moves one step further, revealing the latent service composition trends in a service ecosystem and providing more distinct explanation of different topic evolution patterns. A novel methodology, named Extended Dependency-Compensated Service Co-occurrence LDA (EDC-SeCo-LDA), is developed to calculate the directed dependencies between different topics and build topic evolution graph. The evolution trend of service composition could be disclosed by the graph intuitively. What’s more, EDC-SeCo-LDA proposes five different ways to adopt dependency compensation to improve the performance when making service recommendation. Experiments on ProgrammableWeb.com show that EDC-SeCo-LDA can reveal significant topic dependencies, and recommend service composition more effectively, i.e., 6% better in terms of Mean Average Precision compared with baseline approaches.
Keywords: Topic evolution graph, service composition recommendation, topic model.
1 Introduction
As Service-Oriented Architecture (SOA) and Cloud Computing are widely adopted, the amount of published web services on the Internet has been rapidly growing [1]. By reusing existing services (i.e., APIs), software developers are able to quickly create service compositions (i.e., mashups) to meet complex functional needs and offer additional business values [2]. However, users’ demands on mashups could vary over time. As a consequence, developers’ preference for combining certain domains of services may gradually change, making the trend of services composition patterns keep on evolving. The evolution of service system makes it challenging for developers to comprehend the trend of service composition patterns. ProgrammableWeb.com, which is recognized as a typical web service ecosystem, has establish “API University” to help developers understand the latest services and trend of make compositions. But people may still get confused when manually selecting proper candidates to meet their specific functional requirements. Such challenges call for new techniques to help developers gain a better understanding of the evolutionary characteristics of service ecosystem, and select services more effectively and intelligently.
In the research of service ecosystem evolution, most works make efforts to analyze the impact of a single service’s change, and try to deal with the version problem in order to maintain system stability [3–8]. Although evolutionary characteristics can be mined, these works study the evolution problem from the perspective of individual services or service dependencies, which could not expose any information about the trend of service composition in the service ecosystem, e.g., what kind of service composition patterns are becoming more and more popular recently, how they merged or branched into new ones, whether they were inspired by some relatively old patterns and so on. As a result of which, existing researches on service recommendation usually lose sight of the inherent information about the evolution of service composition patterns.
Few have considered mining evolution characteristics of service ecosystem from the perspective of service composition patterns. In [9], we introduced a concept of “service co-occurrence topic,” which demonstrated the existence of latent service composition patterns described with the distribution over services. That is to say, the inherent importance of different services in one topic describes a certain service composition pattern. For example, a topic on people’s social life is described by the distribution on services like {Twitter: 0.24, Facebook: 0.12, Yahoo Blog: 0.11, ...}. In this paper, we further study the service ecosystem’s evolution problem from the perspective of service co-occurrence topics, and define the directed evolutionary relationship between topics as “topic dependency.” Some existing probabilistic topic models on text mining could reveal semantic topics [10–12], which are described with distributions over text words. Their results could be used to calculate topic similarity, which is an undirected correlation between topics. In contrast, we argue that “topic dependency” is a kind of directed relationship, reflecting the latent evolution trend of service composition patterns. For example, with the development of service ecosystem and the change of people’s demands, a topic on multimedia information and a topic on shopping guidance might gradually merge into a new topic on multimedia-based shopping recommendation. That is to say, service developers gradually combine services about multimedia information and services about shopping guidence together to create new mashups and provide funcitionalities of multimedia-based shopping recommendation to meet people’s changing demands. What’s more, if developers could comprehend this specific trend, they may naturally consider combine multimedia information services when they decide to enrich a specific service about shopping guidence.
Up-to-date machine learning algorithms were used to make the web service discovery and recommendation more effective and efficient [13]. Nevertheless, without the consideration of evolutionary information of service compositions, existing researches on service recommendation or service discovery just utilized easily-obtained information provided by service ecosystems (e.g., services’ and mashups’ descriptions, time information, QoS values and so on) [14].
To the best of our knowledge, no algorithm exists to mine such dependencies of service co-occurrence topics and then utilizes it to improve the performance of service recommendation. Based on our previous work [15], we propose a novel model, “Extended Dependency-Compensated Service Co-occurrence LDA” (EDC-SeCo-LDA), by extending SeCo-LDA [9] to identify the evolutionary characteristics of service ecosystem at the topic level. Leveraging the information of mashups’ published time, we design an algorithm to calculate the topic dependencies based on topic-service distribution. Topic dependencies, which is directed, reveal the latent trend of service composition patterns in the service ecosystem. Inspired by [8, 16], we propose four “topic evolution patterns” (i.e., Merge, Branch, Co-occur and Arise) and construct a topic evolution graph. The evolution graph could provide information more intuitively, and help people understand the evolution of topics at a systemic level. What’s more, to make full advantage of topic dependencies when making service recommendation, we move one step further based on our previous work [15] and design five different ways to make dependency compensation (i.e., Basic Dependency Compensation (BDC), Time-decaying Dependency Compensation (TDC), Importance-based Dependency Compensation (IDC), Relative-Importance-based Dependency Compensation (RIDC) and 2-Generation Dependency Compensation (2GDC)). The intuition of dependency compensation is that based on the revealed evolutionary information between topics, it is able to weaken the inherited characteristics between topics and make their particular features more vivid. As a result, the compensated topics will be more explainable and the performance of service recommendation based on topics could be improved.
The main contributions of this paper are summarized as follows:
- (1) A concept of “topic dependency” is created to describe the evolution relationship between different service co-occurrence topics. Meanwhile, four “topic evolution patterns” are proposed (i.e., Merge, Branch, Co-occur and Arise) to classify different forms of topic evolution trends.
- (2) A novel method EDC-SeCo-LDA is developed to discover topic dependencies and build topic evolution graph. Topic evolution graph presents information concisely and intuitively and reveals the latent trend of service composition patterns in a service ecosystem. Experiments over real-world data set ProgrammableWeb.com show that EDC-SeCo-LDA can discover significant topic dependencies to build evolution graph. Detail explanations of the evolution of service composition patterns are provided.
- (3) EDC-SeCo-LDA also provide five different ways of making dependency compensation (i.e., BDC, TDC, IDC, RIDC and 2GDC) when making service recommendation to improve the performance. Comprehensive experiments over ProgrammableWeb.com are conducted. We detailedly demonstrate the influence of dependency compensation on topics’ distributions by examples. What’s more, EDC-SeCo-LDA can achieve a higher MAP value than baselines when recommending related services for a selected one, approximately 6% better than the second-best baseline approach, verifying the significance of making dependency compensation.
The rest of this paper is organized as follows. Section 2 provides the definition of background. Section 3 introduces EDC-SeCo-LDA model. Section 4 illustrates detailed algorithms in the model. Section 5 shows experimental results on a real-world data set from ProgrammableWeb.com, including discovering topic dependencies, building topic evolution graph and making recommendation. Detailed discussion of parameter setting and coefficients’ influence are also presented. Section 6 summarizes the related work and finally Section 7 concludes the paper.
2 Background
In this section, we provide definitions on service ecosystems and then pose the problems to be addressed. In general, our solution to discovering topic dependencies, building topic evolution graph and making compensation when recommending for service compositions is suitable for any service ecosystem that satisfies Definitions 1∼3.
Definition 1: Topology of service ecosystem. The topology of a service ecosystem containing mashup-service citation records is modeled as an undirected graph G = (M ∪ S, E) in which: M = {m1, m2, ..., mNm} is the set of mashups and S = {s1, s2, ..., sNs} is the set of services; NM is the number of mashups and NS is the number of services; E ⊆ M × S is the historical usage records between mashups and services, i.e., if mashup j invokes service i, E(j, i) = 1.
Definition 2: Service Co-occurrence Topics. Service co-occurrence topics [9] describe latent composition patterns between services and are represented by the distribution over services in the service ecosystem. For example, topic k is described by {ϕjk, j = 1, ..., NS}, in which ϕjk describes the impact of service j on topic k when making service composition, and ∑j ϕjk = 1.
In this paper, we consider these characteristics of each service co-occurrence topic:
- (i) Topic Importance: Different service co-occurrence topics reveal different composition patterns and have different importances in the service ecosystem.
- (ii) Topic Representative Services: Topic representative service are those that are the most popular in a service co-occurrence topic, from which we could tell the meaning of the composition pattern. Here, the more “popular” a service is in a service co-occurrence topic, the higher probability it has to be chosen when designing service compositions about this topic.
- (iii) Topic Temporal Strength: The temporal strength of a topic is an distribution over time, reflecting a service co-occurrence topic’s lifecycle and revealing the change of its popularity.
- (iv) Topic Time Expectation: Time expectation could be calculated with topics’ temporal strength. With this, we could distinguish new topics from old ones in the process of the development of service ecosystems.
Based on the above definitions, we now pose three problems that we intend to address in this paper.
Problem 1: Discovery of Topic Dependencies. As mentioned in Section 1, in this paper, we intend to study the service ecosystem’s evolution problem from the perspective of service co-occurrence topics, discovering the directed evolutionary relationship between topics as “topic dependency.” A graphic example of topic dependency relationship is shown in Figure 1. Service cooccurrence topics disclose information of service composition patterns. And a directed dependency from topic i to topic j demonstrates that with the development of service ecosystem and the change of people’s demands, a relatively new topic j gradually formed based on topic i, reflecting the latent evolution trend of service composition patterns. Or for short, we could tell that topic i has an evolutionary effect on topic j.
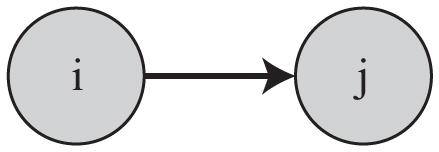
Figure 1 Graphic example of topic dependency relationship.
Some existing work with probabilistic topic models on text mining [10–12] could lead to calculating topic similarity, which is an undirected correlation between topics different from topic dependencies.
Problem 2: Building Topic Evolution Graph. Based on topic dependency relationships, we mean to construct a topic graph as [16], presenting information about the evolution of topics (composition patterns) in a conciser and more visualized way. With the help of topic evolution graph, we could discover significant service composition patterns more explicitly.
Problem 3: Recommendation for Service Composition. In this paper, to evaluate whether it is significant to make dependency compensation, we consider such a situation as in [9, 15, 17]: assuming a mashup-developer selects the first API from the original search results provided by an online service repository (e.g., ProgrammableWeb.com), now he needs to find other APIs to create a new mashup. Different from scenarios in goal-based service composition [18, 19], he might not know exactly what kind of mashup he wants to make, and just hope to find related services to make significant compositions. Here we refer to the selected service as sl, and the result of recommendation for its service composition is provided as a ranked list Rl = {sl1, sl2, ...}.
3 Extended DC-SeCo-LDA Model
The key idea of EDC-SeCo-LDA is to discover directed topic dependencies, build topic evolution graph, and make dependency compensation to promote the performance of recommendation. Analogous to SeCo-LDA [9], we first construct service co-occurrence documents and apply a probabilistic topic model to reveal latent service co-occurrence topics. We make some changes when calculating temporal strength, which we will illustrate in Section 4. Then we design algorithms to discover topic dependencies and build topic evolution graph. When recommending for service composition, we extend [15] and design five ways to adopt dependency compensation to weaken the inherent characteristics betweens topics and improve the recommendation performance.
In this section, firstly, we give a general introduction to the overall framework of EDC-SeCo-LDA. Then, details are introduced from several aspects of SeCo-Part, Topic Dependency, Topic Evolution Graph, Dependency Compensation and Recommendation for Service Composition.
3.1 Overall Framework
As is shown in Figure 2, for a mashup developer, EDC-SeCo-LDA is helpful in understanding the trend of designing service compositions as well as making recommendation for service compositions.
Multiple kinds of information in a service ecosystem is taken into account, including mashups’ published time, service content information and mashup-service usage records. In EDC-SeCo-LDA, we firstly create service co-occurrence documents and derive service co-occurrence topics and their characteristics as [9]. Then, we introduce the definition of “topic dependency.” With the help of topic dependencies, we could build the topic evolution graph, and design different ways to make compensation on topics’ distribution over services. Topic evolution graph is a conciser and more visualized way to show the evolutionary relationship between topics, helping mashup developers to understand the trend of service composition. Dependency compensation could improve the performance of recommending service compositions.
3.2 SeCo Part
In EDC-SeCo-LDA, the processes of constructing service co-occurrence documents and applying a probabilistic topic model on the corpora are similar with those in our previous work [9]. Here is a brief overview.
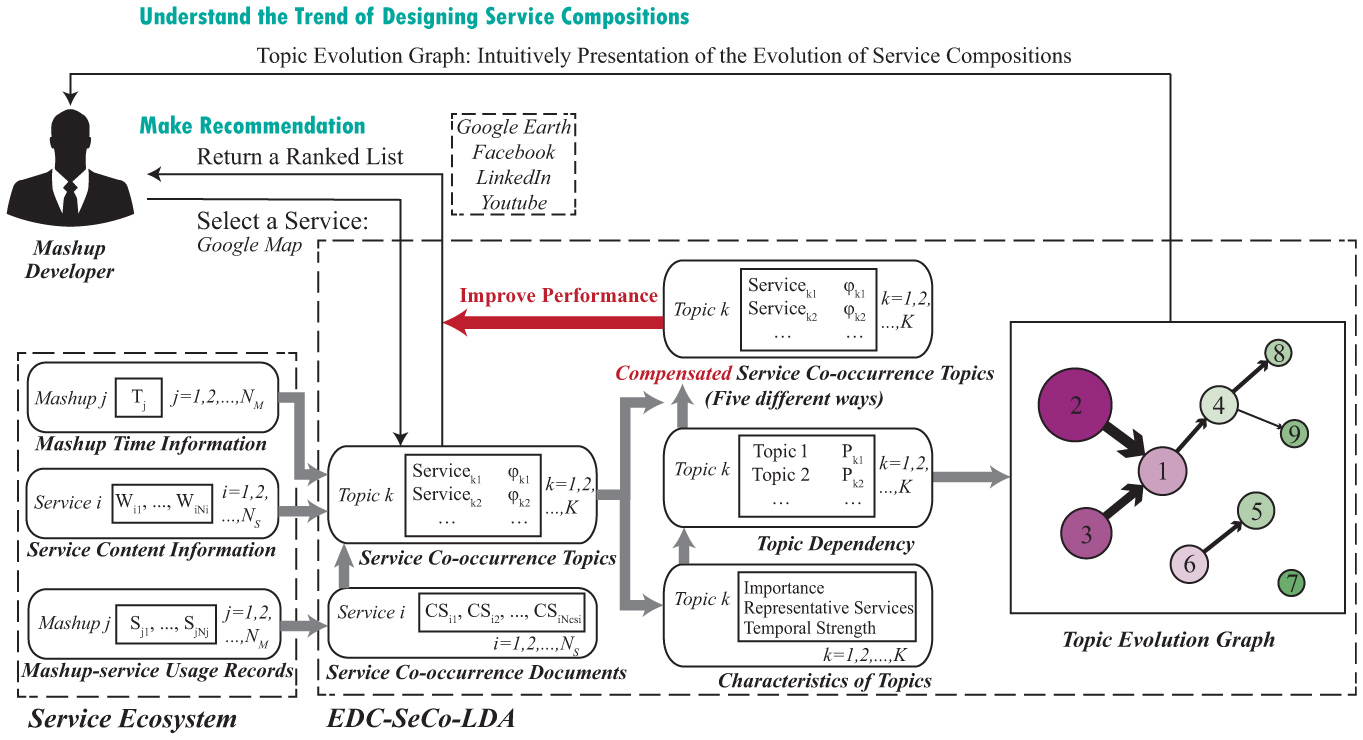
Figure 2 Framework of EDC-SeCo-LDA.
3.2.1 Service Co-occurrence documents
For each service si ∈ S, using its co-occurring services as word tokens, we represent si as a “bag of service co-occurrences” di = {#(scj) = ci,j|j ∈ S} in which: #(scj) = ci,j means service co-occurrence on sj appears ci,j times in the description document of si, or service i and j are composited together for ci,j times by mashups.
3.2.2 Service Co-occurrence LDA
Assume that there were K different service co-occurrence topics expressed over NS unique services in service ecosystem. We set z = 1:K as the topic indicator variable. The topic distribution for service co-occurrence documents (i.e., P(z|d)) can be represented by a NS × K matrix Θ, each row of which, θi, being a K-dimensional multinomial distribution for document si and . The distribution over services for topics (i.e., P(s|z)) can be represented by a K × NS matrix Φ, each column of which, ϕz being a NS-dimensional multinomial distribution for topic z and .
We use symmetric Dirichlet priors for Θ and Φ with hyper-parameters α and β [20], respectively. Graphical model is shown in Figure 3. The generative process of SeCo-LDA part is described as follows.
For each service i in the service ecosystem,
- (i) Draw topic proportions θi ∼ Dirichlet(α).
- (ii) For each co-occurring service scin of service i,
- (a) Draw topic assignment zin ∼ Multi(θi).
- (b) Draw service i’s co-occurring service scin ∼ Multi(ϕzin).
3.3 Topic Dependency
Definition 3: Topic Dependency. In this paper, we utilize conditional probability to put forward the novel conception of “topic dependency.” To be more specific, correspond with the graphic example shown in Figure 1, we regard the probability of the occurrence of one topic i conditioned on another topic j as the topic dependency between them. That is, we represent Pr(ki → kj|kj) as the topic dependency from topic i to topic j, or the degree of topic i’s evolutionary influence on topic j. We use a K × K matrix TD to describe all the topic dependencies, where each element td(j, i) = Pr(ki → kj|kj).

Figure 3 Graphic model of service co-occurrence LDA part.
Definition 4: Child Topic & Parent Topic. Take the dependency relationship provided in Figure 1 as example, when topic i has an evolutionary effect on topic j, we define topic j as topic i’s “child topic,” and topic i as topic j’s “parent topic.” It indicates that with the development of service ecosystem and the change of people’s demands, service composition patterns of topic i have an impact on the formation of the composition patterns of topic j, or topic j inherits some part of the characteristics of topic i. And for short, we could tell that topics j is generated partially from topic i.
Different from topic similarity [10, 11] which describes a kind of undirected relationship between topics, topic dependency refers to directed relationship between different topics, revealing the evolutionary influence of one topic on another. The key to discover topic dependencies is to obtain the topics’ distributions over services (i.e., topic-service distribution), while traditional word-based topic model [12] could not achieve this. With the results of SeCo part in our model illustrated in Section 3.2 and the definition of the directed topic dependencies, we can discover significant topic dependencies, whose algorithm will be introduced in Section 4. Detailed experiments and explanations are provided in the experimental section.
3.4 Topic Evolution Graph
With the help of topic dependencies, we could tell whether a topic is generated from or the ancestor of another topic. By accumulating significant topic dependencies, a topic evolution graph could be created. As the example shown in Figure 2, a topic evolution graph should contain information about topics’ importance and time strength, as well as the dependencies between them. It can provide mashup developers an overall view of the evolution trend of service composition patterns, e.g., what kind of service composition patterns are becoming more and more popular recently how the old topics (composition patterns) merged or branched into new ones, whether they were inspired by some relatively older patterns and so on. Here we propose a formal definition of the topic evolution graph as follows.
Definition 5: Topic Evolution Graph. A topic evolution graph is modeled as a directed graph GE = (T, TD) in which: T = {t1, t2, ..., tK} is the set of service co-occurrence topics, and each node in the graph represents a specific topic; TD is the edge set of directed topic dependencies, i.e., if td(j, i) > 0, there exists an directed edge from node i pointing to node j in the graph. What’s more, the size of nodes indicates the importance of different topics, and their differences in color would help us distinguish different topics’ expectation time.
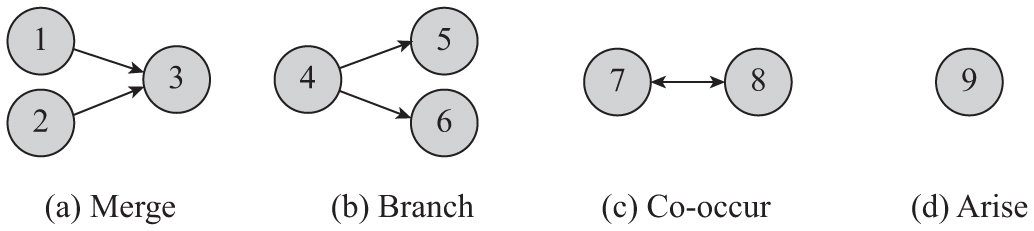
Figure 4 Examples of the four topic evolution patterns.
Definition 6: Topic Evolution Patterns (Functionally). Generally, in a topic evolution graph, four evolution patterns could be discovered as shown in Figure 4.
- (i) Merge: two or more topics merge into one new topic.
- (ii) Branch: one topic branches into two or more new topics.
- (iii) Co-occur: if a topic’s child topic is its parent topic at the same time, we call these two topics a co-occur pattern, that is, the two topics have influence on each other. Notice that their time expectations must be closed.
- (iv) Arise: if a topic just appears in the topic evolution graph without any parents, we call this an arise pattern, that is, this topic just arises without other old topics contributing to it.
Detailed experiments and explanation of results are provided in Section 5.
3.5 Dependency Compensation
The key intuition here is that since we’ve got the latent revolutionary relationship between different topics (i.e., topic dependencies), it is possible to utilize this kind of information to weaken the inherited characteristics between topics and make their particular features more vivid. To make the revealed service co-occurrence topics more explainable and improve the performance of service recommendation, we design algorithms called “dependency compensation.”
Intuitively, we prefer the revealed topics to be more independent so that the revealed topics could have their own features and provide a better description of service co-occurrence documents. Consider the worst case, if all the revealed service co-occurrence topics had the same topic-service distribution, they would make no contribution to disclosing service composition patterns of the service ecosystem or making service recommendation, that is, the revealed topics made no sense. On the contrary, if the revealed topics had mutually independent distribution, each topic would have its own features. And under this circumstances, these topics could provide a more comprehensive description of service ecosystem, resulting in better performance in recommendation. Actually, due to the existence of dependency relationship, some topics may have partial common features in distribution. As this may lead to poor performance on recommendation.
Few have considered taking advantage of topic dependencies when recommending for service composition, because topic dependency relationship could not be calculated through traditional models. In EDC-SeCo-LDA, we leverage a topic’s parent and child topics to compensate the distribution of this topic, highlighting the characteristics of its own. By extending our previous conference work [15], leveraging information about topic dependencies, topics’ time expectation and topic importance, we propose five different ways to make dependency compensation on the distribution of topics (i.e., topic-service distribution). As mentioned before, ϕi is a Ns-dimensional multinomial distribution for topic i. Generally, we use to represent the compensated topic-service distribution for topic i.
3.5.1 Basic dependency compensation (BDC)
As shown in Figure 5, in Basic Topic Dependency (BTD), we introduce coefficient λ for parentside dependency compensation, and coefficient μ for child-side. When considering topic i’s distribution, we intend to weaken the features inherited from its parent topics, and strengthen the features on which it affects its child topics (which might be topic i’s particular features). So, intuitively, λ might be a negative value (λ < 0), and μ be positive (μ > 0). The compensated distribution of topic i is calculated as follows:
| (1) |
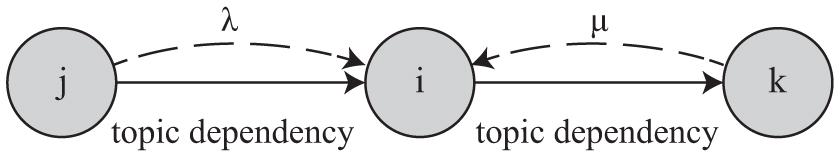
Figure 5 Example of basic dependency compensation (BDC).
where TD(i,j) represents for the topic dependency from topic j to topic i, TD(k, i) represents for the topic dependency from topic i to topic k. stands for the compensated service distribution of topic i.
The complexity of the compensation part is O(Kdep), where Kdep is the total number of topics that have dependencies with other ones.
3.5.2 Time-decaying dependency compensation (TDC)
Based on BDC, Time-decaying Dependency Compensation (TDC) takes topics’ time expectation into consideration. Intuitively, taking topics i and j in Figure 5 for example, topic j is a relatively older topic compared with topic i. The more difference in time expectation between topic i and j, the less effect topic j might have on topic i. Thus we should eliminate less j’s influence on i when calculating topic i’s compensated distribution.
To achieve this, we introduce the concept of time decaying when considering both child-side and parent-side compensation in TDC. Also, we consider the same situation as Figure 5 in BDC, the compensated distribution of topic i is calculated as follows:
| (2) |
where e−η(|TEi−TEj|) is the time-decaying part with coefficient η > 0. |TEi − TEj| would get a large result if topic i is much newer than topic j, resulting in a smaller value of the time-decaying part so that we just need to eliminate a little of topic j’s influence on i. It is the same with the parent-side of topic i. Intuitively, λ might be also a negative value (eliminate characteristics inherited from parent topic), and μ be positive (strengthen characteristics that influence child topic). And the complexity of the compensation part is also O(Kdep).
3.5.3 Importance-based dependency compensation (IDC)
Based on BDC, Importance-based Dependency Compensation (IDC) takes topic importance into consideration. The more important (or popular) a topic is, the higher probability service compositions of this topic would have to be chosen when creating new mashups. The most popular ones indicate the trend of service composition in the service ecosystem. So it might be significant to utilize topics’ importance to amend topic dependency compensation method.
Taking Figure 5 for example, if topic j has a high importance in the service ecosystem, it would have more influence on topic i. So we need to eliminate less part of j’s influence on the distribution of i. The compensated distribution of topic i is calculated as follows:
| (3) |
where Im(j) is the topic importance of topic j and ; K is the number of topics. We employ K · Im(j) to make the value of λ and μ similar with those in BDC and TDC roughly. Intuitively, λ should be also a negative and μ be positive. The complexity of the compensation part is also O(Kdep).
3.5.4 Relative-importance-based dependency compensation (RIDC)
Relative-Importance-based Dependency Compensation (RIDC) resembles IDC in considering topic importance, but with the difference that it utilizes the relative importance of the two topics. To be more specifically, consider the situation as in Figure 5, the compensated distribution of topic i is calculated as follows:
| (4) |
where is the relative importance between topics j and i, and is the relative importance between topics k and i. Because we’re intending to calculate the composited distribution of topic i, so the two denominator are all Im(i). Similarly, λ should be also a negative and μ be positive, and the complexity of the compensation part is also O(Kdep).
3.5.5 2-Generation dependency compensation (2GDC)
Furthermore, we design 2-Generation Dependency Compensation (2GDC) to find out whether it is significant if we take a topic’s “grandson” or “grandparent” topic into consideration when making dependency compensation.
In 2GDC, for every topic, we consider at most two generation of both its parent-side relationship or child-side relationship. As shown in Figure 6, supposed that topic i’s parent topic j has a parent jj, and i’s child topic k also has a child kk. Or we can say that topic jj is i’s grandparent topic, and topic kk is i’s grandson topic. The compensated distribution of topic i could be calculated as follows:
| (5) |

Figure 6 Example of 2 generation dependency compensation (2GDC).
where sign(x) is the sign function (i.e., sign(x) = 1 when x ≥ 0, and −1 when x < 0). We introduce the sign function in Equation (5) to maintain the original sign of λ and μ. And λ should be also a negative and μ be positive by intuition. The complexity of the compensation part is also O(Kdep).
3.6 Recommendation for Service Composition
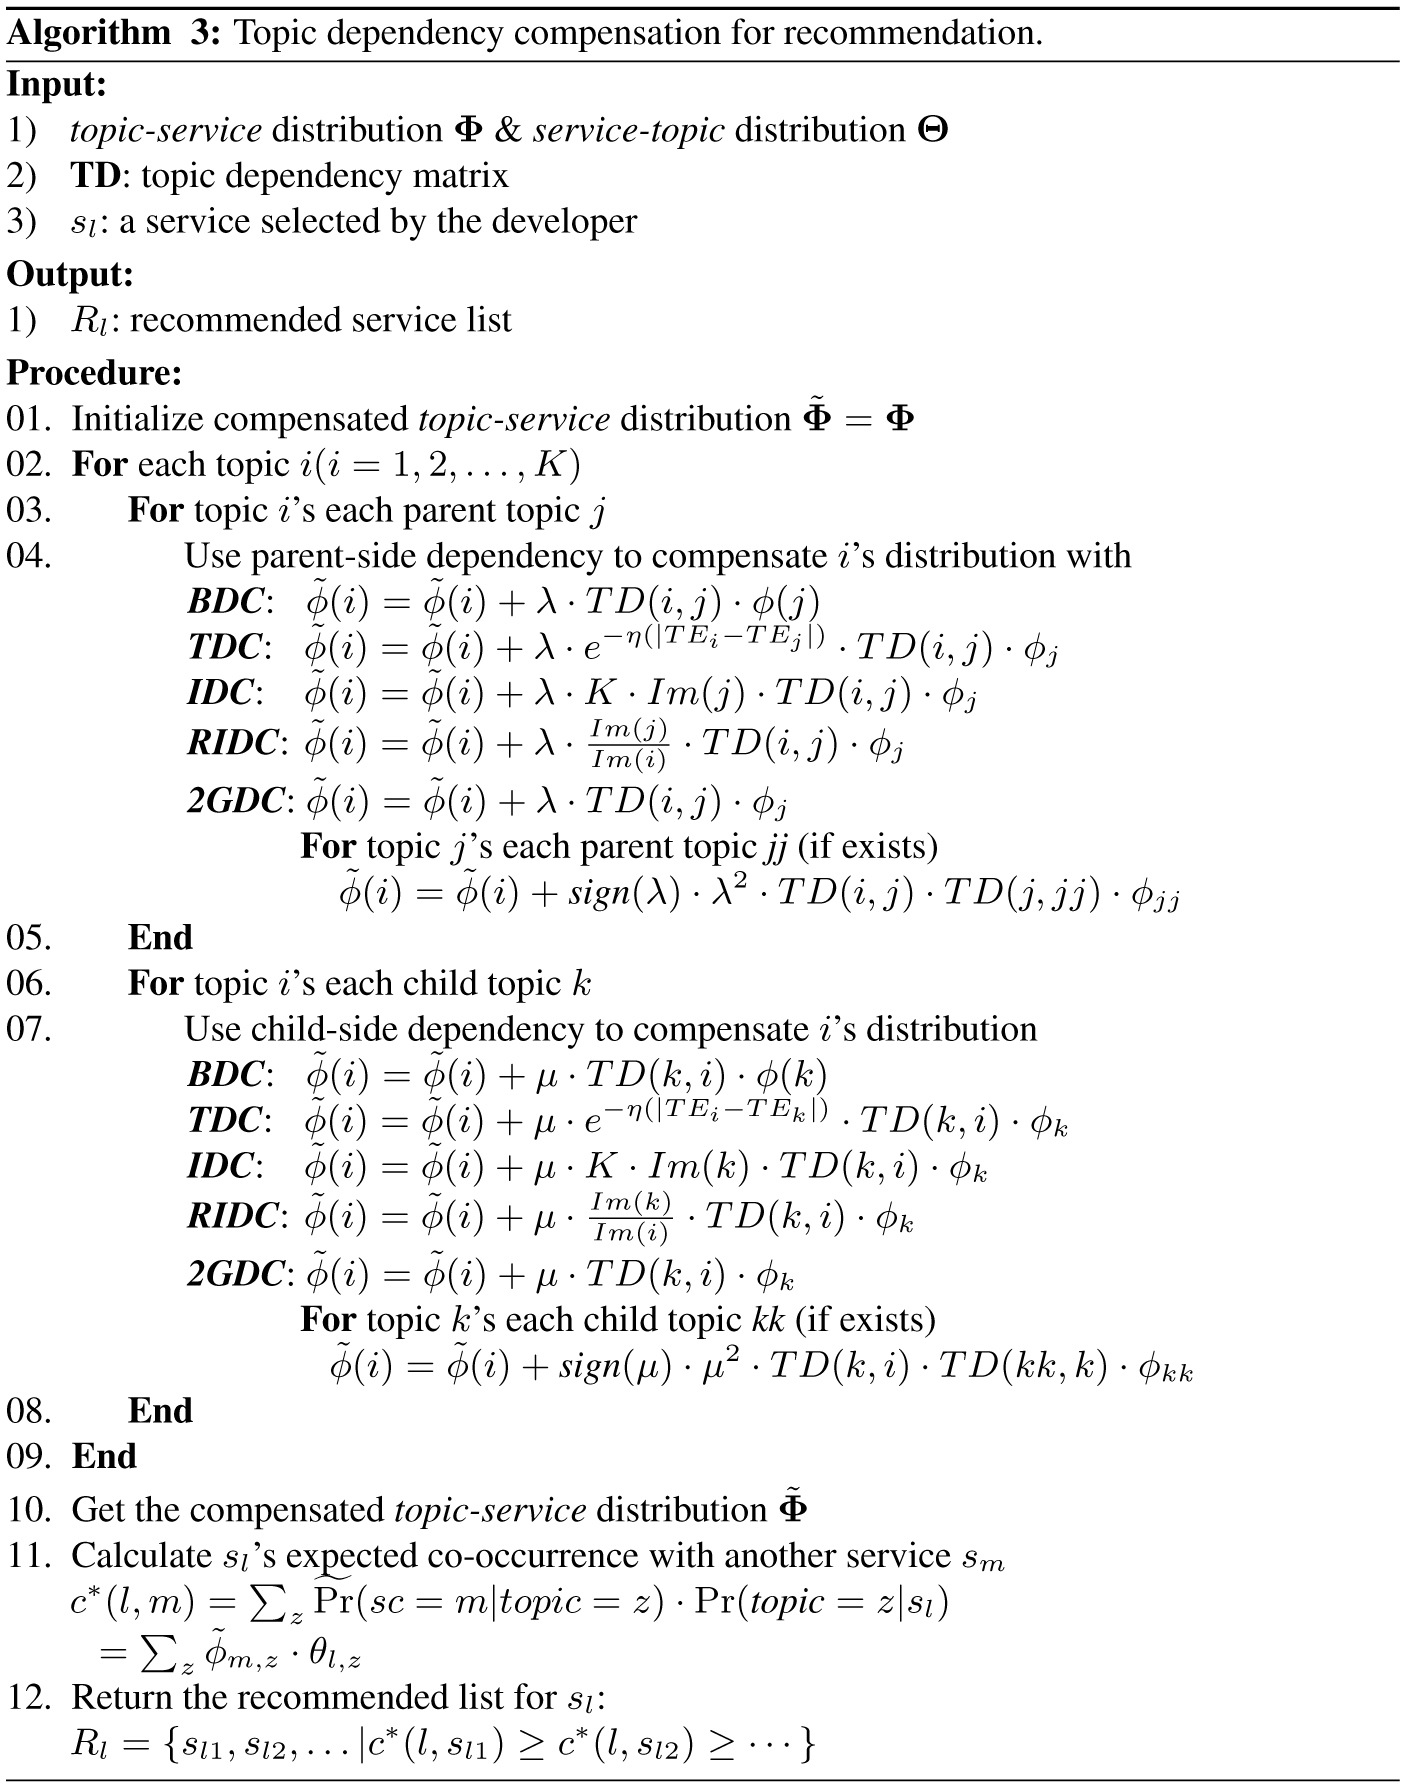
As discussed in Problem 3, in this paper we consider such a situation as in [9, 15, 17]: assuming a mashup developer selects the first API (service), and wants to find other APIs to create a new mashup. Actually it’s one of the application scenarios in reality. Assume that an developer has selected service sl ∈ S from the original search results provided by a online service repository (e.g., ProgrammableWeb.com), then we mean to provide a ranked service list to inspire him to make significant compositions. We could calculate sl’ co-occurrence expectation with another service sk ∈ S as follows:
| (6) |
Referring to the selected service as sl, the result of recommendation is represented as a ranked list Rl = {sl1, sl2, ...}.
4 Learn the EDC-SeCo-LDA Model
In this section, we first introduce the parameter learning and discovery of service co-occurrence topics along with their characteristics. Then we will present algorithms to calculate topic dependencies, construct topic evolution graph and make dependency compensation for recommendation.
4.1 Parameter Learning of SeCo Part
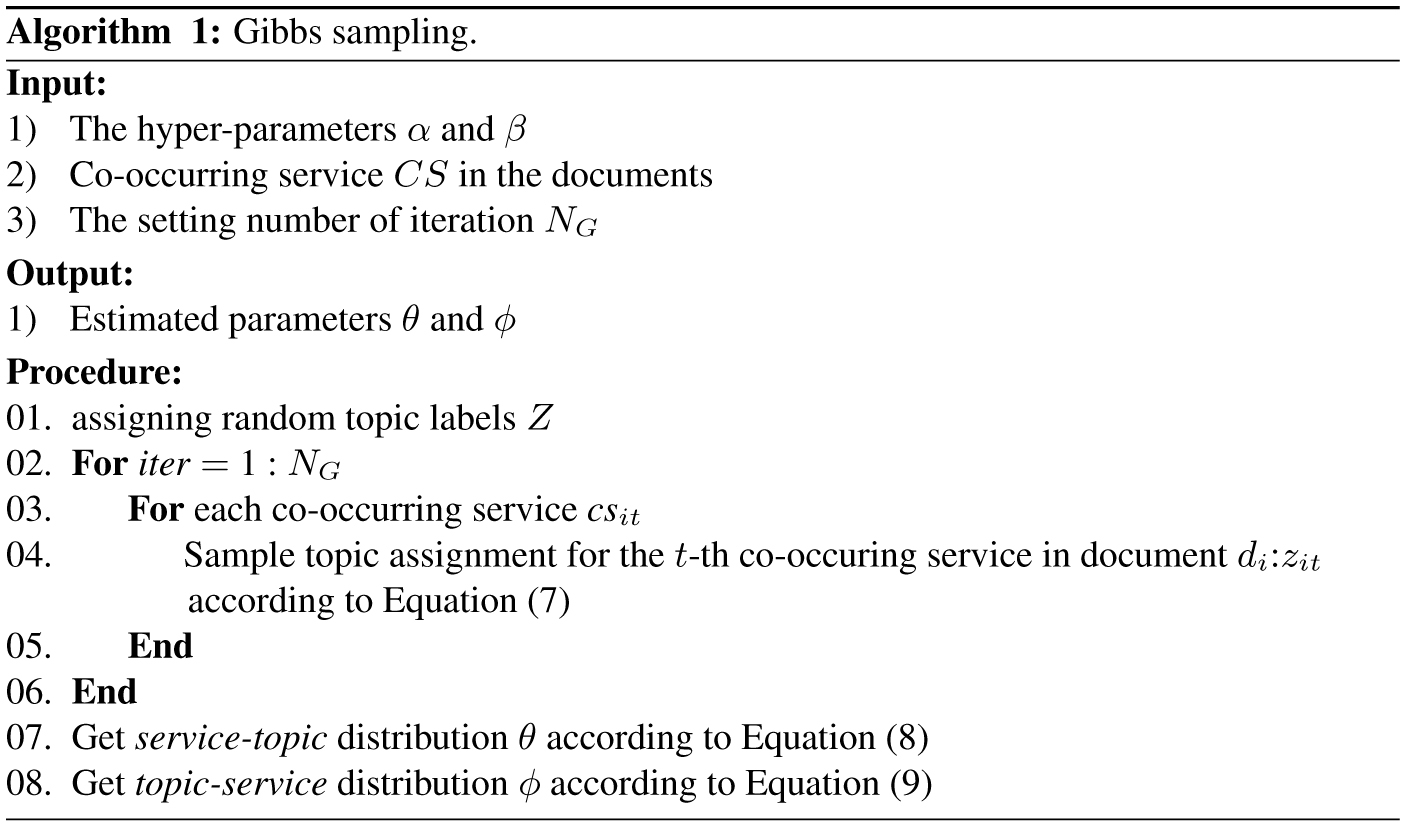
Like [20], we use the collapsed Gibbs sampling to make inferences with the SeCo-LDA part in our model. The sampling is initialized by assigning random topic labels Z and then updates them iteratively until reaching the setting number of iteration NG. In particular, for the t-th co-occurring service ss in the service co-occurrence document of si, the topic assignment is updated according to:
| (7) |
After the burn-in stage, the sampling converges to the true posterior distribution. Posterior expectation of θik and ϕjk could be described as:
| (8) |
| (9) |
In summary, the algorithm of applying Gibbs sampling to learn parameters is listed as Algorithm 1. Furthermore, the empirical posterior distribution of topics, which reflects the importance or popularity of topics in the service ecosystem (represented as Im(z)), is given by:
| (10) |
where nz is the time that the topic of a co-occurring service has been assigned to z.
Intuitively, Θ describes service-topic distribution, while Φ indicates topic-service distribution. They are the two key components in the model that would help to discover interesting insights about topics’ characteristics and topic dependencies.
4.2 Discovery of Service Co-occurrence Topics’ Characteristics
Topic importance is provided with the posterior distribution of topics in Equation 10. The list of representative services could be acquired with the ranked value of services based on topic-service distribution {ϕjk}, which reflects services’ popularity, or impact, on topic k.
When considering topics’ temporal strength, we use services’ impact distribution over time to describe topics’ temporal characteristics. Instead of counting the publication timestamps of service as in our previous work on SeCo-LDA [9], in this paper, we take into account the invocation time of services. The key intuition here is that if one service of a topic is invoked at t0, it makes actual contribution to the temporal strength of the topic at time t0, no matter when this service is published.
We represent the set of service s’s invoked time as , in which is the date (day as the unit) that service s is invoked by mashups for the j-th time; ins is the total times that s has been invoked. The accumulated temporal contribution of all services to topic z until time t0 forms the cumulative distribution function (CDF) of topic z as follows:
| (11) |
In service ecosystem, the unit of time is day, which is discrete. The probability mass function (PMF) for temporal distribution of z is:
| (12) |
The time expectation of topic z can be calculated as follows:
| (13) |
With topics’ time expectations, we can distinguish new topics from old ones, which will be helpful when calculating topic dependencies and building topic evolution graph.
4.3 Discovery of Topic Dependency
The key of EDC-SeCo-LDA is to discover dependencies between different service co-occurrence topics. According to Definition 3 and as shown in Figure 1, the probability of the occurrence of topic i conditioned on topic j is calculated by applying total probability formula as follows :
| (14) |
An intuitive explanation of the above formula is: whenever randomly drawing a service co-occurrence document of service s which contains topic j, and then generating another co-occurring service in this document (for service s), Pr(ki → kj|kj) is the probability that this co-occurring service is assigned with latent service co-occurrence topic i. In other words, Pr(ki → kj|kj) reflects the degree of topic i’s evolutionary influence on topic j (as shown in Figure 1).
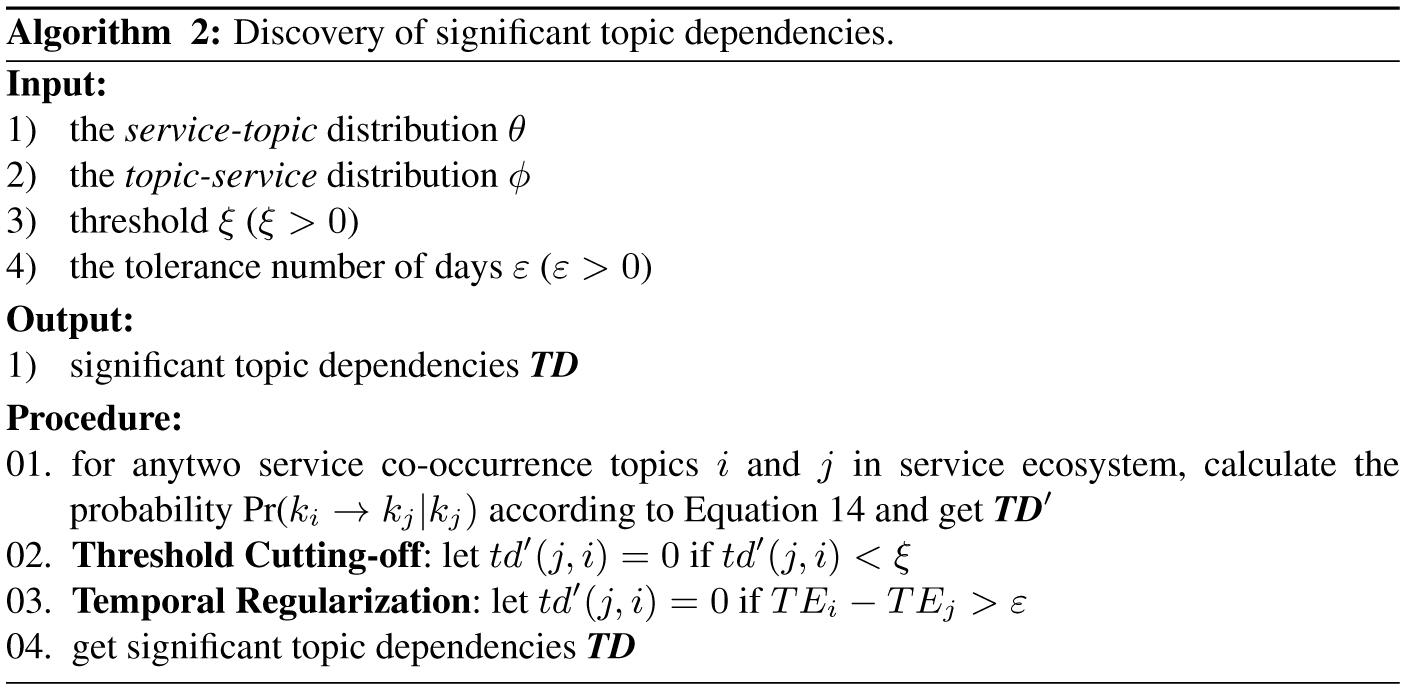
With topic-service and service-topic distribution, we can calculate this kind of directed coefficient between any two different topics according to Equation 14. Nevertheless, not all of the calculated dependencies are significant enough. On the one hand, topic dependencies whose values are relatively small might be noisy information and would hinder us from further analysis. On the other hand, as investigated in [21], we treat topic dependencies of relatively “new” topics on “old” ones as noisy information too. This is reasonable: a new topic should have little influence on an old one. To address these two types of situations, we design a two-step pruning process:
Step 1: Threshold Cutting-off. We set a threshold ξ and remove all the topic dependencies less than ξ in order to wipe out noisy information of little significance.
Step 2: Temporal Regularization. After threshold cutting-off, we set a tolerance number of days ε (ε > 0) of two different topics and make temporal regularization. Here we set ε to tolerate some degree of deviation for calculation. For a specific topic dependency td(j, i) > 0 from topic i to topic j, we prune it only if TEi − TEj > ε. To be more specific, if topic j is newer than topic i(TEi < TEj thus TEi − TEj < 0), we keep the dependency from i to j; if topic j is older than topic i, we only keep the dependency if the absolute difference between topic i’s time expectation and j’s is not larger than ε.
After pruning, the topic dependencies left in TD represent significant and meaningful directed dependency relationship between different service cooccurrence topics. In summary, the algorithm of achieving significant topic dependencies is summarized as Algorithm 2.
4.4 Construction of Topic Evolution Graph
According to Definition 5, we design the process of building topic evolution graph as follows:
Drawing the Nodes. Each node in the graph stands for a specific service co-occurrence topic. We set the size of these nodes in direct proportion to the topics’ importance. Similarly, we use a series of gradually varied colors to distinguish different topics’ time expectations.
Drawing the Edges. Each edge in the graph stands for a meaningful topic dependency. We draw the directed edges according to the pruned TD, whose thickness being in direct proportion to the value of topic dependencies.
Integrated Layout. To make the graph conciser and more intuitive, we apply Fruchterman-Reingold Algorithm [22] to the topic evolution graph’s integrated layout.
Following the above steps, we could draw topic evolution graph of a service ecosystem. Detailed experiments and explanations are provided in Section 5.
4.5 Dependency Compensation
4.5.1 Dependency compensation on a topic level
The goal to make dependency compensation is to highlight the particular characteristics of a topic. Considering the problem on a topic level, for a specific topic, we need to eliminate features that inherit from its parent topics, and strengthen the particular part of its distribution that may affect its child topics. In Section 3.5, we’ve extended our previous work [15] and proposed five different ways to make dependency compensation on a topic level.
Note that some of the compensated topic-service distributions may dissatisfy . It is caused by the compensation process, which, in a sense, makes adjustment of the topics’ importance in service ecosystem. Also, there may occur negative value in ϕ′(i), indicating the topic’s degree of rejecting specific service.
Examples of dependency compensation on a topic level are presented in Section 5, along with detailed comparisons and explanations.
4.5.2 Dependency compensation for recommendation
In Section 3.5, we’ve proposed five different ways of utilizing topic dependencies to make compensation on each topics’ topic-service distribution. In order to make comparisons among the five different ways (i.e., BDC, TDC, IDC, RIDC and 2GDC) and demonstrate that it is significant to make dependency compensation, we summarize the algorithm of making dependency compensation for service recommendation as Algorithm 3 on below.
Detail results of experiments on the service composition recommendation and comparisons about the five different dependency compensation methods are provided in the next section.
5 Experiments and Discussions
In this section, we will firstly introduce the ProgrammableWeb.com data set on which we apply EDC-SeCo-LDA model and conduct related experiments. We will not present detail results of individual topics and their characteristics, which are analogous to those in our previous work [9]. In this paper, we focus on discussing the experimental results about topic dependencies. Afterwards, we will provide results of building topic evolution graph and finding topic evolution patterns Then, we make profound discussion on the dependency compensation algorithms both from the aspect of topic distribution and service composition recommendation.
Further discussion about the number of topics and the threshold for dependency pruning are available.
5.1 Data Set
ProgrammableWeb.com has been accumulating a variety of services and mashups since established in 2005 [23, 24]. To evaluate our methodology we crawled the information of all service APIs and mashups from its inception (September 2005) to Dec 2016, including their descriptions and mashup-service usage records. Details of the data set received is presented in Table 1.
5.2 Basic Parameter Settings
Generally, parameters in this paper are set as Table 2. We will illustrate the chosen of related parameters for dependency compensation (i.e., λ, μ and η) in detail. What’s more, the influence of number of topics and pruning threshold will also be discussed.
Table 1 Data set of ProgrammabelWeb.com
| Total # of services | 14,012 |
| Total # of services that have been used by mashups | 1,243 |
| Total # of mashups | 6,301 |
| Average # of services in the mashups | 2.06 |
Table 2 Basic parameter settings for EDC-SeCo-LDA
| Parameter | Meaning | Setting Value |
| K | total number of topics | 35 |
| α | hyper-parameter | 50/K |
| β | hyper-parameter | 0.01 |
| NG | iteration number of Gibbs sampling | 1000 |
| ξ | threshold for dependency pruning | 0.07 |
| ε | tolerance number of two topics’ difference in days | 365 |
5.3 Discovery of Topic Dependencies
With Algorithm 1 and parameters set in Table 2, we can obtain service-topic and topic-service distributions. As described in [9], in some topics, several representative services may occupy a dominant position, regarded as core-service-oriented service co-occurrence topics. In other topics however, top representative services are not so dominant. The probability of occurrence of any topic conditioned on the other one can be calculated according to Equation 6, resulting in the original topic dependency matrix. To get a more significant result, a pruning process was performed as described in Algorithm 2.
We set the tolerance number of days ε = 365. Take Figure 1 as example, we prune the dependency from topic i to j only if TEi − TEj > ε. More specifically if topic j is newer than topic i(TEi < TEj thus TEi − TEj < 0), we keep the dependency from i to j; if topic j is older than topic i, we only keep the dependency if the absolute difference between topic i’s time expectation and j’s is not larger than ε. Intuitively, it is reasonable to set ε = 365, assuming that topics within one year could have an effect on each other. Later we will explain why ξ = 0.07 is an appropriate choice in Section 5.8.
With settings above, we could get 22 significant (directed) topic dependencies in ProgrammableWeb.com service ecosystem.
5.4 Building Topic Evolution Graph and Finding Evolution Patterns
5.4.1 Topic evolution graph
The topic evolution graph for ProgrammableWeb.com is shown in Figure 7. The coefficients are set as λ = −2 and μ = 1. The threshold for dependency pruning is set as ξ = 0.07. It is a proper parameter setting for BDC, which we will illustrate in detail later. We use a series of gradient colors from peach to green to express the difference of topics’ time expectations. The green nodes stand for relatively new topics, while the peach ones are old. The size of each node in the topic graph is proportional to the topics’ importance. And the thickness of directed line segments is proportional to the value of topic dependencies. As shown in Figure 7, there are 4 major topic groups. And except the four groups identified, other topics are individual ones without significant dependencies with other topics.
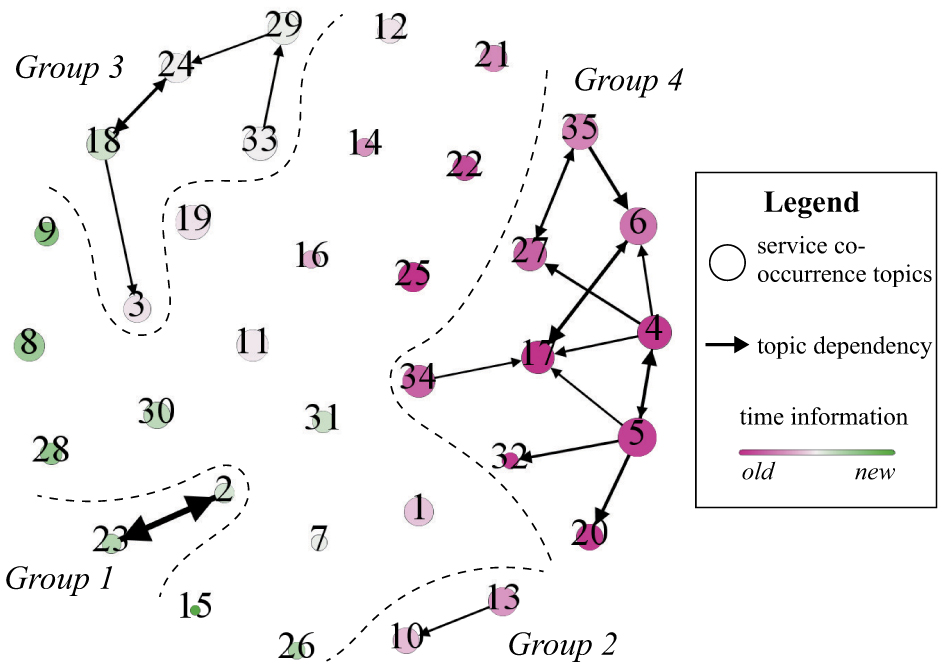
Figure 7 Topic Evolution Graph of ProgramrnableWeb.com with K = 35.
Table 3 Top 5 Representative Services For Topics 2 & 23 in Group 1
| Topic 2 (2.21%) | Topic 23 (2.11%) | ||
| ϕzs | Service Name | ϕzs | Service Name |
| 0.41733 | Twilio SMS | 0.54907 | Twilio |
| 0.18203 | 0.05895 | MailChimp | |
| 0.12876 | 0.04965 | Google App Engine | |
| 0.08585 | Google App Engine | 0.04189 | Heroku |
| 0.03109 | SendGrid | 0.03569 | SendGrid |
5.4.2 Discussion on group 1
- Topic 23 ⇔ Topic 2:
In Group 1 Topic 23 and Topic 2 constitute a “co-occur” pattern. Representative services and the corresponding topic-service distributions are listed in Table 3.
Table 4 Top 5 Representative Services For Topics 10 & 13 in Group 2
| Topic 10 (2.54%) | Topic 13 (3.17%) | ||
| ϕzs | Service Name | ϕzs | Service Name |
| 0.22888 | Google Analytics Managment | 0.27121 | Google AdSense |
| 0.11059 | Google AdSense | 0.10725 | Google Earth |
| 0.10159 | Google Webmaster Tools | 0.08663 | geocoder |
| 0.06044 | Google AdWords | 0.08044 | Oodle |
| 0.05016 | Bing Maps | 0.07116 | Google Ajax Feeds |
As shown in the above table, Topic 2 is Twilio SMS-centered and Topic 23 is Twilio-centered. After checking the original data crawled from website, we found that Twilio and Twilio SMS are actually the same service on voice and SMS message delivering. So it’s obvious that these two topics show similar time expectations and have strong dependency relationship on each other.
5.4.3 Discussion on group 2
Group 2 contains two topics: Topic 10 and Topic 13, whose representative services are listed in Table 4 along with the topic-service distributions.
- Topic 13 ⇒ Topic 10:
Topic 13, whose representative services are Google AdSense, Google AdWords, Google Earth, etc., is a Google service group that mainly focuses on on-line advertising. To improve the performance, it is necessary to track website visitors and evaluate the proposed advertisements’ effects. This is exactly what Google Analytics Management solves. In other words, service compositions of Topic 13 generate the demand for Google Analytics Management. And since it appeared, developers began to invoke it with other Google services (especially Google AdSense) to promote the performance of advertisement, which makes it easy to understand that Topic 13 has influence on (or generates) Topic 10, a Google Analytics Management-centered Google service group. That is to say to cater to the changing needs of users, service compositions of Topic 10 gradually generated Topic 13. The colors of Topics are different in depth, telling us that Topic 13 is a relative old topic. It is easy to find out that the above discussion is in conformity with the facts.
5.4.4 Discussion on group 3
Topics in Group 3 are relatively new, revealing the trend of service composition on social network sharing with text or multimedia information. The representative services of Topics 33, 29, 24, 18 and 3 are listed in Table 5 along with the topic-service distributions. To make the tabular matter more neatly we use abbreviations for some long name services as illustrated in the footnote of Table 5.
- Topic 33 ⇒ Topic 29:
Table 5 Top 5 Representative Services For Topics 33, 29, 24, 18 & 3 in Group 3
| Topic 33 4.22% |
Topic 29 3.12% |
Topic 24 2.78% |
Topic 18 3.30% |
Topic 3 3.66% |
|||||
| ϕzs | Service | ϕzs | Service | ϕzs | Service | ϕzs | Service | ϕzs | Service |
| 0.051 | foursquare | 0.274 | Last.fm | 0.696 | 0.831 | 0.825 | |||
| 0.051 | Sound-Cloud | 0.212 | 0.243 | 0.054 | GAM2 | 0.047 | Facebook Graph | ||
| 0.049 | del.icio.us | 0.121 | Bit.ly | 0.006 | OMD1 | 0.034 | del.icio.us | 0.030 | |
| 0.047 | Tumblr | 0.096 | Tumblr | 0.005 | Bing | 0.016 | GAL3 | 0.030 | GAM2 |
| 0.044 | Gravatar | 0.076 | Google Plus | 0.005 | Daylife | 0.010 | Eventful | 0.010 | YMI4 |
| 1OMD is the abbreviation for Open Movie Database. | |||||||||
| 2GAM is the abbreviation for Google Analytics Management. | |||||||||
| 3GAL is the abbreviation for Google AJAX Libraries. | |||||||||
| 4YMI is the abbreviation for Yahoo Map Image. | |||||||||
Topic 33 provides a set of tools that are invoked together often, e.g., foursquare Sound-Clouddel.icio.us etc. foursquare grants access to the company’s database of locations as well as information on venue check in’s. With the help of SoundClouds SDKs, it’s easy to integrate functionality like audio sharing and recording directly into iOS, Android and web apps. What’s more, del.icio.us make people able to use tags to organize and remember their bookmarks, which is a much more flexible system than folders. Developers used them to create mashups, thus Topic 33 appeared.
Then, new kinds of social network platforms were created (i.e., Last.fm and LinkedIn) and co-occurred more frequently and they appeared to co-occur with other tools more frequently illustrated by Topic 29. Last.fm is a music-based on-line society established in 2000. The API of Last.fm provide read and write access to the full slate of lastfm music data resources. Launched in 2003, LinkedIn allows registered users to maintain a list of contact details of people with whom they have some level of relationship, called connections. As a extension of Topic 33, Topic 29 describes service compositions of leveraging all kinds of tools with the core two services to realize significant functionalities.
- Topic 29 ⇒ Topic 24:
Afterwards, developers began to combine Twitter and Facebook with other services to enrich social network’s functionality generating, Twit-ter-and-Facebook-centered Topic 24. Compared with Last.fm (2000) and LinkedIn (2003), Twitter (2006) and Facebook (2004) were created later, and they focus on people’s social network from a different view. After they established, people intend to use their APIs to make significant service compositions about social network.
- Topic 24 ⇔ Topic 18 ⇒ Topic 3:
Here Topic 24 and Topic 18 have a “co-occur” pattern. Topic 18 is Facebook-centered, service compositions of which mainly utilize Google Analytics Management API to leverage Google’s extensive website analytics tools. Topic 29 and Topic 18 have an effect on each other. And Topic 18 has inspired people to leverage Google Analytics Management as well as other APIs (e.g., Instagram, Facebook Graph and YMI) to enrich the functionalities of Twitter, paying more attention to graph information. As a result of which, service compositions of Topic 3 gradually emerged.
Table 6 Top 5 Representative Services For Tow Core Topics 4 & 5 in Group 4
| Topic 4 (3.90%) | Topic 5 (4.39%) | ||
| ϕzs | Service Name | ϕzs | Service Name |
| 0.84079 | Google Maps | 0.13406 | GeoNames |
| 0.09818 | Wikipedia | 0.09906 | Panoramio |
| 0.01259 | Weather Channel | 0.08342 | Microsoft Bing Maps |
| 0.01008 | Zazzle | 0.08193 | Eventful |
| 0.00420 | OpinionCrawl Sentiment Analysis | 0.06406 | Yelp |
As shown by the color in Figure 7, though Topic 18 is newer than Topic 3, we still keep the dependency relationship from Topic 18 to Topic 3 since their difference in time expectation is within ε.
5.4.5 Discussion on group 4
Group 4 is the biggest group in the graph, composed of relatively older topics and revealing the trend of location-aware information storing, sharing, searching and recommending. Two core topics of this group are Topics 4 & 5, which have high topic importance and have evolutionary influence on many other topics. Their representative services are listed in Table 6. Topic 4 is a Google Maps-centered topic, and Topic 5 reflects service composition about geographical databases, containing all kinds of information about each site.
- Topics 4, 5, 6 and 34 ⇒ Topic 17 (Example Merge Pattern):
An obvious “merge” evolution pattern shown here is that Topic 17 is generated from Topics 4, 5, 6 and 34. Topic 6 is about YouTube-centered product advertising. Topic 34, whose representative services are del.icio.us and eBay, is about the organization of online information. Together with Topics 4 and 5, the four topics generated Topic 17, which is Flickr-centered. Flickr can organize photos according to interpersonal relationship or content relation, and provide some functionality of social network. In other words, its function is a combination of Topics 4, 5, 6 and 34, which shows an example of service composition about location-aware information sharing and recommending.
- Topics 5 ⇒ Topics 17, 32 and 20 (Example Branch Pattern):
A representative “branch” evolution pattern is that Topic 5 branched into Topics 17, 32 and 20. Topic 32 reveals service composition about property business based on location information; and Topic 20 reveals web tools that are frequently used together with Google Maps. Topics 17, 32 and 20 are the finer-grained functional extension of Topic 5.
5.4.6 Summary of composition trends
From the topic evolution graph, we could in general identify the trend of service composition patterns of ProgrammableWeb.com from 2005 till now. Supported by services like Google Maps, location-aware information storing, sharing, searching and recommending (Group 4) was a popular service composition trend in earlier days. In recent years, however, developers prefer to make service compositions to realize sharing text or multimedia information in social networks (Group 3).
5.5 Discussion of Dependency Compensation on Topic Distribution
As we pointed out in Section 3.5, the goal of making topic dependency compensation is to weaken the inherited characteristics between topics and highlight the characteristics of each topic itself. Before evaluating the performance of recommendation for service compositions with dependency compensation, we study the influence of dependency compensation on a topic level. As the discussion in Section 5.4, we take the results of BDC here with the same parameter settings.
As mentioned in Section 5.4.3, there is significant dependency relationship from Topic 13 to Topic 10. Applying Equation 1, we could get the compensated topic-service distributions for Topics 13 and 10. In order to make a more intuitive comparison between compensated distributions and original ones, we normalize the compensated topic-service distributions. The experimental results are presented as Table 7.
As we discussed before, Topic 13 has an evolutionary influence on Topic 10. In short, compositions around Google Adsense promote the appearance of Google Analytics Managment. Topic 13 is a Google Adsense-centered topic. After dependency compensation, the particular features of its own have been highlighted, i.e., the importance (probability) of Google Adsense has been increased. Topic 10 has weakened the influence of Topic 13, Google Adsense has less importance and drops one in the rankings of compensated distribution of Topic 10. Meanwhile, Topic 10’s own characteristics have been strengthened, shown as the increase of Google Analytics Managment’s importance.
Table 7 Compensated and Original Topic-Service Distributions For Topics 10 & 13
| Topic 10 (original) | Topic 10 (compensated) | ||
| ϕzs | Service Name | ϕzs | Service Name |
| 0.22888 | Google Analytics Managment | 0.24845 | ↑ Google Analytics Managment |
| 0.11059 | Google AdSense | 0.11028 | Google Webmaster Tools |
| 0.10159 | Google Webmaster Tools | 0.09685 | ↓ Google AdSense |
| 0.06044 | Google AdWords | 0.05962 | Google AdWords |
| 0.05016 | Bing Maps | 0.05445 | Bing Maps |
| Topic 13 (original) | Topic 13 (compensated) | ||
| ϕzs | Service Name | ϕzs | Service Name |
| 0.27121 | Google AdSense | 0.28493 | ↑ Google AdSense |
| 0.10725 | Google Earth | 0.11641 | Google Earth |
| 0.08663 | geocoder | 0.09403 | geocoder |
| 0.08044 | Oodle | 0.08731 | Oodle |
| 0.07116 | Google Ajax Feeds | 0.07724 | Google Ajax Feeds |
5.6 Discussion of Dependency Compensation on Service Recommendation
5.6.1 Evaluation metrics
MAP (Mean Average Precision) [25] was used as the basic evaluation metric for recommen- dation in this part:
| (15) |
where S denotes the set of testing services; N represents the recommended number of services; SCi denotes the co-occurring services of service i. For each s ∈ SCi, r(s) refers to the ranking position of s in recommended list and n(s) represents the number of co-occurring services in SCi that rank higher than or equal to s in recommendation list. MAP is a real number between 0 and 1. The higher MAP indicates a better accuracy of the recommendation method. In reality, most mashups in data set contain less than five services, so we make N vary from 1 to 8 when doing experiments on recommendation. What’s more, we extend basic MAP@N to define three metrics to help us compare the five different dependency compensation methods from different aspects, listed as follows:
- MEAN_MAP@1-4: the average of MAP@N, where N = 1 ... 4;
- MEANJMAP@5-8: the average of MAP@N, where N = 5 ... 8;
- MEAN_MAP@1-8: the average of MAP@N, where N = 1 ... 8.
Generally, MEAN_MAP@1-4 gives the evaluation of algorithms when we only consider the top candidates on the recommendation list, while MEANJMAP@5-8 focuses on the performance of recommending more services (5-8). MEAN_MAP@1-8 comprehensively evaluates the algorithms with N ranging from 1 to 8.
5.6.2 Parameter setting and comparison results of five DC methods
- Basic Dependency Compensation (BDC)
We design experiments to verify the intuitive guess that λ might be a negative value (λ < 0), and μ be positive (μ > 0), which is proposed in Section 3.5.1.
To determine the sign of parent-side coefficient λ, setting μ = 0, we made λ vary from −4 to 4 with interval 0.5 to make dependency compensation and recommend for service compositions. Other parameters are set as Table 2. We calculate the MEAN_MAP@1-8 to evaluate the performance roughly. And we compare the results with the baseline of [9], which also utilizes service co-occurrence topcis to make recommendation but doesn’t consider dependency information. Their differences in MEAN_MAP@1-8 are presented as shown in Figure 8. Similar experiment with μ, is conducted as shown in Figure 9. The results of Figures 8 and 9 have proved that when λ < 0 and μ > 0 with proper values, the dependency relationship could contribute to recommendation. The experimental results consists with our previous intuitive guess.
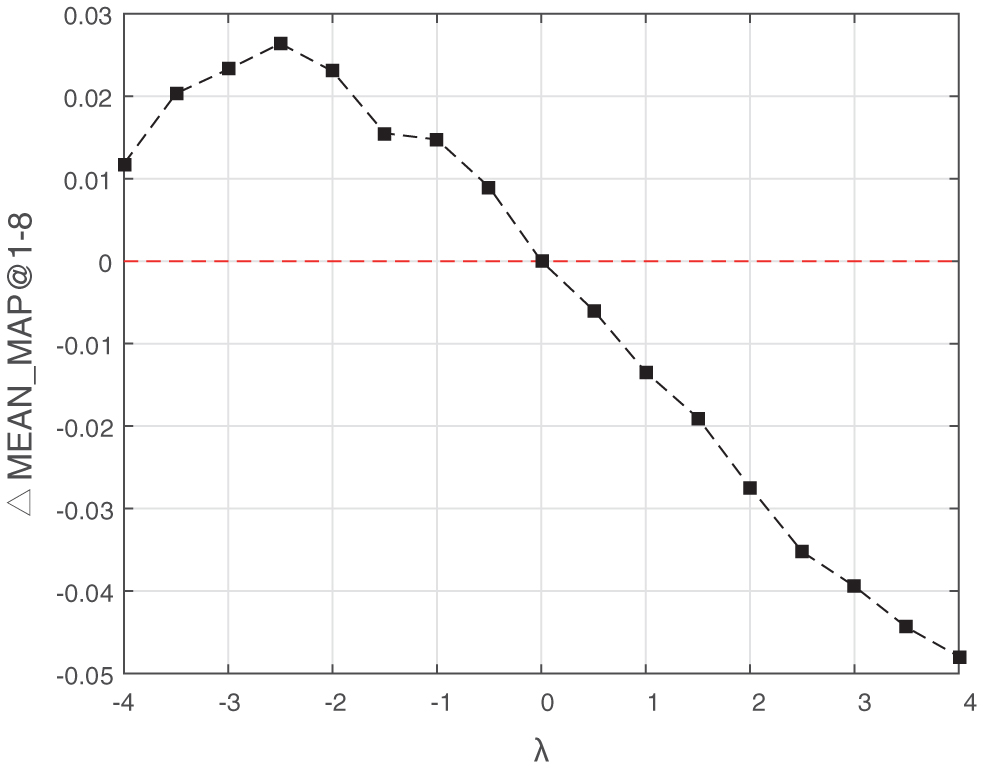
Figure 8 ΔMEAN_MAP@1-8 with different λ (μ = 0) in BDC.
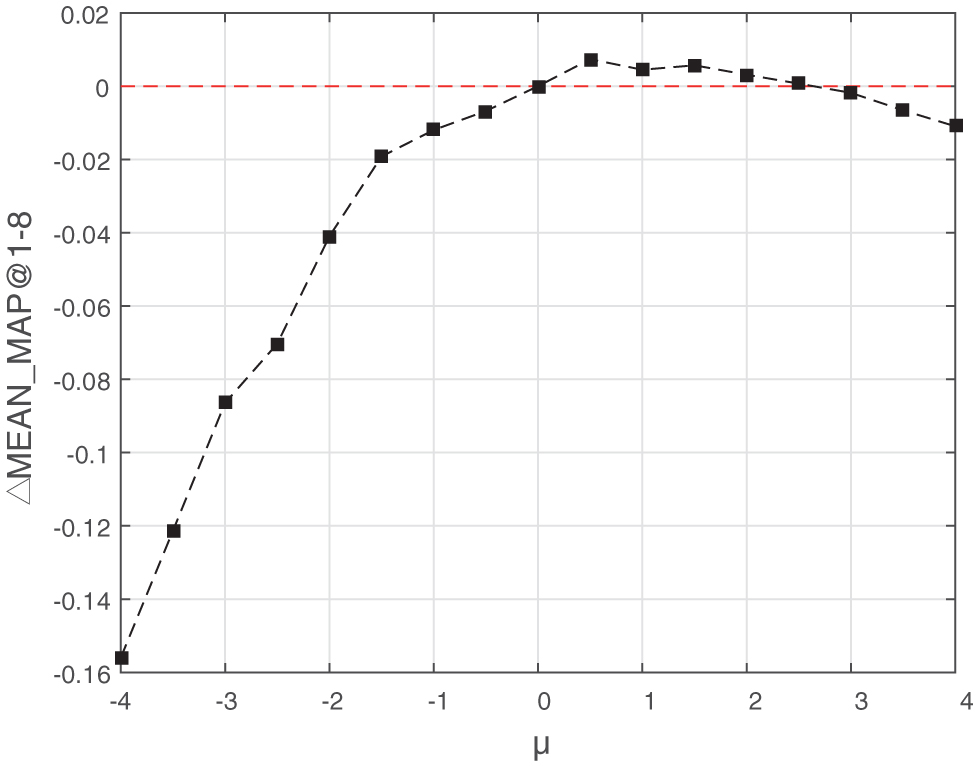
Figure 9 ΔMEAN_MAP@1-8 with different μ(λ = 0) in BDC.
To find the most proper values of λ and μ, we make λ vary from −4 to 4 with interval 0.5 and the same for μ. The highest MAP with the value of coefficients will be presented later.
- Time-decaying Dependency Compensation (TDC)
In EDC-SeCo-LDA, the basic unit of topics’ time expectations is day. To verify that it is significant to consider time-decaying problem, with λ = −4 and μ = 2, we make the time-decaying coefficient η defined in Equation 2 vary from 0 to 0.02 with interval 0.001. MEAN_MAP@1-8 results with different value of η are presented in Figure 10. The red line in the figure stands for the result of baseline as in [9].
Figure 10 demonstrates that it is significant to take time decay into consideration, and MEAN_MAP@1-8 achieves the highest value when η = 0.03. Further, to find the most proper values of λ and μ, we also make grid search with parameters λ, μ, and η. The highest MAP with the value of coefficients will be presented later.
- Importance-based Dependency Compensation (IDC)
As in Equation 3, we introduce K · Im(z) to consider the influence of topics’ importance on dependency compensation. Grid search of parameters λ and μ has been conducted. The highest MAP with the value of coefficients will be presented later.
- Relative-Importance-based Dependency Compensation (RIDC)
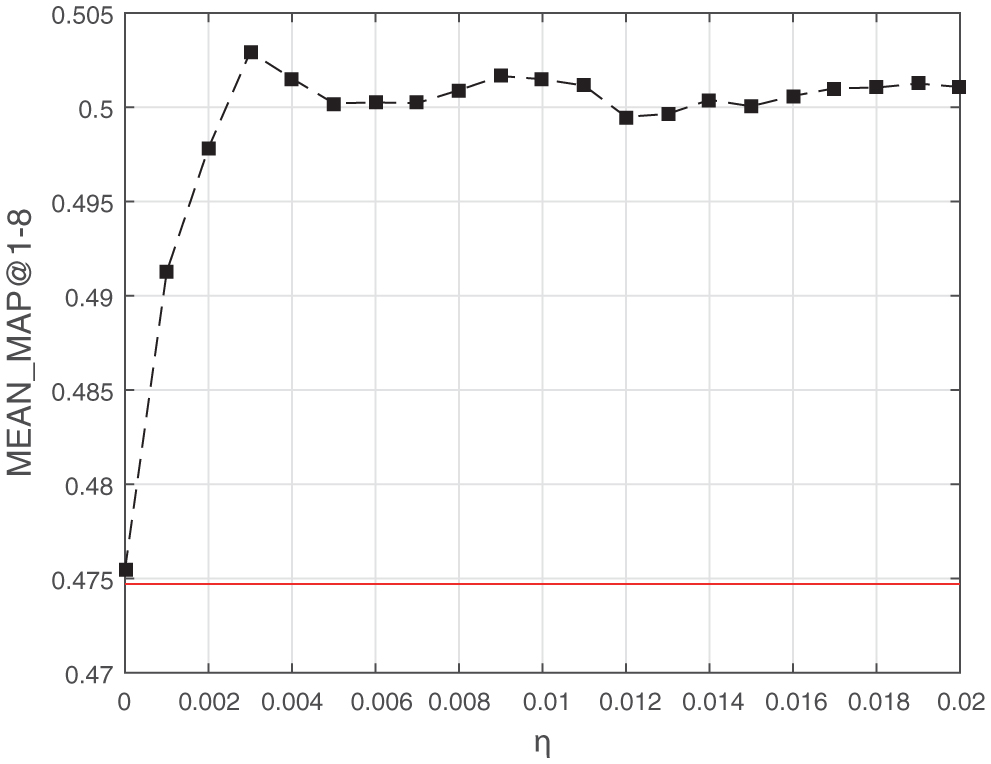
Figure 10 MEAN_MAP@1-8 with different η in TDC.
RIDC is similar with IDC, only with the difference that it utilize related importance of topics when making dependency compensation. Grid search of parameters λ and μ has been conducted. The highest MAP with the value of coefficients will be presented later.
- 2GDC
2GDC considers dependencies more than one “generation.” As explained in Figure 6, based on BDC, we design 2GDC to take more evolutionary information into consideration. Grid search of parameters λ and μ has been conducted. The highest MAP with the value of coefficients will be presented next.
- Comprehensive Comparison
Based on the three metrics of MEAN_MAP@1-4, MEAN_MAP@5-8 and MEAN_MAP@1-8, we conduct grid searches for the parameters of different dependency compensation methods and record the highest value for each metric, shown as follows.
From results above, we could conclude that in general, with dependency compensation, the performance of recommendation has been improved. Among the five dependency compensation methods, IDC works best. To be more specifically, when focusing on the top 4 candidates on the recommendation list (MEAN_MAP@1-4), IDC has improved approximately 10% compared with the baseline. And it also makes a 4% improvement when recommending 5-8 candidates. Overall, IDC gets approximately 6% improvement compared to baseline in [9]. More baselines will be introduced in the following part, provided with detailed discussions.
5.6.3 Comparison with baselines
To further find out whether it is significant to make dependency compensation when recommending for service compositions, we introduce our work of SeCo-LDA as Baseline 1, along with other baselines in [9]. Proposed methods with dependency compensation in this paper are represented as BDC, TDC, IDC, RIDC and 2GDC separately.
Baseline Method 1: SeCo-LDA. In [9], for a selected service sl, we calculate its expected co-occurrence with other services, using Φ instead of Φ′. In other words, there is no consideration about dependency compensation. We give the results of recommendation for service composition as a service list .
Baseline Method 2: AA. Apriori Algorithm (AA) [26] is a commonly-used technique to mine association rules. In this approach, each mashup is represented as the union of annotated tags of its component services. Apriori could mine positive rules of tags from the transactions of mashups [27]. The probability of composition of any two services s1 ∈ S and s2 ∈ S is estimated as:
| (16) |
where R(s1, s2) denotes the rules that are satisfied by < s1, s2 >, which means s1 and s2 appear together in the rules. β is a weighting coefficient. The higher F(s1, s2) is, the more possiblely that a composition of s1 and s2 would appear. For a selected service sl, its recommended service list can be described as RLAA = {sl1, sl2, ... |F(sl, sl1) ≥ F(sl, sl2) ≥ ...}.
Baseline Method 3: CMSD. Using Content Matching based on Service Description (CMSD) [12, 28], based on service word descriptions, we apply the LDA model to calculate the semantic similarities between the selected service and others. We also run Gibbs sampling to get probability distribution of services over topics p2(z|s) and topics over words p2(w|z).
When a selected service sl comes up, CMSD calculates the semantic similarity between sl and another service si ∈ S, which is described as SWi = {wi1, wi2, ..., wini}, as follows:
| (17) |
Services with higher semantic similarities are preferred to be recommended. The recommendation list is: RLCMSD = {sl1, sl2, ... |pCM(sl1|sl) ≥ pCM(sl2|sl) ≥ ...}.
Baseline Method 3: MUR-LDA. We apply LDA directly using Mashup-service Usage Records (MUR-LDA). That is we regard mashups as documents and services as word tokens, which is similar with [29]. We model the generation of services in mashups with a probabilistic topic model. Using collapsed Gibbs sampling, we can get the probability distribution of mashups over topics p3(z|m) and topics over services p3(s|z). For a selected service sl, we could calculate its expected co-occurrences with another service si ∈ S:
| (18) |
where p(m|sl) stands for the probability of mashup mm given service sl. It could be calculated using Bayes theorem. The recommended service list is ranked by the value of c3(l, i): RLMUR = {sl1, sl2, ...|c3(l, sl1) ≥ c3(l, sl2) ≥ ...}.
The MAP results of EDC-SeCo-LDA and baselines with different numbers of N are shown in Figure 11. Parameters for dependency compensation methods are set as the MEAN_MAP@1-8 column in Table 8.
On the one hand, considering the four baseline methods with no dependency compensation, CMSD only uses the word description of services to reveal latent semantic topics and make recommendation. Experiments show that its MAP value is the lowest among the four methods, indicating that the description of services might not be a good indicator of service composition patterns individually. The other three methods take the usage records of services into consideration. AA is the most popular model to draw association rules, which has a higher MAP value than CMSD as shown in Figure 11. MUR-LDA and SeCo-LDA models both use topic model to analyze the association relationship of services in the system. But the core difference is that MUR-LDA regards mashups as documents and containing services as word tokens, while SeCo-LDA models regard services as documents and its co-occurring services as word tokens. MUR-LDA may come up with the sparsity problem for that most mashups usually contain less than five services. As a result of which, SeCo-LDA achieves the best performance among the four baselines.
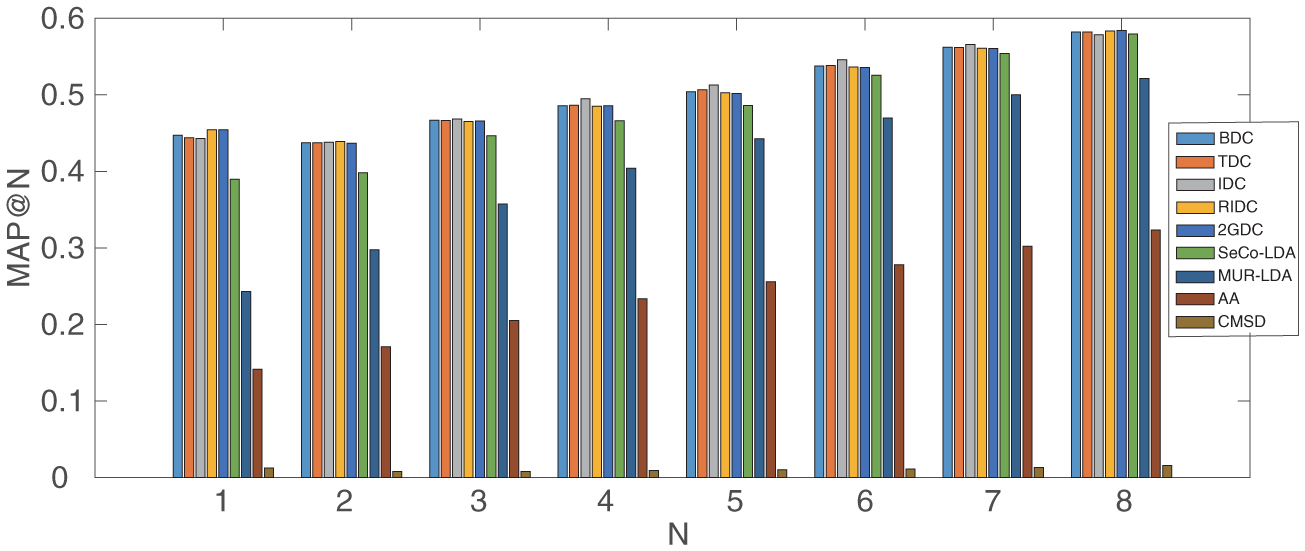
Figure 11 The MAP for EDC-SeCo-LDA models (i.e., BDC, TDC, IDC, RIDC and 2GDC), MUR-LDA, AA and CMSD with Different Number of N.
Table 8 Comprehensive Comparison for Five DC Methods
| MEAN_MAP@1-4 | MEAN_MAP@5-8 | MEAN_MAP@1-8 | |
| Baseline1 | 0.4158 | 0.5336 | 0.4747 |
| BDC | 0.4593 | 0.5465 | 0.5029 |
| parameters | λ = −2, μ = 1 | λ = −2, μ = 1 | λ = −2, μ = 1 |
| TDC | 0.4597 | 0.5479 | 0.5029 |
| parameters | λ = −3, μ = 1, η = 0.01 | λ = −4, μ = 1.5, η = 0.014 | λ = −4, μ = 2, η = 0.003 |
| IDC | 0.4614 | 0.5508 | 0.5060 |
| parameters | λ = −1.5, μ = 0.5 | λ = −2, μ = 0.5 | λ = −2, μ = 0.5 |
| RIDC | 0.4609 | 0.5473 | 0.5034 |
| parameters | λ = −1:5, μ = 1 | λ = −2, μ = 1 | λ = −1:5, μ = 1 |
| 2GDC | 0.4606 | 0.5455 | 0.5031 |
| parameters | λ = −1.5, μ = 1 | λ = −1.5, μ = 1 | λ = −1.5, μ = 1 |
| 1We use SeCo-LDA in [9] as baseline here. | |||
On the other hand, with dependency compensation (i.e., BDC, TDC, IDC, RIDC and 2GDC), the performance have improved significantly compared with baseline methods, especially when N is relatively small. Taking information of time decaying, topic importance and 2 generation’s evolutionary influence into consideration, TDC, IDC, RIDC and 2GDC achieve higher performance than BDC. With results listed in Table 8, in sum, IDC could get the highest among the five dependency compensation methods when recommending for service compositions, approximately 6% better than SeCo-LDA, and 1% better than BDC using metric MEAN_MAP@1-8.
5.7 Discussion of Topic K
The total number of topics K is an important parameter in topic models. When applying probabilistic generative model on the service co-occurrence documents, our goal is to achieve high likelihood of the corpus as in [20]. In particular, we computed the perplexity of the corpus to evaluate the models. And then we verify the result by comparing the MAP value of BDC with different number of topics.
5.7.1 Influence of K on perplexity
The perplexity, used by conventional language modeling, is monotonically decreasing in the likelihood of the test data, and is algebraicly equivalent to the inverse of the geometric mean per-word likelihood. Generally, a lower perplexity score indicates better generation performance. For a set of M documents, the perplexity is described as:
| (19) |
where wd is the word vector of document d, and the probability of the word vector p(wd) could be calculated as p(wd) = Πn ∑z p(wdn|topic = z) · p(topic = z|d).
With other parameters fixed, perplexity with different numbers of topics for EDC-SeCo-LDA is presented in Figure 12. The lowest perplexity is got when the number of topics is 35. So when doing experiments afterwards, we set the number of topics for EDC-SeCo-LDA as 35.
5.7.2 Influence of K on recommendation
To verify the significance of parameter setting for K, we conduct experiments to find out the influence of K on the performance of recommendation. Take BDC as example. With other parameters fixed, the results of MEAN_MAP@1-8 with different number of K is shown as Figure 13. From the results we could conclude that K = 35 is a proper choice, which consists with the conclusion of Section 5.7.1.
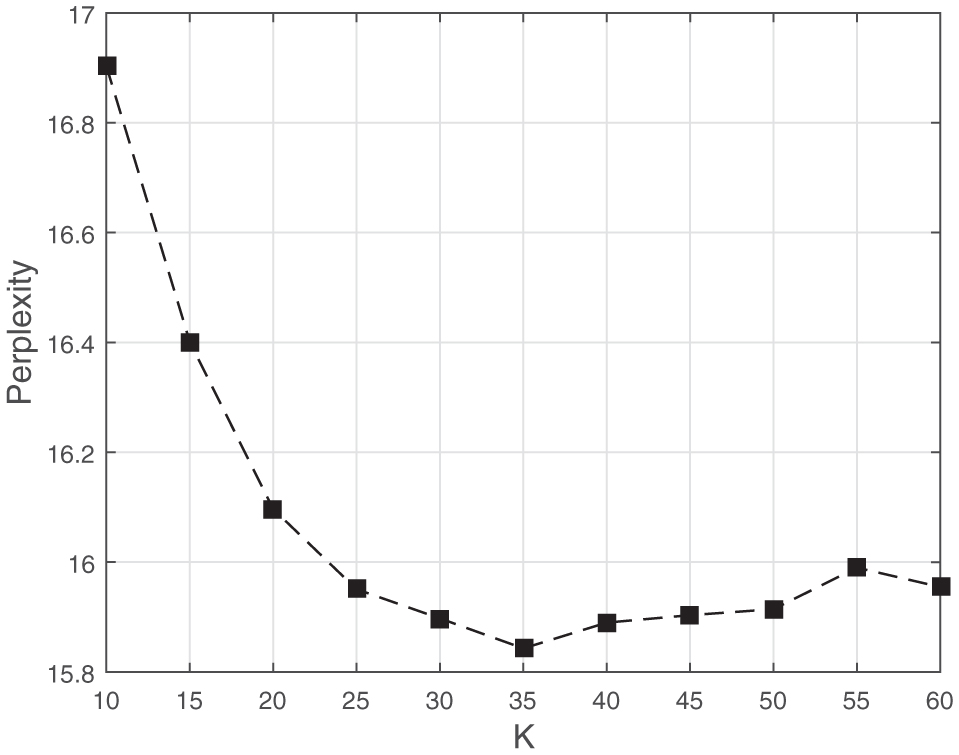
Figure 12 Perplexity for EDC-SeCo-LDA with different number of K.
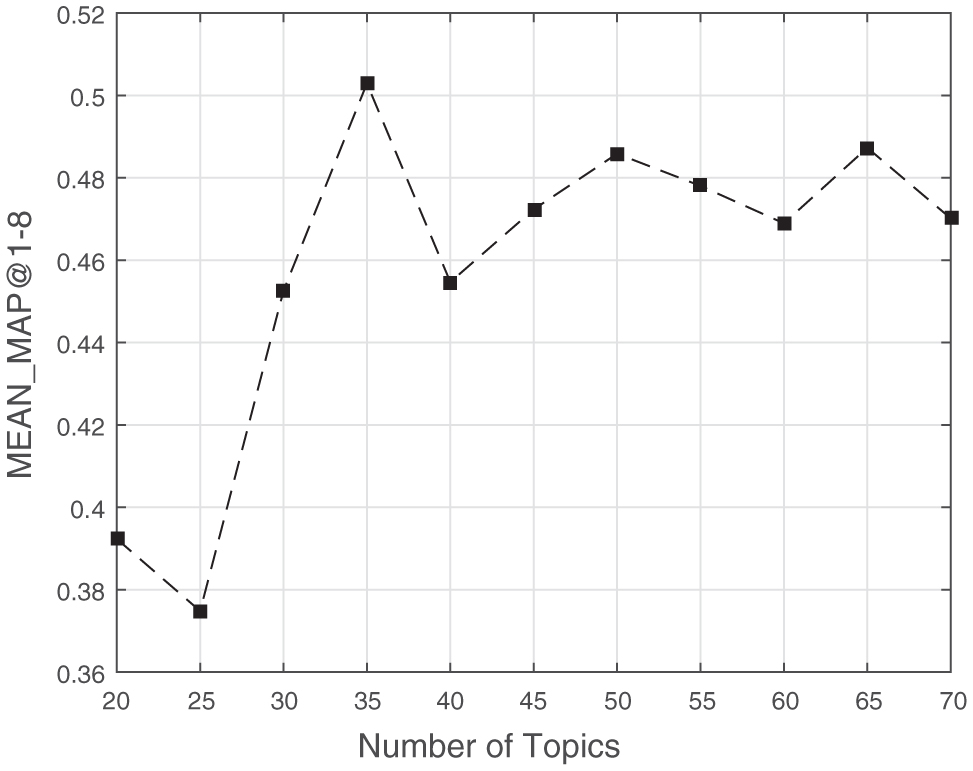
Figure 13 MEAN_M-AP@1-8 for EDC-SeCo-LDA with different number of K.
5.8 Discussion of Threshold
To get significant topic dependencies, it is necessary to apply the two-step pruning process as described in Algorithm 2. Intuitively, ξ should be set a proper value so that the results make sense. If ξ was too small, there might be too many dependencies left after pruning, containing noisy information and hindering people from understanding the trend of service compositions; if ξ was set a relatively higher value, the number of topic dependencies may be very small, losing some important information about topic evolutionary characteristics.

Figure 14 MEAN_MAP@1-8 with different ξ in BDC.
Intuitively, we set ξ = 0.07. After pruning processes, we have 22 significant topic dependencies left. And we think it is a proper value. To verify it, for convenience, we also take BDC as example. With other parameters fixed (N = 35, λ = −2 and μ, = 1), we let ξ vary from 0.01 to 0.08 with interval 0.005, and recorded the results of MEAN_M-AP@1-8 shown as in Figure 14. With the results, we could conclude that ξ = 0.07 is a proper choice, pruning dependencies that are some kind of noisy information and leaving significant ones. As a result, we set ξ = 0.07 in our previous experiments.
5.9 Conclusion of Experiments
In Section 5, we conduct a series of experiments on a real-world data set Programmable-Web.com. We list basic parameter settings and present the results of mining significant topic dependencies. With the topic evolution graph and results of topics’ representative services, we give detailed explanations of the evolution patterns in the service ecosystem. We make discussions of dependency compensation on topic distribution, showing that dependency compensation could highlight each topic’s particular characteristics intuitively Then, we continue discussing dependency compensation from the aspect of service recommendation. We introduce four baseline methods, and compare the five dependency compensation methods using MAP as the metric. Experiments show that EDC-SeCo-LDA could improve the performance of service composition recommendation significantly. And among them, IDC gets the highest MAP value, approximately 6% better than SeCo-LDA and 1% better than BDC using metric MEAN_M-AP@1-8. Last but not least, we conduct experiments to illustrate how to choose the proper value of N and ξ in EDC-SeCo-LDA.
In summary, with EDC-SeCo-LDA, we could discover significant directed dependency relationship between topics, and make dependency compensation to promote the performance of recommendation for service composition.
6 Related Work
Most researches on service evolution focus on analyzing the impact of single service’s changes and how to deal with the version problem to ensure system stability. Different service changes have been examined in [1] to construct a unifying theoretical framework for controlling the evolution of services. Usage Profile has been used to evaluate service changes impact [3, 4]. Paper [3] discusses the adoption of usage profiles and presents a framework for the automatic evaluation of service changes impact during its lifecycle. Paper [4] proposes a change management framework that supports service providers to scope and quantify the impact of changes based on usage analysis. The framework adopts a finer-grained versioning model in order to easily locate and assess the compatibility of changes in service descriptions. The framework also clusters client applications based on similar patterns of usage, summarizing them in usage profiles. Changes to the WSDL specification of a service interface have been considered in [5] and [6]. In [5], results of an empirical study on WSDL evolution analysis are presented. A tool called WSDLDiff is proposed in [6] to extract fine-grained changes from subsequent versions of a web service interface defined in WSDL. In contrast to existing approaches, WSDLDiff takes into account the syntax of WSDL and extracts the WSDL elements affected by changes and the types of changes. An impact analysis model based on service dependency is proposed in [7] to discovery the way in which the change affects the services. Four service evolution patterns (i.e., compatibility, transition, split-map, and merge-map) are proposed in [8] to estimate the impact changes to services. However, few have considered to discover the latent trend of service composition in service system and find out topic dependencies and topic evolution patterns.
Some popular topic models could revel semantic topics considering time information, such as Dynamic Topic Model [10] and Correlated Topic Model [11]. However, with their results, we can only get the undirected semantic similarities of topics, which is a kind of undirected relationship and quite different from the directed “topic dependency” defined in this paper.
7 Conclusions
In this paper, we have extended our previous work and proposed a novel approach to discover and make analysis about the evolution of service composition patterns. The key idea is to define and calculate “topic dependencies” with topic-service and service-topic distributions. Our work in this paper includes three parts: (1) defining “topic dependencies” and calculating them with EDC-SeCo-LDA model; (2) drawing topic evolution graph and finding topic evolution patterns; (3) designing five different methods to make dependency compensation to improve the performance of recommendation for service compositions.
Experiments on a real-world data set ProgrammableWeb.com have verified the rationality and effectiveness of EDC-SeCo-LDA. Topic dependencies would help developers to understand the trend of service composition patterns in a service ecosystem. Comparison with baseline approaches also demonstrate that due to dependency compensation, Importance-based Dependency Compensation (IDC) performs 6% better than baseline SeCo-LDA and 2% better than BDC in terms of MAP when recommending for service composition.
In the future, leveraging information about service co-occurrence topics such as topics’ representative description words, we plan to design a framework to deal with service-side cold-start problem.
Acknowledgements
This research has been partially supported by the National Natural Science Foundation of China (No. 61673230 and No. 41876098), the Research Fund for the High-tech Shipbuilding (17GC26102.01) and Shenzhen Science and Technology Project (No. JCYJ20151117173236192).
References
1. V. Andrikopoulos, S. Benbernou, and M. P. Papazoglou (2012), On the evolution of services, IEEE Transactions on Software Engineering, Vol. 38, no. 3, pp. 609–628.
2. X. Liu, Y. Hui, W. Sun, and H. Liang (2007), Towards service composition based on mashup, in Proceedings of IEEE World Congress on Services (SERVICES), pp. 332–339.
3. M. Yamashita, K. Becker, and R. Galante (2011), Service evolution management based on usage profile, in Proceedings of IEEE International Conference on Web Services (ICWS), pp. 746–747.
4. M. Yamashita, B. Vollino, K. Becker, and R. Galante (2012), Measuring change impact based on usage profiles, in Proceedings of IEEE International Conference on Web Services, pp. 226–233.
5. M. Fokaefs, R. Mikhaiel, N. Tsantalis, E. Stroulia, and A. Lau (2011), An empirical study on web service evolution, in Proceedings of IEEE International Conference on Web Services (ICWS), pp. 49–56.
6. D. Romano and M. Pinzger (2012), Analyzing the evolution of web services using fine-grained changes, in Proceedings of IEEE International Conference on Web Services (ICWS), 2012, pp. 392–399.
7. S. Wang and M. A. Capretz (2009), A dependency impact analysis model for web services evolution, in Proceedings of International Conference on Web Services (ICWS), pp. 359–365.
8. S. Wang, W. A. Higashino, M. Hayes, and M. A. M. Capretz (2014), Service evolution patterns, in Proceedings of IEEE International Conference on Web Services (ICWS), pp. 201–208.
9. Z. Gao, Y. Fan, C. Wu, W. Tan, J. Zhang, Y. Ni, B. Bai, and S. Chen (2016), SeCo-LDA: mining service co-occurrence topics for recommendation, in Proceedings of IEEE International Conference on Web Services (ICWS), pp. 25–32.
10. D. M. Blei and J. D. Lafferty (2006), Dynamic topic models, in Proceedings of ACM International Conference on Machine Learning (ICML), pp. 113–120.
11. D. Blei and J. Lafferty (2007), A correlated topic model of science, the Annals of Applied Statistics, no. 1.1, pp. 1735.
12. Y. Zhong, Y. Fan, K. Huang, W. Tan, and J. Zhang (2014), Timeaware service recommendation for mashup creation in an evolving service ecosystem, in Proceedings of IEEE International Conference on Web Services (ICWS), pp. 25–32.
13. K. C. Bhardwaj and R. K. Sharma (2015), Machine learning in efficient and effective web service discovery, J. Web Engineering Vol. 14, pp. 196–214.
14. S. Kamath and V. S. Ananthanrayana (2016), Semantic similarity based context-aware web service discovery using nlp techniques, J. Web Engineering, Vol. 15, pp. 110–139.
15. Z. Gao, Y. Fan, C. Wu, W. Tan and J. Zhang (2017), Service recommendation from the evolution of composition patterns, in Proceedings of IEEE International Conference on Services Computing (SCC), pp. 108–115.
16. X. Wang, C. Zhai, and D. Roth (2013), Understanding evolution of research themes: a probabilistic generative model for citations, in Proceedings of the ACM SIGKDD international conference on Knowledge discovery and data mining, pp. 1115–1123.
17. B. Tapia, R. Torres, H. Astudillo, and P. Ortega (2011), Recommending APIs for mashup completion using association rules mined from real usage data, in Computer Science Society, pp. 83–89.
18. P. L. F. da Silva, L. O. B. Santos and E. G. da Silva (2009), Towards a goalbased service framework for dynamic service discovery and composition, in Proceedings of IEEE International Conference on Information Technology: New Generations, pp. 302–307.
19. D. Zhovtobryukh (2007), A petri net-based approach for automated goal-driven web service composition, Simulation, Vol. 83, no. 1, pp. 33–63.
20. D. M. Blei, A. Y. Ng, and M. I. Jordan (2003), Latent dirichlet allocation, the Journal of machine Learning research, Vol. 3, pp. 993–1022.
21. Y. Jo, J. E. Hopcroft, and C. Lagoze (2011), The web of topics: discovering the topology of topic evolution in a corpus, in Proceedings of International Conference on World Wide Web (WWW), pp. 257–266.
22. T. M. J. Fruchterman and E. M. Reingold (1991), Graph drawing by force-directed placement, Software Practice and Experience, Vol. 21, no. 11, pp. 1129–1164.
23. A. P. Barros and M. Dumas (2006), The rise of web service ecosystems, IT professional, no. 5, pp. 31–37.
24. E. Al-Masri and Q. H. Mahmoud (2008), Investigating web services on the World Wide Web, in Proceedings of International Conference on World Wide Web (WWW), pp. 795–804.
25. Y. Yue, T. Finley, F. Radlinski, and T. Joachims (2007), A support vector method for optimizing average precision, in Proceedings of the 30th International Conference on Research and Development in Information Retrieval, pp. 271–278.
26. K. Goarany, G. Kulczycki, and M. B. Blake (2010), Mining social tags to predict mashup patterns, in Proceedings of ACM International Workshop on Search and Mining User-generated Contents (SMUC), pp. 71–78.
27. R. Agrawal, R. Srikant et al. (1994), Fast algorithms for mining association rules, in Proceedings of 20th International Conference on Very Large Data Base (VLDB), Vol. 1215, pp. 487–499.
28. C. Li, R. Zhang, J. Huai, X. Guo, and H. Sun (2013), A probabilistic approach for web service discovery, in Proceedings of IEEE International Conference on Services Computing (SCC), pp. 49–56.
29. Y. Zhang, T. Lei, and Y. Wang (2016), A service recommendation algorithm based on modeling of implicit demands, in Proceedings of IEEE International Conference on Web Services (ICWS), pp. 17–24.
Biographies
Zhenfeng Gao received the PhD degree in control theory and application in 2018 from Tsinghua University, China. He is currently working as the postdoctor at the Graduate school at Shenzhen, Tsinghua University as well as the postdoctoral research center at Sangfor Technologies Inc. His research interests include services computing, service recommendation, big data and blockchain technology.

Yushun Fan received the PhD degree in control theory and application from Tsinghua University, China, in 1990. He is currently a professor with the Department of Automation, Director of the System Integration Institute, and Director of the Networking Manufacturing Laboratory, Tsinghua University. From September 1993 to 1995, he was a visiting scientist, supported by Alexander von Humboldt Stiftung, with the Fraunhofer Institute for Production System and Design Technology (FHG/IPK), Germany. He has authored 10 books and published more than 300 research papers in journals and conferences. His research interests include enterprise modeling methods and optimization analysis, business process reengineering, workflow management, system integration, object-oriented technologies and flexible software systems, petri nets modeling and analysis, and workshop management and control.
Xiu Li received the PhD degree in mechanical manufacturing and automation from Nanjing University of Aeronautics and Astronautics in 2000. She was once a visiting scientist at University of Hong Kong, the Hong Kong Polytechnic University and Georgia institute of technology. She is currently a professor with the Department of Information, Shenzhen Graduate School, Tsinghua University. She has published more than 100 papers in international transactions and conferences. Her research interests include intelligent systems, data mining and pattern recognition.

Liang Gu received the PhD degree in Computer Software and Theory from Peking University in 2010. He worked as an associate research fellow at Yale university from 2010 to 2015. He is currently the chief scientist and the director of Sangfor Research Institute at Sangfor Technology Inc. As the person in charge of r&d technology at Sangfor, he is responsible for the technical framework improvement of a series of core products, including NGAF, AC, a Cloud HCI, aSAN and so on. These products have gained a leading market share in China and have been recognized by users and the market.

Cheng Wu received the BS and MS degrees in electrical engineering from Tsinghua University, Beijing, China. He is currently a fellow of Chinese Academy of Engineering. His research interests include complex system modeling and optimization, and modeling and scheduling in supply chains.
Jia Zhang received the MS and BS degrees in computer science from Nanjing University, China and the PhD degree in computer science from the University of Illinois at Chicago. She is currently an associate professor at the Department of Electrical and Computer Engineering, Carnegie Mellon University. Her recent research interests center on service oriented computing, with a focus on collaborative scientific workflows, Internet of Things, cloud computing, and big data management. She has published more than 130 refereed journal papers, book chapters, and conference papers. She is currently an associate editor of the IEEE Transactions on Services Computing (TSC) and of International Journal of Web Services Research (JWSR), and editor-in-chief of International Journal of Services Computing (IJSC). She is a senior member of the IEEE.
Journal of Web Engineering, Vol. 18_7, 579–626.
doi: 10.13052/jwe1540-9589.1872
© 2019 River Publishers